
Abstract
Cerebral amyloid angiopathy (CAA) is a common disorder of the elderly, a prominent comorbidity of Alzheimer’s disease, and causes vascular cognitive impairment and dementia. Previously, we generated a novel transgenic rat model (rTg-D) that produces human familial CAA Dutch E22Q mutant amyloid β-protein (Aβ) in brain and develops arteriolar CAA type-2. Here, we show that deposition of fibrillar Aβ promotes arteriolar smooth muscle cell loss and cerebral microhemorrhages that can be detected by magnetic resonance imaging and confirmed by histopathology. Aged rTg-D rats also present with cognitive deficits. Cerebral proteomic analyses revealed 241 proteins that were significantly elevated with an increase of >50% in rTg-D rats presenting with CAA compared to wild-type rats. Fewer proteins were significantly decreased in rTg-D rats. Of note, high temperature requirement peptidase A (HTRA1), a proteinase linked to transforming growth factor beta 1 (TGF-β1) signaling, was elevated and found to accumulate in cerebral vessels harboring amyloid deposits. Pathway analysis indicated elevation of the TGF-β1 pathway and increased TGF-β1 levels were detected in rTg-D rats. In conclusion, the present findings provide new molecular insights into the pathogenesis of CAA and suggest a role for interactions between HTRA1 and TGF-β1 in the disease process.
Introduction
Cerebral amyloid angiopathy (CAA) is a common form of cerebral small vessel disease (CSVD) in the elderly that is characterized by the accumulation of fibrillar amyloid β-protein (Aβ) in blood vessels of the brain.1 -3 CAA is a common vascular comorbidity in patients with Alzheimer’s disease and related disorders (ADRD), occurring in nearly 80% of AD cases, but also can occur sporadically affecting ~40% of individuals >80 years.2,4 -7 Cerebral vascular accumulation of Aβ can result in vessel wall disruption, perivascular neuroinflammation, cerebral infarction, microbleeds and, in severe cases, intracerebral hemorrhages (ICH).2,5,8 -14 Because of these vascular insults, CAA is a significant cause of vascular-mediated cognitive impairment and dementia (VCID).4 -6,15 Two prominent forms of CAA exist known as CAA type-2 and CAA type-1. 16 In CAA type-2, the more common form of disease, fibrillar amyloid accumulates largely within the vessel wall of meningeal and cortical small arteries and arterioles.1,2,16 On the other hand, with CAA type-1 amyloid deposition occurs primarily along capillaries, is associated with apolipoprotein E4, and commonly coexists with larger vessel CAA type-2.2,16,17
In addition to the prominent CAA that is found in ADRD and in sporadic cases of this condition, several monogenic familial forms of CAA exist that result from mutations that reside within the Aβ peptide sequence of the AβPP gene.18 -21 The first recognized form of familial CAA is the Dutch-type that results from an E22Q substitution in Aβ and causes early-onset and severe cerebral vascular amyloid deposition in the absence of parenchymal fibrillar plaques.18,19,22 -24 The E22Q mutation markedly enhances the fibrillogenic properties of Aβ compared to wild-type, non-mutated Aβ25,26 and can produce amyloid fibrils with a distinct structure. 27 Clinically, Dutch-type CAA presents with recurrent, and often fatal, ICH and is accompanied by progressive cognitive impairment that appears to be driven by the extensive vascular amyloid deposition present in this disorder.24 -26,28
CAA has gained further clinical significance for the treatment of AD. For example, several immunotherapies for the treatment of AD have recently become available to patients.29 -31 A serious, and potentially lethal, complication of these immunotherapies is the development of amyloid related imaging abnormalities that involve edema or hemorrhaging (ARIA-E and ARIA-H, respectively).32 -34 These deleterious events have been shown to be more common in patients with the presence of CAA.
To investigate the pathological progression of CAA, to identify biomarkers, and to test potential therapeutic interventions for this disease appropriate experimental animal models are required. Recently, we generated the rTg-D rat model of CAA type-2 that develop key pathological features of human disease including age-related larger vessel amyloid deposition accompanied by cerebral microhemorrhages and small vessel occlusions. 35 In the present study, we show aged rTg-D rats with cortical CAA present with cognitive deficits and distinct changes to their cerebral proteome.
Methodology
Animals
All work with animals was approved by the Institutional Animal Care and Use Committees at the University of Rhode Island (project #AN1718-008) and Yale University (project #2019-20132) and performed in accordance with the United States Public Health Service’s Policy on Humane Care and Use of Laboratory Animals and in compliance with the ARRIVE guidelines. 36 rTg-D rats expressing human AβPP harboring the Swedish K670N/M671L mutations and Dutch E693Q CAA mutation in neurons under control of the murine Thy1.2 promoter were generated and characterized as previously described. 35 Transgenic offspring are determined by PCR analysis of tail DNA using the following primers specific for human AβPP: 5′-CCTGATTGATACCAAGGAAGGCATCCTG-3′ and 5′-GTCATCATCGGCTTCTTCTTCTTCCACC-3′ (generating a 500-bp product). The rTg-D rats used in the present study were maintained as heterozygotes for the transgene and maintained on Sprague-Dawley background. Non-transgenic, Sprague-Dawley rats served as wild-type (WT) controls. All rats were housed in a controlled room (22 ± 2°C and 40%-60% humidity) on a standard 12 hours light cycle. Rat chow and water were available ad libitum. Both female and male rats were used in the present study.
Brain tissue collection and preparation
Euthanized rats were perfused with cold-PBS, forebrains were removed and dissected through the mid-sagittal plane. One hemisphere was fixed with 4% paraformaldehyde overnight at 4°C and subjected to increasing concentrations (10%, 20%, 30%) of sucrose in PBS, then embedded in Optimal Cutting Temperature compound (Sakura Finetek Inc., Torrance, CA, USA) and snap-frozen in dry ice. Sagittal sections were cut at 10 µm thickness using a Leica CM1900 cryostat (Leica Microsystems Inc., Bannockburn, IL, USA), placed in a flotation water bath at 40°C, and then mounted on Colorfrost/Plus slides (ThermoFisher Scientific, Houston, TX, USA). For the proteomic analysis, rTg-D rats were selected based on the presence of a moderate to severe cortical CAA load, defined as ⩾ 5% area vascular CAA coverage, and ranged from 18 to 24 months (M) of age, and were compared with WT rats aged to 12M. Collected hemispheres were frozen on dry ice and stored at −80°C prior to lysis for proteomic analysis.
Immunohistochemical analyses
Antigen retrieval was performed by treating the tissue sections with proteinase K (0.2 mg/ml) for 10 minutes at 22°C. Primary antibodies were detected with Alexa Fluor 594-conjugated donkey anti-rabbit or Alexa Fluor 488-conjugated goat anti-mouse secondary antibodies (1:1000). Staining for fibrillar amyloid was performed either using Amylo-Glo as described by the manufacturer (Biosensis Inc., Thebarton, South Australia) or staining with thioflavin S. The following antibodies were used for immunohistochemical analysis: rabbit polyclonal antibody to collagen type IV to visualize cerebral vessels (1:100; ThermoFisher, Rockford, IL); mouse monoclonal antibody to smooth muscle cell α actin (1:200, NBP 2-33006, Novus Bio); and antibody to HTRA1 (1:200, MAB2916, R&D Systems). Prussian blue iron staining was performed to detect hemosiderin deposits reflecting signs of previous microhemorrhage.
Ex vivo magnetic resonance imaging
Local magnetic susceptibility changes are sensitive to detecting blood products.37 -39 Therefore, we performed T2* weighted images taken ex vivo for detecting possible cerebral microhemorrhages in rTg-D rats. Ex vivo MRI scans were performed on rTg-D and WT rats (20-22M of age) using the active gadolinium staining technique as previously described.40,41 Five percent Gadoteric acid (Gd-DOTA; Guerbet LLC, Princeton, NJ, USA) was added to the fixative solution during perfusion fixation. Prior to imaging, the specimens were allowed to reach a room temperature (19-21°C) before being placed in a custom-made 3D printed MRI-compatible holder containing proton signal-free susceptibility-matched fluid (Galden Heat Transfer Fluids, HT230. Kurt J. Lesker, Company, USA).
All MRI acquisitions were performed on a Bruker 9.4 T/16 cm bore MRI instrument with a BGA-9S-HP imaging gradient interfaced to a Bruker Avance III console and controlled by Paravision 6.1 software (Bruker BioSpin, Billerica, MA, USA). A volume RF transmit and receive coil with an inner diameter of 4.0 cm was utilized for signal reception. 3D multiple gradient echo T2*-weighted sequence was acquired at an isotropic spatial resolution (0.1 mm × 0.1 mm × 0.1 mm) using the following parameters: TR = 60 ms; TE = 5, 10, 15, 20, 25, and 30 ms; flip angle = 20°; NA = 1 yielding a total scanning time of 40 minutes. 3D T2* weighted images were further summed along all TEs to create TE averaged T2* weighted image for each rat, which was evaluated for cerebral microhemorrhages. After imaging was completed, the fixed brains were sectioned in the coronal plane for histological analyses.
Radial arm maze procedure
For all behavioral analysis, rTg-D rats aged 20M were compared with age-matched WT controls. Prior to testing on the radial maze, the rats were water restricted for 23 hours per day (M-F). The rats were allowed ad libitum access to water on the weekends. Training was conducted on Monday through Friday of each week, with 1 training session being conducted per day. Salient visual cues were present throughout the testing room. The radial arm maze is a clear acrylic 8 arm maze with arms radiating from an octagonal center platform (Maze Engineers, Skokie, IL). Training on the maze was preceded by 3 habituation days during which the rats were placed on the maze and allowed to explore freely for 5 minutes. During habituation, a 0.1 ml Tang (1 tsp/700 ml filtered water) was placed at both the midpoint and in the recessed cup at the end of each arm. After the completion of these 3 days of habituation, training sessions were conducted with liquid rewards available only in the food wells located at the ends of the arms. Each training session was terminated when the rat visited the ends of each of the arms or 5 minutes expired. An error was scored each time the rat entered an arm that had been previously entered during the session or if the rat did not enter an arm within the training session. Dependent variables are number of errors, number of correct choices, and time to complete the maze, percent correct and total mean errors over the testing days.
Open field procedure
Following completion of the radial arm maze training, rats were assessed in the open field test to assess locomotor activity. The open field (Maze Engineers, Skokie, Il) measures 60 cm × 60 cm and is constructed with matte black acrylic. Prior to testing, the rats were habituated to the testing room for 20 minutes. After acclimation, rats were placed in the center of the open field and allowed to freely explore the arena for 10 minutes. During this period the behavior was recorded using AnyMaze behavioral tracking software (Stoelting Co., Wood Dale IL). AnyMaze software tracks several parameters of behavior, such as Total Distance traveled, rotations, quadrant entries, speed, and time spent in the center of the arena. Number of rears each animal displayed was manually recorded by the experimenter.
Protein digestion
Protein isolation and digestion was performed as previously described.42 -46 Briefly, pulverized brain tissue was lysed in 1X radioimmunoprecipitation assay (RIPA) buffer via sonication, and proteins were denatured by the addition of DTT (20 mM final concentration) and incubation at 95°C for 15 minutes with shaking. Alkylation was performed by addition of iodoacetamide (IAA) and 30 minutes dark incubation at room temperature. Proteins were precipitated and concentrated via chloroform methanol precipitation and resuspended in sodium deoxycholate (DOC) (3% w/v in 50 mM ammonium bicarbonate) prior to pressure cycling technology tryptic digestion in a barocycler (Pressure Bioscience Inc, Easton, MA) as previously described.42 -46 DOC was precipitated and removed by addition of formic acid (0.5% v/v final concentration) and centrifugation, and the peptide-containing supernatant was collected.
Analysis by LC-QTOF/MS
All proteomic experiments were performed as previously described.42 -46 Briefly, experiments were conducted on a SCIEX 5600 TripleTOF (AB Sciex, Concord, Canada) following chromatographic separation with an Acquity UPLC H-Class system (Waters Corp., Milford, MA) using an Acquity UPLC Peptide BEH C18 (2.1 mm × 150 mm, 300 Å, 1.7 µm) column preceded by an Acquity VanGuard pre-column (2.1 mm×150 mm, 300 Å, 1.7 µm), and all settings exactly as previously described.42 -46 Data was acquired in data independent acquisition mode (DIA) using Analyst TF 1.7.1 software (AB, Sciex).
Data processing
Raw spectral data was analyzed with Spectronaut™ (Biognosys, Schlieren, Switzerland) software as previously described,42 -46 using Spectronaut factory defaults except “used Biognosys’ iRT kit” and “PTM localization” were deselected, and normalization strategy set to “local.” Protein identification and quantification was performed by the Spectronaut™ Pulsar™ algorithm, referencing our previously formed in-house spectral library 42 combined with the fractionated rat brain, liver, kidney Biognosys Standard Spectral library, maintaining a false discovery rate of 0.01 at the protein, peptide, and protein spectrum match levels. Spectronaut output raw protein intensities were converted to molar concentrations (pmol/mg total protein) according to the total protein approach (TPA). 47 As done previously, we employed an imputed baseline concentration of 0.013 pmol/mg for protein concentrations of zero (filtered by Spectronaut for low intensity) in individual samples. Although this was not the lowest TPA concentration calculated here, this value is based on lowest calculated TPA concentrations across multiple Spectronaut analyses. Average molar concentrations were compared to identify differentially expressed proteins between WT rats and rTg-D rats. Statistical significance between groups was determined by student’s t test, and resultant p values were adjusted according to the Benjamini Hochberg method to account for multiple hypothesis testing. Differentially expressed proteins (DEPs) were thus defined as proteins with a ⩾50% increase or ⩾33% decrease in expression compared to WT animals and an adjusted P value of ⩽.05.
Results
rTg-D rats exhibit arteriolar CAA type-2 and loss of vascular smooth muscle
Previously we reported that rTg-D rats develop age-dependent fibrillar amyloid deposition in small arteries and arterioles of the brain. 35 Figure 1 presents an example of a coronal brain section from an aged rTg-D rat stained with thioflavin S to visualize fibrillar amyloid showing that prominent surface pial and cortical arteriolar CAA is evident. Further examination of vessels at higher magnification shows that fibrillar amyloid is deposited in the pial and cortical small arteries and arterioles leading to depletion of vascular smooth muscle cells and disrupted integrity of the affected vessels (Figure 2B, D and F). These data further support that rTg-D rats are an appropriate model of larger vessel CAA type-2.

Cortical CAA type-2 in aged rTg-D rat. Representative coronal brain section from a 22 M old rTg-D rat immunolabeled with an antibody to collagen IV to identify cerebral blood vessels (red) and stained with thioflavin S to visualize fibrillar amyloid (green) showing the presence of abundant of pial and cortical arteriolar CAA. Scale bar = 1 mm.
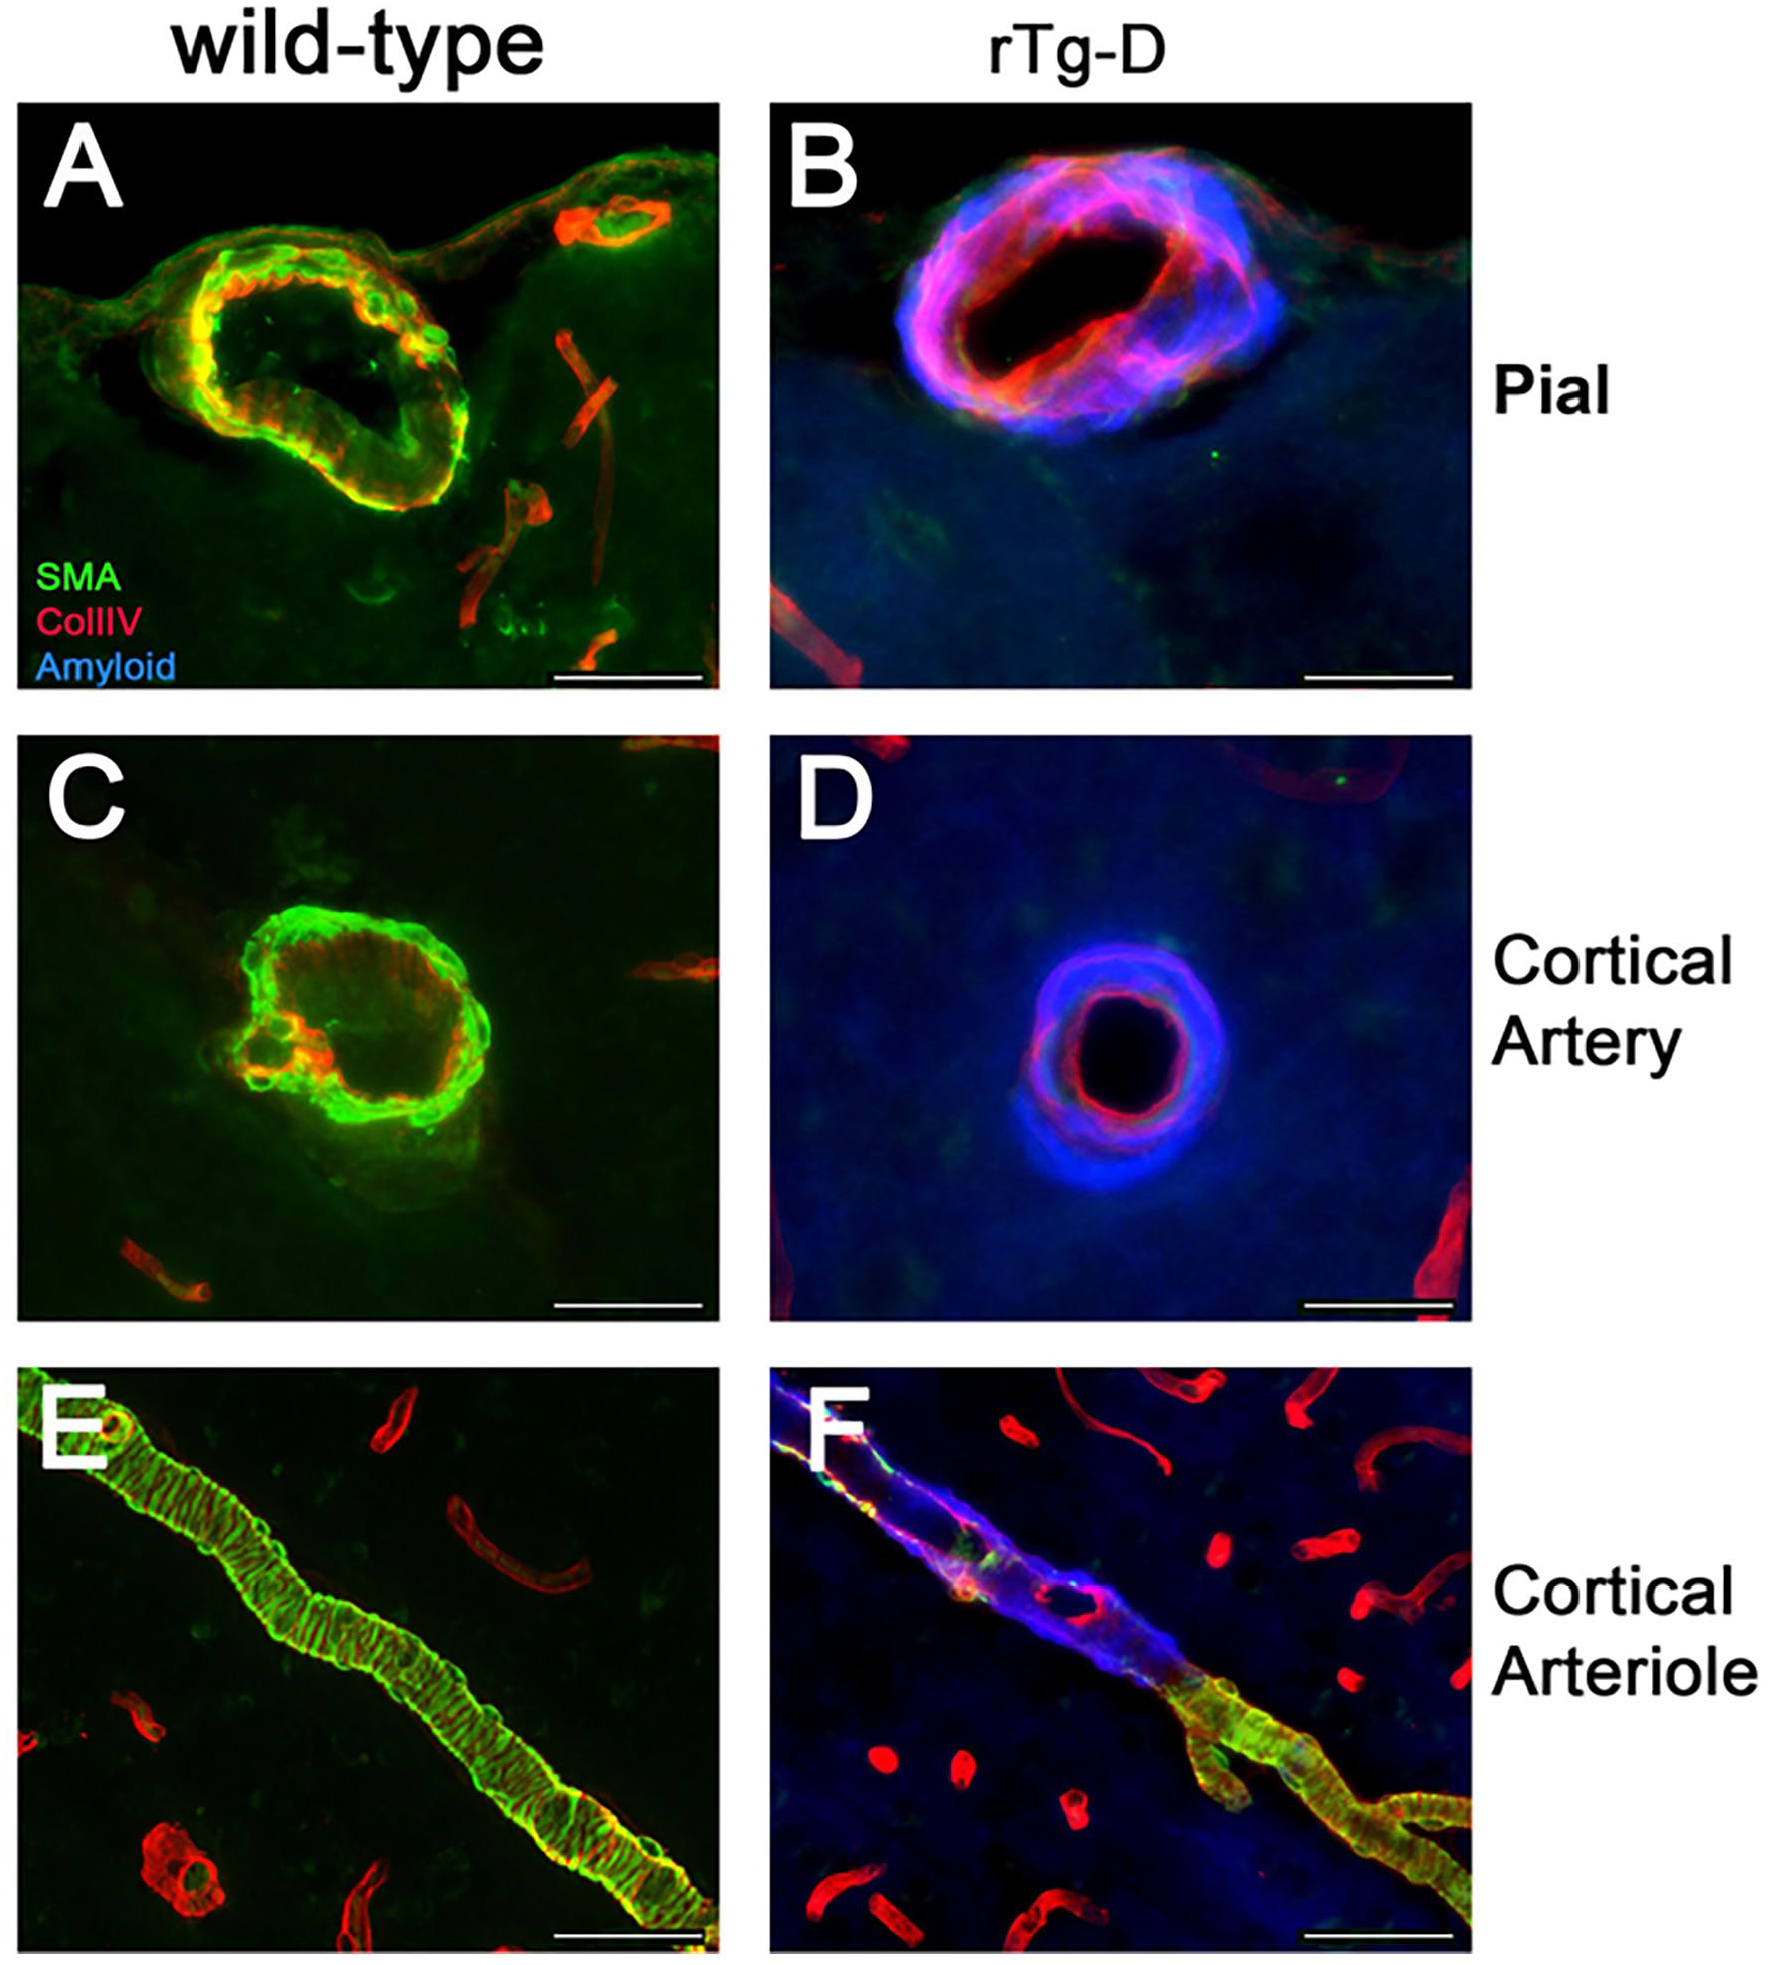
Arteriolar deposition of fibrillar amyloid and loss of smooth muscle cells in rTg-D rats. Brain sections from a WT rat (20 M) (A, C and E) or similarly aged rTg-D rat (22 M) (B, D and F) were immunolabeled with antibodies to collagen IV to identify cerebral blood vessels (red) or to smooth muscle cell α actin to identify smooth muscle cells (green) and stained with AmyGlo to visualize fibrillar amyloid (blue). Representative images from pial arteries (A and B); cortical arteries (C and D); and cortical arterioles (E and F). Scale bars = 50 µm.
rTg-D rats develop microhemorrhages detected by MRI and histological confirmation
The presence of cerebral microhemorrhages as detected by T2* mapping by MRI was performed in rTg-D rats at 20 to 22 M. In a representative rTg-D rat, the T2* image showed local areas with very low T2* values (T2* ⩽ 20 ms; noted by red arrows) suggesting the presence of microhemorrhages as shown in Figure 3A. Notably, similarly aged wild-type (WT) rats showed no such areas in the cortex (data not shown). To support the MRI findings presented in Figure 3A, we performed histological evaluation for fibrillar amyloid and perivascular hemosiderin deposits for further evaluation of the focal areas with low T2* values in the same rTg-D rat brain. Figure 3B presents a coronal brain section, at a similar depth of the MRI image in Figure 3A, that was stained with thioflavin S showing numerous vessels with deposits of fibrillar amyloid in the area also exhibiting putative microhemorrhages (indicated by red arrows). Higher magnification of this region (highlighted region in Figure 3B) clearly shows robust arteriolar amyloid deposits (Figure 3C). Staining of an adjacent tissue section shows the presence of perivascular hemosiderin consistent with the MR imaging data (Figure 3D). Together, these findings show that in rTg-D rats cerebral microhemorrhages can be detected by MRI and confirmed by histological analysis and occur in brains with cortical vascular amyloid deposits.

Cortical microhemorrhages in rTg-D rat detected by MRI with histological confirmation. Aged rTg-D rats were scanned for the presence of microbleeds using T2* parametric mapping. (A) T2* parametric map from a 22 M rTg-D rat, Red arrows point to low T2* (⩽20 ms) signals indicating the presence of ferritin (microhemorrhage). (B) Coronal brain section from the same rTg-D rat and plane as shown in (A) immunolabeled with an antibody to collagen IV to identify cerebral blood vessels (red) and stained with thioflavin S to visualize fibrillar amyloid (green). Scale bar = 1 mm. (C) Higher magnification of the area indicated in (B) showing the presence of arteriolar CAA. Scale bar = 50 µm. (D) Adjacent tissue section to (C) stained for hemosiderin to identify microhemorrhage (blue). Scale bar = 50 µm.
rTg-D rats exhibit cognitive impairments
To investigate if aged rTg-D rats presenting with CAA show cognitive deficits we conducted testing in the radial arm maze (RAM) task. Analysis of number of errors during training was conducted using a two-way repeated measures ANOVA, with days during the training period as the repeated measure and genotype (rTg-D vs WT) as a between group factor. The effect of genotype was statistically significant [F(1,16) = 5.277, P = .0354; Figure 4A], primarily because rTg-D rats did not display the same reduction in errors over time that the age-matched WT rats exhibited [Time × Genotype F(8,128) = 3.135, P = .0029]. Using another method to compare the genotypes, mean total errors collapsed over the 9 training days was calculated. The total mean error over the 9 training days is shown in Figure 4B. A 2 tailed unpaired t-test revealed a significantly higher number of total errors were committed by the rTg-D rats compared to age-matched WT rats [t = 2.297 (df = 16) P = .0354].

Aged rTg-D rats exhibit deficits in the radial arm maze (RAM). Cohorts of 20 M old rTg-D rats (n = 11, red) and similarly aged WT rats (n = 7, black) were evaluated for spatial working memory in the RAM task. (A) Working errors per day for each cohort over a 9-day training period in RAM. (B) Mean overall number of errors per rat in each cohort in RAM. (C) Mean total distance traveled per rat in each cohort in the Open Field Task. Data are presented as mean ± SEM.
To determine whether gross motor deficiencies were a factor in the impaired performance of the rTg-D rats seen in the RAM task we conducted an analysis of their activity in an open field. The distance traveled over a 10 minute observation period was measured in a group of aged rTg-D rats and age-matched WT rats. The unpaired 2 tailed t-test showed no significant differences between the 2 groups [(t = 0.9961 (df = 12) P = .3389; Figure 4C]. Together, these findings demonstrate that aged CAA type-2 rTg-D rats exhibit deficits in the RAM task that are not attributed to motor deficits.
Differential proteomic analysis in rTg-D rats
To characterize the cerebral proteome and identify altered proteins with potential mechanistic interest in CAA type-2 progression, we conducted discovery differential proteomic analysis of whole brain tissue from rTg-D rats. Individual rTg-D rats, between 18 and 24 M of age, were selected based on the presence of significant cortical CAA load, with each rat presenting with ⩾5% vascular amyloid coverage (Figure 5A). A total of 4149 distinct protein groups were identified across the experiment, with a similar number of protein groups identified for each individual sample of rTg-D and WT rat brains (Figure 5B). To identify differentially expressed proteins (DEPs), TPA concentrations were averaged for both rTg-D and WT groups, and compared head-to-head using a student’s t test, with p values adjusted for multiple hypothesis testing using the Benjamini-Hochberg correction. DEPs were defined as proteins with ⩾50% increase or ⩾33% decrease (1.5 or −1.5 FC) and adjusted p value of ⩽.05. Differential analysis revealed a total of 261 significant DEPs with 241 upregulated (Supplement Table S1) and 20 down regulated proteins (Supplement Table S2). Primary component analysis (PCA) of the DEPs performed using custom scripts in RStudio revealed clear clustering of rTg-D and WT groups (Figure 5C). A volcano plot depicting all analyzed proteins, indicating DEPs and highlighting markers of interest is shown in Figure 5D.
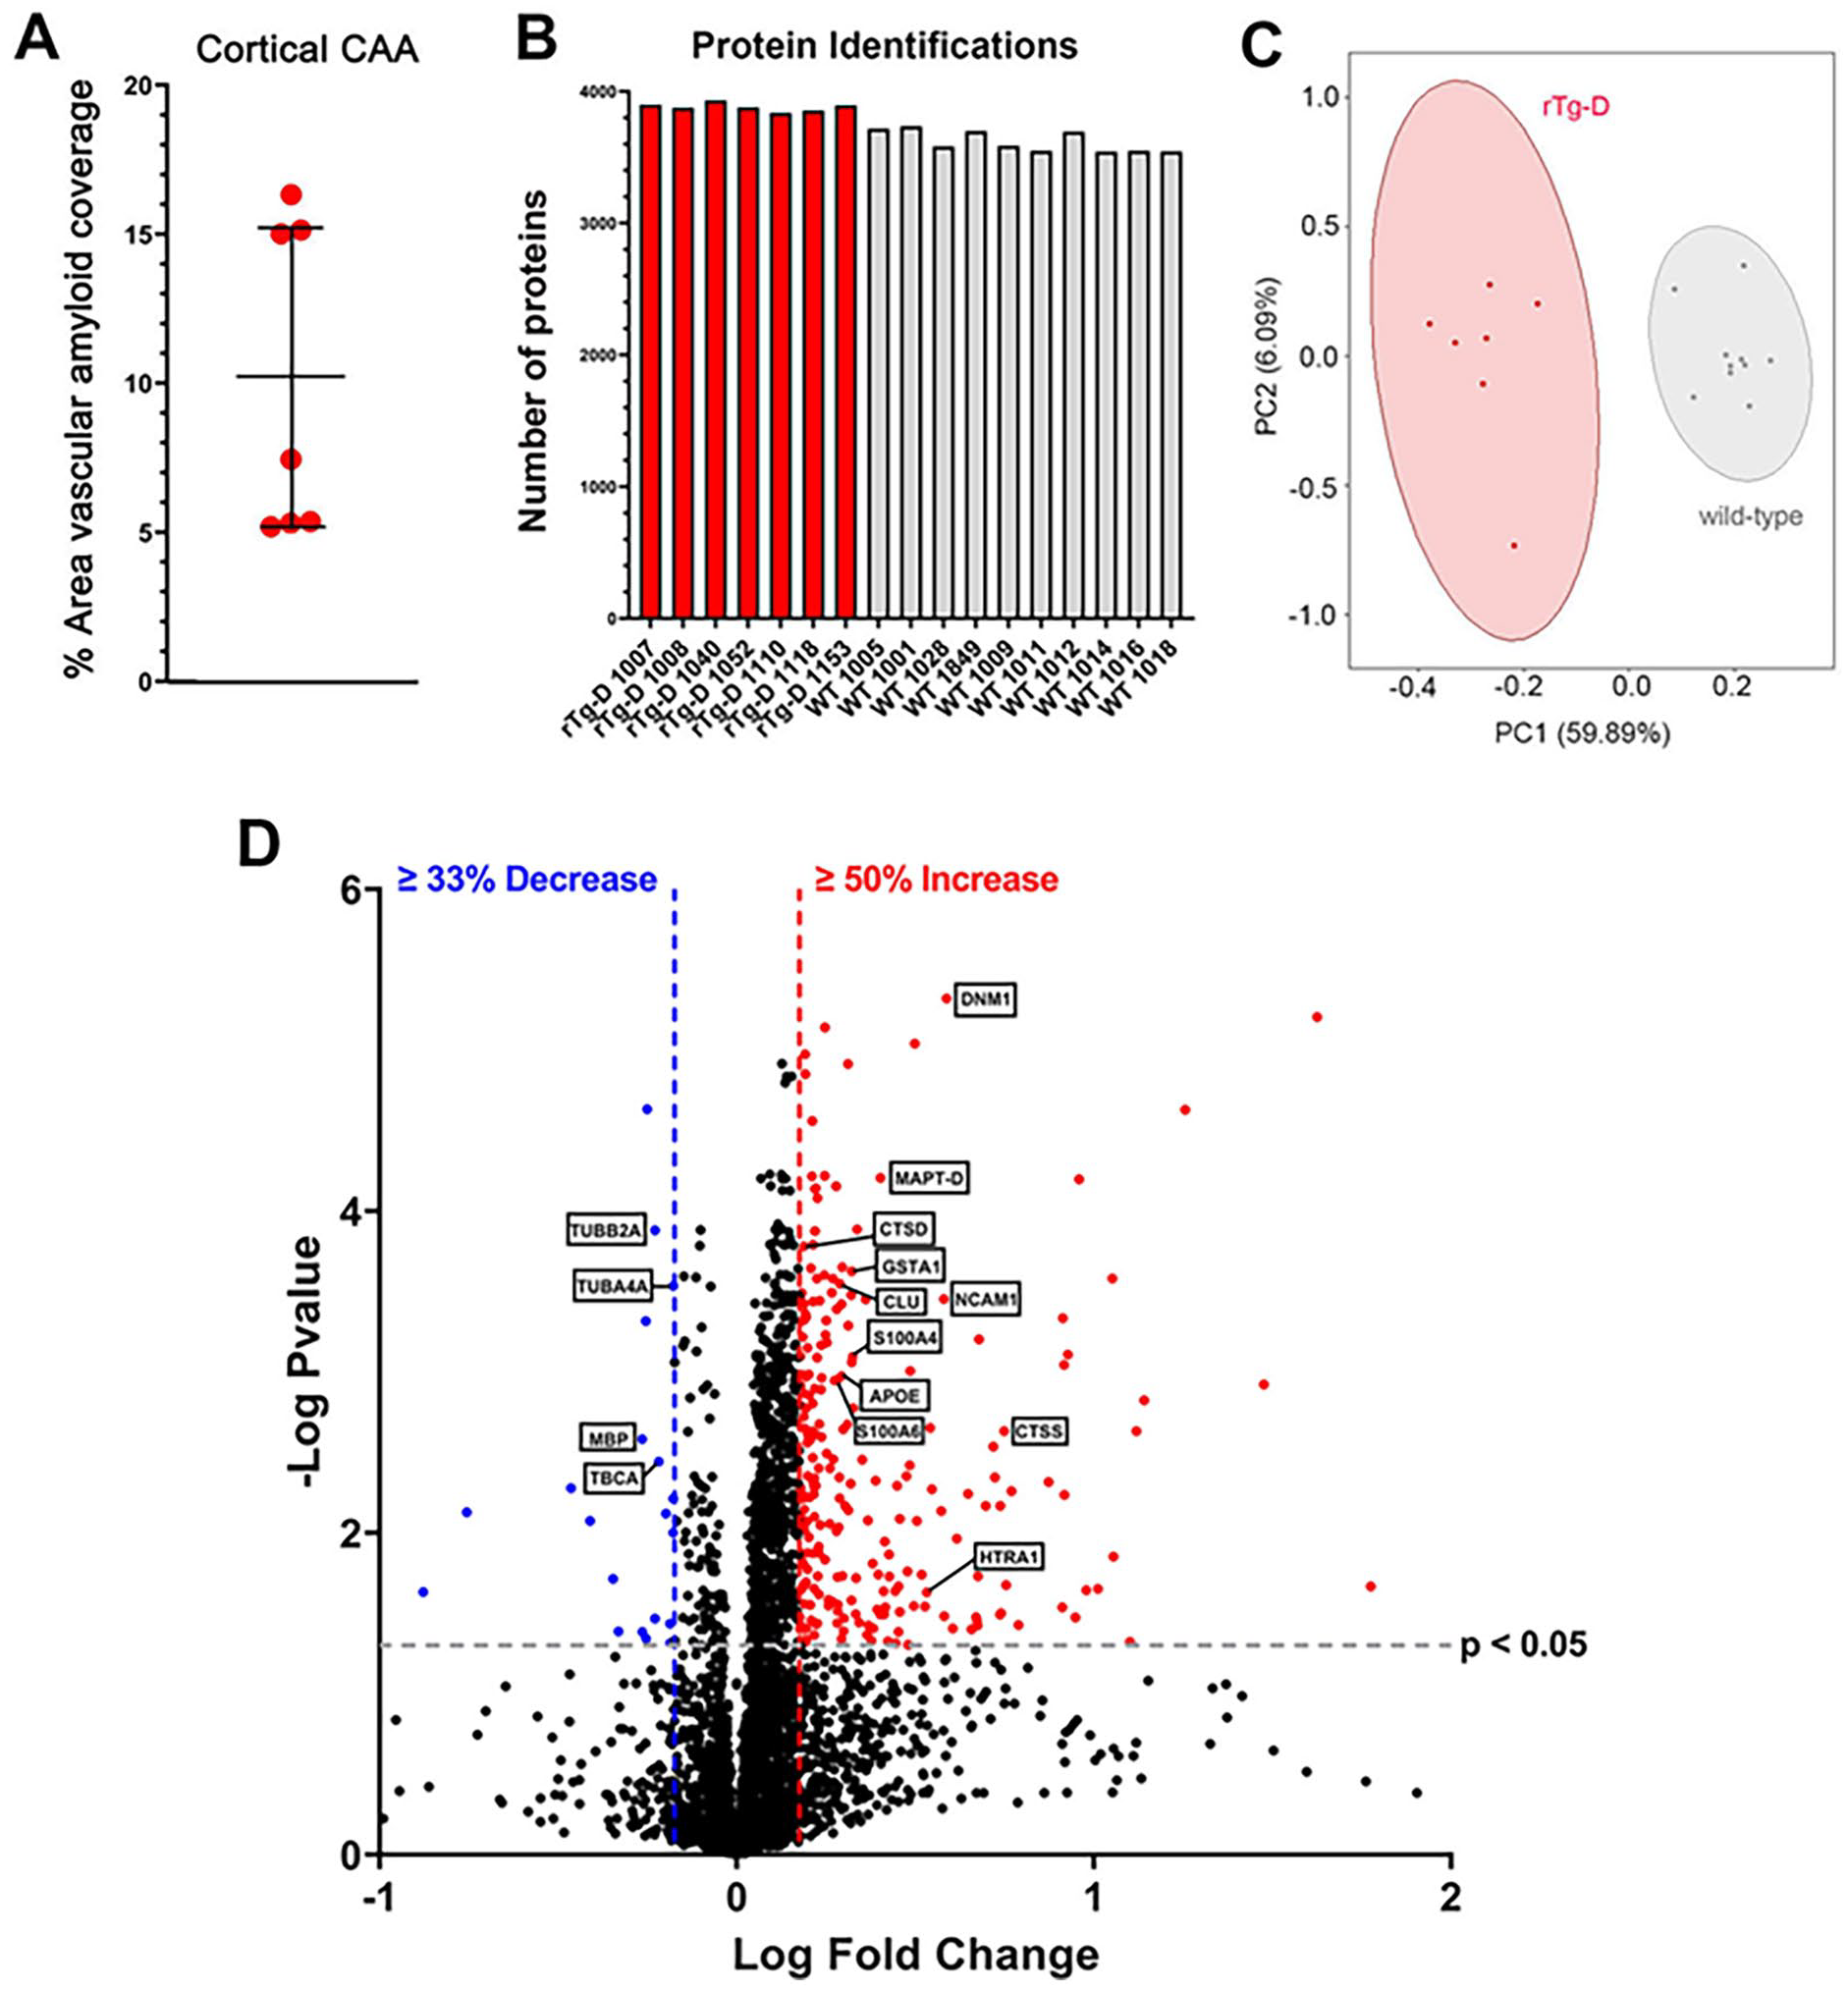
Cerebral proteomic analyses of rTg-D and wild-type rats. (A) A cohort of 22 to 24 M rTg-D rats that exhibited moderate to high levels of cortical CAA were selected for cerebral proteomic analysis. Data presented are mean ± SD. (B) Number of proteins identified from each rTg-D rat (n = 7) and WT rat (aged 12 m, n = 10). (C) Primary component analysis of DEPs shows that rTg-D rats and WT rats segregate as groups. (D) Volcano plot generated from Log Fold Change and -Log p values for all proteins detected in rTg-D rat brains. Points representing upregulated proteins (⩾50% increase, P ⩽ .05) and downregulated (⩾33% decrease, P ⩽ .05) proteins in rTg-D rats relative to WT rats are shown in red and blue, respectively.
In general, we observed a great degree of similarity of individual relative protein expression within the rTg-D and WT groups for upregulated proteins (Figure 6A). Individual expression of four markers of interest, DNM1, CLU, CTSD, and CTSS is further highlighted in Figure 6B to E. DNM1 has been shown to regulate distribution of BACE-1 and thus modulates Aβ generation. 48 Specifically, treatment with dynamin inhibitors resulted in Aβ levels, while dyn1-/- primary neurons and dyn1 haploinsufficient AD transgenic mice showed reduced Aβ levels. 48 On the other hand, dysregulation of dynamin-mediated endocytosis has been proposed as a mechanism for synaptic dysfunction observed in AD. 49 CLU, another endocytic protein, has previously been reported to be upregulated in leptomeningeal arteries where vascular amyloid is present in brains of CAA patients, and has been identified as upregulated and potential marker of CAA by us in our rTg-DI rat model of capillary CAA.42,43,45,50 We have also previously reported that while CLU is elevated in the CSF of capillary CAA rTg-DI rats, it is reduced by 20% in CSF of CAA patients. 51 The cathepsins CTSD and CTSS have both been previously reported by us as elevated in the brains of capillary CAA rTg-DI rats and CSF, and are thus also potentially interesting markers of CAA.42,45,51

Upregulated DEPs in rTg-D rat brains. (A) Heat map depicting the top upregulated DEPs (⩾50% increase) in 20 to 24 M rTg-D rat brains compared with their respective expression levels in 12M WT rat brains. Red indicates increased, blue indicates decreased, gray indicates not significantly altered expression; color intensity correlates with degree of change as indicated by the expression ratio reference legend. Histograms depicting the expression levels (pmol/mg total protein) of DNM1 (B), CLU (C), CTSD (D), and CTSS (E) in the brains of WT rats (black circles) and rTg-D rats (red circles). Individual points represent individual animals. Bars represent the mean ± SD protein concentration from n = 10 WT rats and n = 7 rTg-D rats. ***P < .001; ****P < .00001.
Individual relative protein expression of downregulated proteins was also similar within the groups (Figure 7A), and although we observed far fewer significantly decreased proteins there were several proteins of interest. Neurodegeneration as seen in AD and CAA is associated with microtubule destabilization, 52 thus the down regulation of TUBB2A (Figure 7B), TUBA4A (Figure 7C), and the tubulin folding chaperone, TBCA (Figure 7E), could be linked to potential microtubule disruption and neurodegeneration in the rTg-D rats. Furthermore, TBCA silencing in mammalian cell lines revealed its essential role in cell viability, where cytoskeleton disruption led to cell cycle arrest and cell death. 53 MBP is essential for myelination of axons, and loss of MBP leads to demyelination and loss of axonal integrity, 54 and therefore downregulation of MBP might also be linked with neurodegeneration in the rTg-D rats. We previously reported downregulation of MBP in brain regions of capillary-CAA rTg-DI rats, including the white matter-rich corpus callosum.41 -43,45 Thus, these downregulated proteins may provide a signature of microtubule dysfunction, demyelination, and eventual neurodegeneration in the rTg-D rat model of CAA-type 2.

Down regulated DEPs in rTg-D rat brains. (A) Heat map depicting the down regulated DEPs (⩾33% decrease) in 20 to 24 M rTg-D rat brains compared with their respective expression levels in 12M WT rat brains. Red indicates increased, blue indicates decreased, gray indicates not significantly altered expression; color intensity correlates with degree of change as indicated by the expression ratio reference legend. Histograms depicting the expression levels (pmol/mg total protein) of TUBB2A (B), TUBA4A (C), MBP (D), and TBCA (E) in the brains of WT rats (black circles) and rTg-D rats (blue circles). Individual points represent individual animals. Bars represent the mean ± SD protein concentration from n = 10 WT rats and n = 7 rTg-D rats. ***P < .001; ****P < .00001.
HTRA1 is upregulated in rTg-D rats and co-localizes with vascular amyloid deposits
Recently, the serine proteinase HTRA1 has been reported to accumulate and co-localize with vascular amyloid deposits in CAA patients.55,56 Furthermore, we have reported widespread and consistent upregulation of HTRA1 in brains of the rTg-DI rat model of capillary CAA, co-localizing with amyloid deposits.42,45,46 Loss of function mutations in the Htra1 gene causes the CSVD cerebral autosomal-recessive arteriopathy with subcortical infarcts and leukoencephalopathy (CARASIL). 57 Additionally, proteomic studies in both CAA and cerebral autosomal-dominant arteriopathy with subcortical infarcts and leukoencephalopathy (CADASIL) have reported sequestration of HTRA1 with “pathologic proteins deposits” and it has been posited that resultant impairment of HTRA1 activity is a mechanistic link between CAA, CARASIL, and CADASIL. 58 Here, we observed marked increase in HTRA1 expression in rTg-D rat brains (Figure 8A). Further analysis by immunolabeling not only confirmed the elevated presence of HTRA1 in rTg-D brain tissue, but also revealed a striking co-localization with vascular amyloid accumulations (Figure 8B–D). Thus, our results are consistent with the previous findings, and further suggest that HTRA1 may be an important marker of CAA with mechanistic implications.
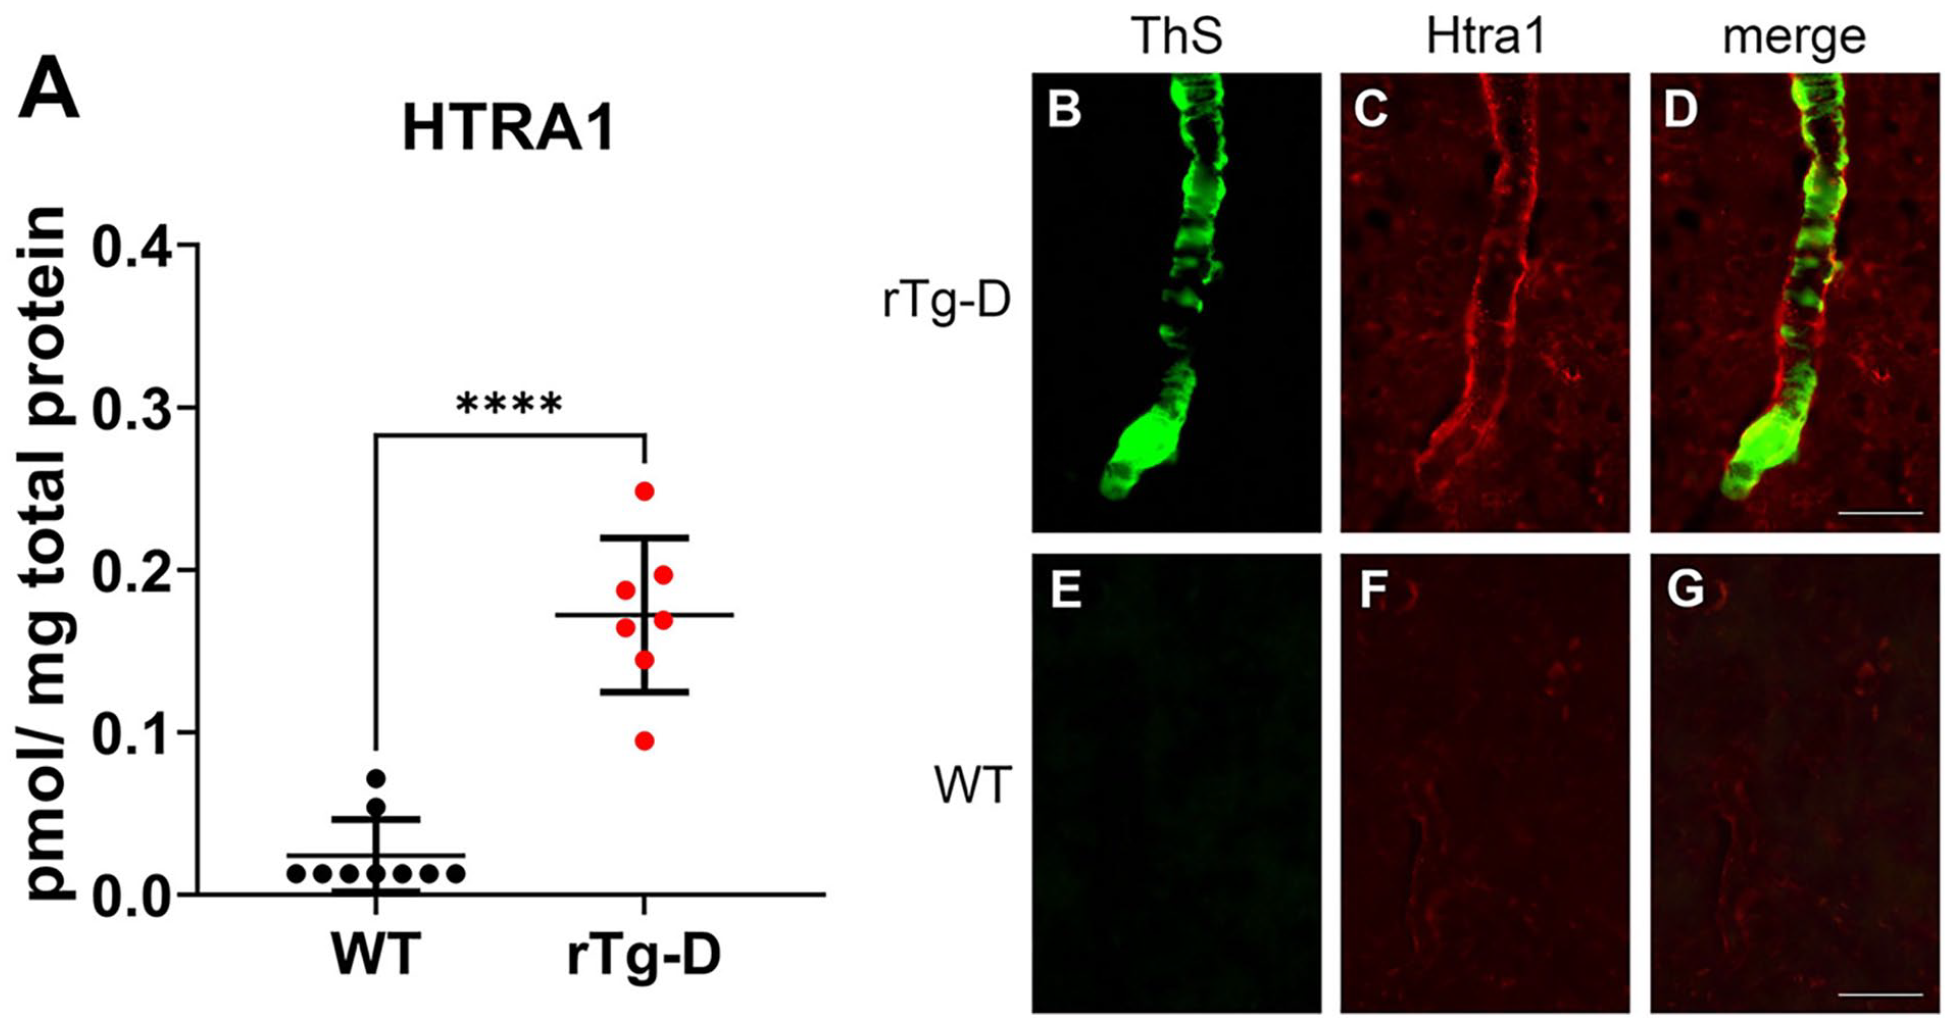
Increased HTRA1 levels in rTg-D rats. (A) Histogram depicting the expression levels (pmol/mg total protein) of HTRA1 in the brains of 12M WT rats (black circles) and 20 to 24 M rTg-D rats (red circles). Individual points represent individual animals. Bars represent the mean ± SD protein concentration from n = 10 WT rats and n = 7 rTg-D rats. Brain sections from a 20M rTg-D rat (B–D) and a 20M WT rat (E–G) were stained with thioflavin S to detect vascular fibrillar amyloid (B and E; green) and rabbit polyclonal antibody to HTRA1 (C and F; red). Merged images are presented in (D and G). Scale bars = 50 µm.
TGF-β1 is elevated in rTg-D rat brains
The inflammatory cytokine TGF-β1 has various reported functions in regulating BBB integrity, both to induce endothelial to mesenchymal transition that can lead to BBB dysfunction, but also promote tight barrier phenotypes in brain endothelial cells that reduces BBB permeability.59,60 Recently, we reported longitudinal increases of TGF-β1 expression in brain regions of early- and late-disease stages in the rTg-DI rat model of capillary CAA, 45 thus identifying TGF-β1 as a potential marker for CAA with possible impact on BBB integrity. Although we did not detect TGF-β1 in our proteomic analysis, we utilized Ingenuity Pathway Analysis (IPA) (Qiagen) to identify proteins in our data set consistent with upregulation TGF-β1 activation, revealing 17 proteins (Figure 9A). Based on this observed enrichment, we investigated TGF-β1 in rTg-D rat brains via ELISA (Figure 9B) revealing significantly increased levels in the rTg-D rats.
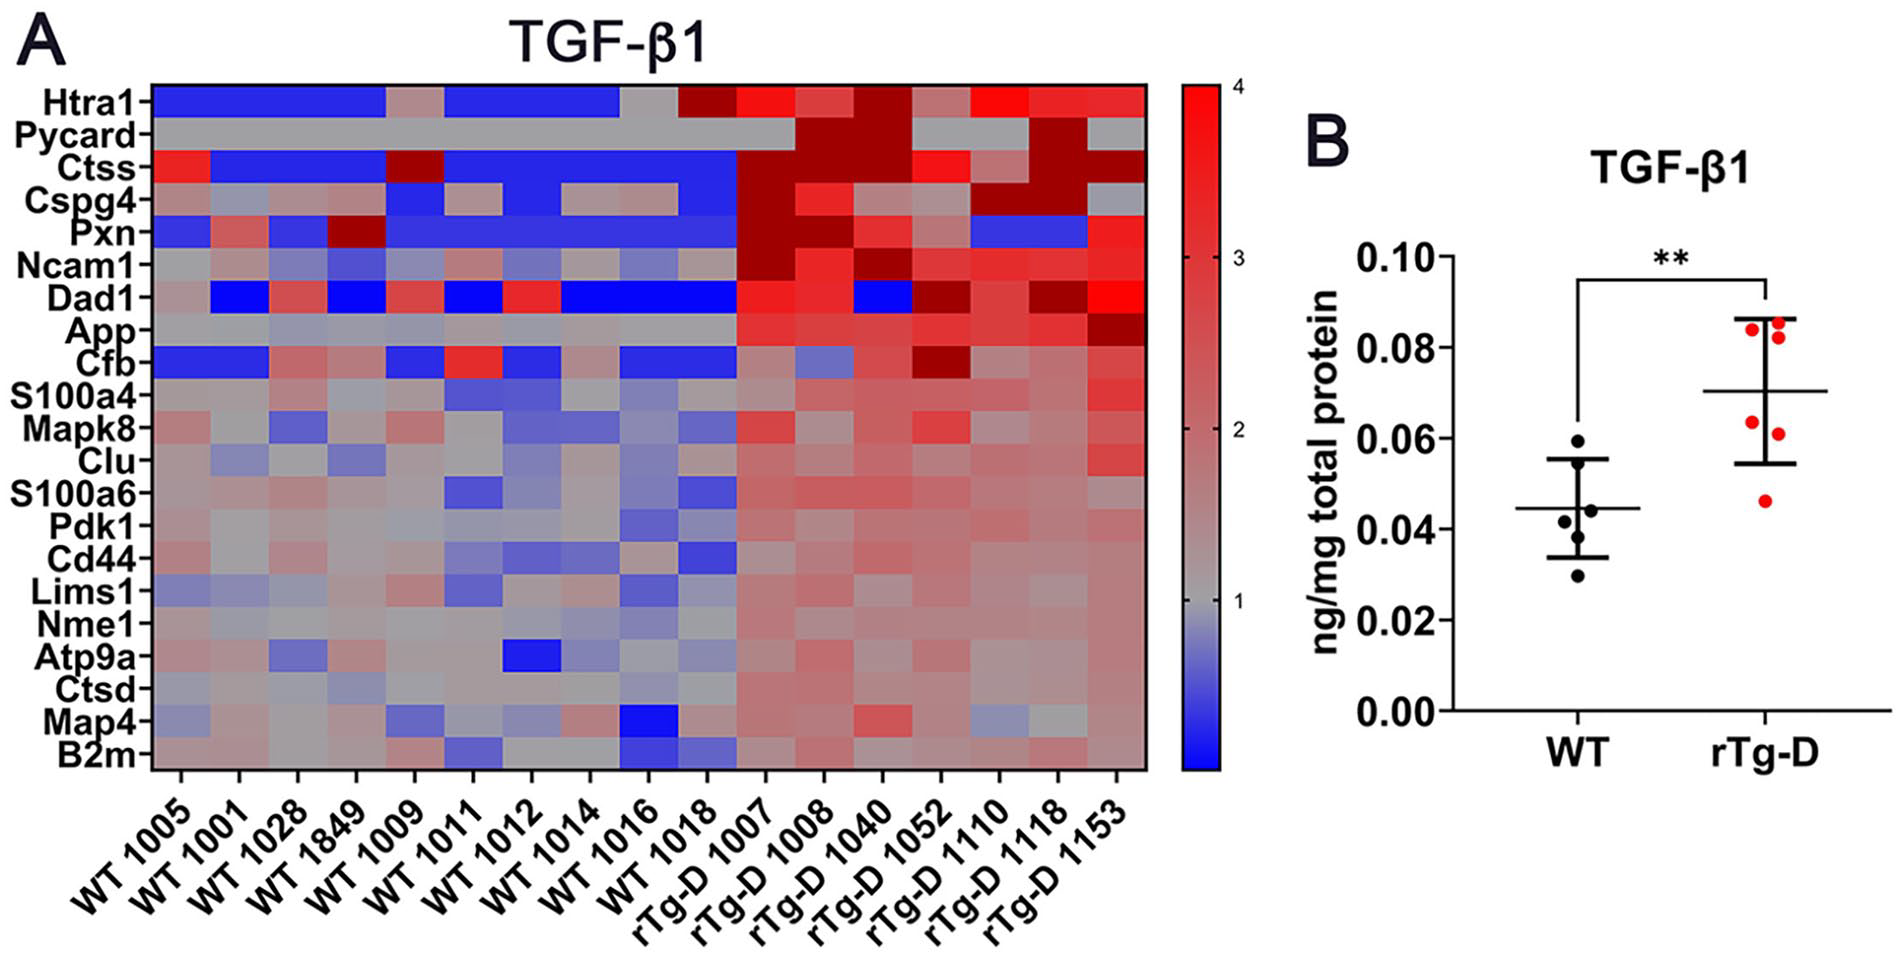
Increased TGF-β1 in rTg-D rats. (A) Heat map depicting the expression levels of proteins associated with TGF-β1 activation in 20 to 24 M rTg-D rat brains compared with their respective expression levels in 12M WT rat brains. Red indicates increased, blue indicates decreased, gray indicates not significantly altered expression; color intensity correlates with degree of change as indicated by the expression ratio reference legend. (B) TGF-β1 protein levels (pg/mg) in pulverized whole brain tissue from aged 20 to 24 M rTg-D rats and 12M WT rats as detected by ELISA. Bars indicated mean ± SD of n = 6 rats per group. **P < .01.
Ingenuity pathway analysis of DEPs in rTg-D rat brains
We utilized Ingenuity Pathway Analysis (IPA) to conduct pathway enrichment and activation analysis of our DEPs dataset. IPA considers the directional differential expression of proteins both upstream and downstream of protein regulators, or those contributing to canonical pathways and disease functions to deliver not only pathway enrichment information, but predictions of activation or inhibition with significance given in z scores. 61 IPA predicted activation (z score > 2) for upstream regulators thrombin (F2) and IL1, canonical pathways “Production of Nitric Oxide and Reactive Oxygen Species in Macrophages,” “Neutrophil Extracellular Trap Signaling Pathway, and the “S100 Family Signaling Pathway,” and the disease functions related to migration of myeloid cells, inflammatory response, and migration of neuroglia (Figure 10). Activation of thrombin is consistent with our observations that the rTg-D model develops cerebral vessel occlusions and cerebral microbleeds indictive of thrombus formation. 35 Other indicated pathways and functions are consistent with the presence of neuroinflammation but indicate an axis between peripheral and central inflammatory mechanisms, including neuroglia, potentially multiple myeloid cell populations, and neutrophils.

Summary of Ingenuity Pathway Analysis. Activated upstream regulators (Thrombin, IL1β), Canonical Pathways (Production of Nitric Oxide and Reactive Oxygen Species in Macrophages, Neutrophil Extracellular Trap Signaling Pathway, S100 Family Signaling Pathway), and Downstream Effects and Disease Functions (Migration of Myeloid Cells, Inflammatory Response, Migration of Neuroglia) as predicted by IPA analysis of DEPs in 20 to 24 M rTg-D rat brains. Bars represent activation Z scores as calculated by IPA, with significant z > 2 cutoff indicated by dashed line.
Discussion
Underlying mechanisms linking the vascular deposition of Aβ to the development of severe vasculopathies in CAA such as, thrombotic occlusions, vascular degeneration, microhemorrhage, and perivascular inflammation remain poorly understood. Therefore, a prominent goal of this study was to define a signature of DEPs in the rTg-D rat model of CAA type-2 to provide molecular insight to the presenting pathology. Unlike our previously reported rTg-DI rats, a specific model of CAA type-1, 62 the rTg-D rats express AβPP harboring only the Dutch-type familial mutation (E22Q), resulting in Aβ vascular deposition restricted to the meningeal and intracortical cerebral arterioles (Figures 1 and 2), and therefore represents a specific model of Dutch-type CAA type-2. In addition to arteriolar CAA, the rTg-D rats display loss of vascular smooth muscle (Figure 2), microhemorrhage (Figure 3), and cognitive deficits (Figure 4). Thus, the rTg-D rat is an advantageous model for specific investigation of molecular mechanisms and pathologic progression of CAA type-2 in the absence of capillary CAA and parenchymal plaque pathology.
Recently, proteomic evaluation of CAA in human samples has been reported, largely involving cerebral vessel isolation from brain tissue of AD patients diagnosed with comorbid CAA.50,55,56,63 Multiple DEPs highlighted in human CAA proteomics studies overlap with our findings here. For example, several studies have reported upregulation of CLU,50,55,56 as we do here. Interestingly, despite the consistent reporting of upregulated CLU in brain tissue, which we also observed in the rTg-DI rat model of CAA type-1,42,43,45,46 we also reported a 20% decrease in CLU in cerebral spinal fluid (CSF) from CAA patients. 51 CLU is reported to bind Aβ fibrils directly and alter Aβ aggregation, and CLU accumulates in CAA microvessels.64,65 It is possible that due to its direct binding, CLU is sequestered within Aβ aggregates, leading to its observed increases in brain tissue and decrease in CSF. Hondius et al. and Zellner et al. also reported upregulation of HTRA1 and APOE,55,56 while Handa et al reported upregulation of GFAP. 63 However, despite these common proteins, relatively few of the 261 DEPs in the present study were shared by these other studies in human patients. There are several possible explanations for these differences. Firstly, the human studies were largely focused on isolated vessels from AD patients with comorbid CAA, and therefore were from patients that also displayed parenchymal amyloid pathology, tauopathy, and perhaps some level of CAA type-1 in addition to CAA type-2, whereas the rTg-D rat is a model exclusively of CAA type-2. Secondly, the differences could be the result of species differences between the rat model and human cases. Thirdly, except for 1 case in 1 study, the human cases studied were comprised of non-mutated Aβ, whereas rTg-D vascular Aβ depositions are comprised of mutated Aβ harboring the familial Dutch E22Q CAA mutation, possibly leading to the observed differences. Indeed, Dutch mutant Aβ fibrils appear to exhibit a distinct structure 25 that may elicit different responses uniquely altering the cerebral proteome. Finally, human cases exist on a diverse background of genetic, environmental, lifestyle and medication backgrounds, introducing an array of potentially confounding variables impeding the ability to reliably identify CAA type-2 specific changes. A particular advantage of rat preclinical models is their genetic, environmental, and lifestyle conditions can be maintained for consistency, removing these potential confounders, and enabling more uniform populations studies. While heterogeneity in severity of CAA load is observed in the rTg-D model, we have addressed this potential confounder in the present study by implementing a minimum CAA load of ⩾5% area vascular CAA coverage as a selection criterion for proteomic analysis subjects. Thus, with fewer external confounding variables, and despite pathological heterogeneity of the model, the rTg-D rats in the proteomic analysis here represent a much more uniform study population compared with the referenced human studies.
One caveat of our study is that the rTg-D rats, aged 20-24 M, in the proteomic analysis were not aged matched with the control WT rats, aged 12 M, and therefore it is possible that some of the observed protein expression changes are a result of normal aging in the rat brain. However, WT rats aged to 24 M do not exhibit CAA or severe related pathologies, such as cerebral microbleeds, suggesting the rTg-D proteome would be similarly different from 24 M WT rats. Nevertheless, to control for this potential confounding variable, it would be important to compare rTg-D rats with age matched WT rats in all future proteomic studies. Down regulation of TUBB2A, TUBA4A, and TBCA (Figure 7) could be indicative of microtubule destabilization, which often contributes to neurodegeneration observed in CAA and ADcases. 52 Additionally, TBCA is reported to harbor an essential role in maintaining cell viability, as its silencing caused cytoskeleton disruption that ultimately lead to cell cycle arrest and cell death. 53 Finally, MBP, with known essential roles in axonal myelination and stabilization 47 was also decreased in the rTg-D rats. 54 Taken together, these downregulated proteins suggest a signature of microtubule and axonal destabilization, demyelination, and neurodegeneration, and could point to mechanisms underlying the neuronal dysfunction leading to cognitive impairment observed in CAA type-2.
Numerous studies including transcriptomic analysis of human hereditary Dutch-type CAA, and our previous analysis of the rTg-DI rat model, have linked upregulation of TGF-β1 and CAA.45,66,67 Therefore, despite not detecting TGF-β1 in our proteomic analysis, we investigated evidence of TGF-β1 activation using IPA pathway analysis by mapping all proteins within our dataset linked to TGF-β1 (Figure 9A). The expression pattern of these proteins was consistent with activation of TGF-β1, and we then confirmed TGF-β1 upregulation in the rTg-D rats via ELISA (Figure 9B). Due to its various reported functions, TGF-β1 has a complicated relationship with blood-brain barrier (BBB) integrity, both reported to induce endothelial to mesenchymal transition that can lead to BBB dysfunction, but also can promote tight barrier phenotypes in brain endothelial cells and reduce BBB permeability.59,60 Additionally, TGF-β1 has been associated with BBB dysfunction and leakage in long COVID-associated cognitive impairment. 68 Therefore, while increases in TGF-β1 gene and protein expression in CAA are established, whether this is a contributory or compensatory mechanism in CAA pathologic progression and loss of BBB integrity requires further investigation.
Interestingly, the known TGF-β1 regulator, serine proteinase HTRA1,69 -73 also displayed increased protein levels in the rTg-D rat brains (Figure 8A) confirmed by immunolabeling (Figure 8B). The regulatory relationship between HTRA1 and TGF-β1 is complex and HTRA1 is proposed to attenuate TGF-β1 signaling through various mechanisms. HTRA1 has been reported to regulate TGF-β1 protein expression via cleavage of its precursor pro-TGF-β1, leading to reduced levels of mature TGF-β1. 69 Additionally, increases in HTRA1 expression lead to increased cleavage products and reduced signaling of TGF-β1, while inhibition of HTRA1 proteolytic activity restores TGF-β1 function. 71 On the other hand, HTRA1 cleavage of TGF-β1 receptors type II and type III has been demonstrated and proposed as a mechanism for HTRA1 mediated antagonism of TGF-β1 signaling. Loss of function mutations in the Htra1 gene causes the CSVD, CARASIL, 57 and this loss of HTRA1 function leading to failure to regulate TGF-β1 and aberrant TGF-β1 signaling has been proposed as a contributing mechanism to CARASIL progression. 69 As stated above, we have previously reported wide spread HTRA1 increases in the brains of rat capillary CAA type-1 model rTg-DI,42,43,45,46 whereas proteomic investigation of isolated vessels from human CAA patients has similarly shown increased HTRA1,55,56 together strongly implicating HTRA1 involvement in CAA. As we have shown here (Figure 8B) and previously,42,45 and others have demonstrated in human CAA cases,55,56,74 HTRA1 strongly co-localizes and accumulates with microvascular Aβ deposits. This observation has led to theory of accumulation and functional sequestration of HTRA1 with Aβ deposits, yielding increases in non-functional HTRA1 protein levels, and potentially leading to pathogenic dysregulation of TGF-β1 signaling in CAA.55,74 This has even been suggested as a common pathologic mechanism linking CAA and the CSVD cerebral autosomal dominant arteriopathy with subcortical infarcts and leukoencephalopathy (CADASIL), where misfolded Notch 3 protein aggregation in the ER along with reduced HTRA1 function and dysregulated TGF-β1 is also reported.55,74 On the other hand, induction of HTRA1 mRNA by TGF-β1 has also been reported, 75 and it is therefore possible that TGF-β1 expression and signaling is increased by an independent mechanism in CAA cases, and that resultant HTRA1 induction occurs as a compensatory mechanism. Nevertheless, the consistent reporting of increased expression of both TGF-β1 and HTRA1 in model and CAA cases, the regulatory relationship between these 2 proteins, and their implication in pathogenic impacts on the cerebral blood vessels is intriguing and provokes further investigation into their mechanistic contributions to CAA pathogenesis.
Conclusions
The data presented here establish and characterize the rTg-D rats as a useful model, that faithfully recapitulates human CAA type-2 pathologies, and displays overlap in its differential proteomic signature with proteins implicated in human CAA cases, thus providing a platform for mechanistic investigation of Dutch-type CAA type-2. Furthermore, we have provided a differential protein signature associated with CAA type-2 pathology in the rTg-D rats, that can be further explored as disease biomarkers, as well as mechanistic contributors to CAA pathogenesis. Finally, we provided additional molecular insight toward understanding CAA pathogenesis, highlighted by the observation of enhanced TGF-β1 and HTRA1, and a signature of downregulated proteins suggesting cytoskeleton and axonal disruption leading to neurodegeneration.
Supplemental Material
sj-docx-1-exn-10.1177_26331055241288172 – Supplemental material for Cerebral Proteomic Changes in the rTg-D Rat Model of Cerebral Amyloid Angiopathy Type-2 With Cortical Microhemorrhages and Cognitive Impairments
Supplemental material, sj-docx-1-exn-10.1177_26331055241288172 for Cerebral Proteomic Changes in the rTg-D Rat Model of Cerebral Amyloid Angiopathy Type-2 With Cortical Microhemorrhages and Cognitive Impairments by Joseph M Schrader, Mark Majchrzak, Feng Xu, Hedok Lee, Kevin Agostinucci, Judianne Davis, Helene Benveniste and William E Van Nostrand in Neuroscience Insights
Footnotes
Author Contributions
Conceptualization: WEVN, JMS, JD, and HB; Formal Analysis and Investigation: JMS, MM, FX, HL, KA, and JD; Project Administration and Supervision: WEVN and HB; Roles/Writing - original draft: JMS and WEVN; Writing - editing: WEVN; JMS; MM; HL, and HB.
Data Availability
Funding:
The author(s) disclosed receipt of the following financial support for the research, authorship, and/or publication of this article: This project was supported by research grant R01 NS104147 from the National Institute of Neurological Diseases and Stroke (WEVN), Foundation Leducq 23CVD03 (WEVN and HB), Cure Alzheimer’s Fund (HB), and by Institutional Development Award Number U54 GM115677 from the National Institute of General Medical Sciences, which funds Advance Clinical and Translational Research (Advance-CTR) (JMS).
Declaration of conflicting interests:
The author(s) declared no potential conflicts of interest with respect to the research, authorship, and/or publication of this article.
Supplemental Material
Supplemental material for this article is available online.
References
Supplementary Material
Please find the following supplemental material available below.
For Open Access articles published under a Creative Commons License, all supplemental material carries the same license as the article it is associated with.
For non-Open Access articles published, all supplemental material carries a non-exclusive license, and permission requests for re-use of supplemental material or any part of supplemental material shall be sent directly to the copyright owner as specified in the copyright notice associated with the article.