
Abstract
Diffuse white matter (WM) disease is highly prevalent in elderly with cerebral small vessel disease (cSVD). In humans, cSVD such as cerebral amyloid angiopathy (CAA) often coexists with Alzheimer’s disease imposing a significant impediment for characterizing their distinct effects on WM. Here we studied the burden of age-related CAA pathology on WM disease in a novel transgenic rat model of CAA type 1 (rTg-DI). A cohort of rTg-DI and wild-type rats was scanned longitudinally using MRI for characterization of morphometry, cerebral microbleeds (CMB) and WM integrity. In rTg-DI rats, a distinct pattern of WM loss was observed at 9 M and 11 M. MRI also revealed manifestation of small CMB in thalamus at 6 M, which preceded WM loss and progressively enlarged until the moribund disease stage. Histology revealed myelin loss in the corpus callosum and thalamic CMB in all rTg-DI rats, the latter of which manifested in close proximity to occluded and calcified microvessels. The quantitation of CAA load in rTg-DI rats revealed that the most extensive microvascular Aβ deposition occurred in the thalamus. For the first time using in vivo MRI, we show that CAA type 1 pathology alone is associated with a distinct pattern of WM loss.
Introduction
Compelling clinical evidence implicates a major role of cerebral small vessel disease (cSVD) in vascular cognitive impairment and dementia (VCID). 1 cSVD are disorders caused by pathologies of the small blood vessels in the brain.2–5 cSVD contributes to and worsens Alzheimer’s disease (AD) symptoms 6 and triples the risk of stroke.7,8 The underlying pathogenesis of cSVD is still poorly understood and no effective preventive or curative treatments currently exist. 9 cSVDs are diagnosed by distinct pathologies detected by magnetic resonance imaging (MRI) including white matter (WM) hyperintensities, diffuse WM loss, enlarged perivascular spaces (ePVS), lacunar infarcts, cerebral microbleeds (CMB), microinfarcts and global brain atrophy.5,10–13
Several different subtypes of cSVD that often overlap in human brain are observed based on the cerebral vessel bed impacted. 14 The most common cSVD subtypes are arteriolosclerosis, cerebral small vascular atherosclerosis and cerebral amyloid angiopathies.4,15–17 Sporadic cerebral amyloid angiopathy (CAA) is the second most common cSVD subtype in the elderly and is characterized by the presence of fibrillar amyloid-beta protein (Aβ) deposits in the vessel walls of meninges, cerebral arteries, arterioles and capillaries. The age-related prevalence rates of CAA are >50% over 80 years.15,18,19 CAA manifests as two distinct pathologies designated as CAA type 1 and CAA type 2. 20 CAA type 1 is characterized by the Aβ deposition in the capillaries causing dyshoric angiopathy and a strong neuroinflammatory response.21–23 In contrast, CAA type 2 is characterized by Aβ deposition within the vessel walls of cortical and meningeal arteries and arterioles. 24 The extensive and chronic vascular Aβ deposition in late-stage CAA is associated with CMB, larger lobar hemorrhages or focal ischemic insults.23,25–27
Presently, the Boston criteria provides a ‘probable’ diagnosis of CAA based on the demonstration of multiple hemorrhages restricted to lobar, cortical or cortical-subcortical regions by imaging.28–30 Although the two different CAA subtypes are well-recognized in post-mortem human brain, 20 their contribution to diffuse WM disease is unknown because they commonly co-exist with AD and cannot be studied in isolation.31–36 Thus, despite the high prevalence of WM disease in cSVD and its significance for VCID, there is a gap in knowledge regarding its progression over time and how it relates to burden of CAA pathology including CMB.
Transgenic mouse cSVD models that develop CAA type 1 or CAA type 2 without other overlapping cSVD pathologies (e.g. hypertensive vasculopathies or AD)24,37–40 have provided valuable insights into understanding how cerebral vascular amyloid, CMB and other pathophysiology relate to cognitive dysfunction as the disease progresses. However, thus far, diffuse WM disease has not been reported in CAA mouse models which bring into question their relevance for human cSVD. Recently, we introduced a novel CAA transgenic rat model that expresses chimeric Dutch/Iowa familial CAA mutant Aβ in brain (rTg-DI) and develops age-dependent deposition of capillary Aβ, perivascular neuroinflammation, CMB and behavioral deficits. 40 The new rTg-DI rat model now allows further investigation into how the evolving CAA type 1 pathology impacts WM in the live brain by MRI. In this study, the evolution of CMB and brain morphometry was characterized longitudinally in a cohort of rTg-DI rats from early stage disease at three month (M) of age until rTg-DI became moribund (∼11 M). The in vivo MRI findings were validated by in vitro 3D diffusion tensor imaging (DTI) as well as histological measures of WM loss, CAA load and CMB. The ultimate goal of these experiments is to inform on the burden of age-related CAA type 1 pathology in relation to WM disease and ultimately to future efforts addressing VCID in CAA.
Material and methods
Animal, strains and genotyping
All animal experiments were approved by the Institutional Animal Care and Use Committees at Yale University and University of Rhode Island and conducted in accordance with the United States Public Health Service’s Policy on Humane Care and Use of Laboratory Animals and the experiments have been reported in compliance with the ARRIVE guidelines. The rTg-DI CAA type 1 rat line expresses human Swedish/Dutch/Iowa vasculotropic mutant amyloid-beta precursor protein (AβPP) under control of the neuronal Thy1.2 promoter and produces chimeric Dutch/Iowa CAA mutant Aβ peptides in brain. 40 Heterozygous transgenic offspring of rTg-DI rats was used, and all transgenic rats were confirmed for the human AβPP transgene by genotyping. In vivo MRI experiments were conducted longitudinally on the same cohorts of WT and rTg-DI female rats at 3 M, 6 M, 9 M, and until they were severely impacted by CAA type 1 disease and became moribund (as evidenced by rapid >10–20% weight loss which occurred ∼11 M of age in rTg-DI rats). In addition, we also included separate groups of female and male rTg-DI and WT rats ranging from 3 to 11 M for in vitro WM characterization by DTI. All MRI acquisitions were performed on a Bruker 9.4 T/16 cm bore MRI instrument with a BGA-9S-HP imaging gradient interfaced to a Bruker Avance III console and controlled by Paravision 6.1 software (Bruker BioSpin, Billerica, MA, USA). A volume RF transmit and receive head only coil with an inner diameter of 4.0 cm was utilized for both in vivo and in vitro MRI scans. During the scans, anesthesia was maintained with dexmedetomidine (0.015–0.020 mg/kg/h via a subcutaneous catheter) supplemented with 0.5–0.8% isoflurane delivered in a 1:1 Air:O2 mixture. 41 The stability of anesthetic plane was assessed by means of continuous measurement of heat rate and blood oxygen saturation (SpO2) during the scanning. SpO2 was kept in the range of 97–100% during scanning. Body temperature was kept in the range of 36–37°C using a heated waterbed.
In vivo MRI sequences
For morphometric scans, a proton-density weighted (PDW) 3D spoiled gradient echo sequence was used with the following parameters: Repetition time (TR) = 50 ms; echo time (TE) = 4 ms; flip angle = 7°; number of signal averages (NA) = 4, total scan time = 27 min. A saturation pulse was applied ventral to the lower jaw to prevent image aliasing artifact within the field of view (30 mm × 30 mm × 15 mm) allowing for an isotropic spatial resolution of 0.23 mm × 0.23 mm × 0.23 mm. Following the PDW scan, a 3D multiple gradient echo (MGE) sequence (T2*-weighted) was acquired for CMB detection with the same spatial resolution (0.23 mm × 0.23 mm × 0.23 mm) and orientation as the PDW image the using following parameters: TR = 60 ms; TE = 2 ms, 12 ms, 22 ms, 32 ms; flip angle = 15°; NA = 6 yielding a total scanning time of 49 min.
In vitro DTI imaging
The signal intensity on PDW images varies across the brain, which facilitates the anatomical segmentation into three tissue compartments: GM, WM and cerebrospinal fluid (CSF). In the setting of pathological changes (e.g. CMB or tissue degeneration), erroneous tissue segmentation based on anatomical image contrast could in principle occur. Therefore, to further validate the morphometry-based assessment of WM changes, we also implemented DTI imaging in separate series of rats. Accordingly, in vitro MRI scans were performed on an additional series of WT and rTg-DI rats at 3 M, 6 M, 8 M, and 11 M using the active gadolinium staining technique.42,43 Following an overdose of ketamine (∼130 mg/kg), rats underwent transcardial perfusion fixation with a mixture of phosphate buffer 4% paraformaldehyde solution (SF-100 Fischer Scientific) containing 5% (50 mM) Gadoteric acid (Gd-DOTA Guerbet LLC, Princeton, NJ, USA) delivered by a servo-controlled peristaltic pump (Masterflex Peristaltic Tubing Pumps, Cole-Parmer, Vernon Hills, IL, USA). Prior to imaging, the specimens were allowed to reach a room temperature (19–21°C) before being placed in a custom-made MRI-compatible holder containing proton signal-free susceptibility-matched fluid (Galden Heat Transfer Fluids, HT230. Kurt J. Lesker, Company, USA). A 3D pulsed gradient spin-echo DTI imaging protocol was implemented using the following parameters: TR = 350 ms; TE = 20 ms; NA = 1; diffusion time = 4 ms; gradient duration = 10 ms; isotropic voxel resolution of 156 µm × 156 µm × 156 µm. One non-diffusion-weighted image (b = 20 s/mm2) image and six diffusion-weighted images (b = 2500 s/mm2) were acquired along six non-collinear diffusion gradient vectors: [1, 1, 0], [1, 0, 1], [0, 1, 1], [−1, 1, 0], [1, 0, −1], and [0, −1, 1] requiring a total acquisition time of 11 h 9 min per specimen.
In vivo MR imaging analyses
Analyses of in vivo MRI data included characterizing morphometric and T2* differences between rTg-DI and WT rats at the four time points (3 M, 6 M, 9 M and 11 M).
PDW image analysis
The PDW images were used for voxel-based morphometry (VBM) to characterize the age-dependent morphometric voxel-wise differences between rTg-DI and WT groups. For this purpose, image registration and subsequent voxel-wise statistical analyses were performed using SPM12 (http://www.fil.ion.ucl.ac.uk/spm) as previously described44–46 using custom-made GM, WM and CSF tissue probability maps (TPMs) (Supplementary Figure 1).44,47,48 Spatial registration parameters between TPMs and individual scans were calculated using the DARTEL algorithm and subsequently smoothed by a 0.6 mm Gaussian smoothing kernel. Voxel-wise statistical analysis was performed by a two-sample t-test with total intracranial volume (TIV) as a covariate and statistical significance was reported at p-value < 0.05 after correcting for multiple comparisons by false discovery rate (FDR).
T2* image analysis
A relationship between a MGE signal as a function of echo time is complex and studies have reported non-mono exponential decay, 49 which require data collection over many TEs. In this study, we instead implemented the commonly performed mono-exponential decay as the first approximation. Thus, the 3D T2* maps were calculated from the MGE data by assuming mono-exponential signal decay between the detected signals and the echo times. The signals were log transformed and fitted as a function of the echo times using a linear least square fit algorithm. To spatially register the T2* maps onto the anatomical PDW templates, the spatial transformation parameters estimated for the VBM analysis were used. Following this processing step, the T2* map was smoothed with an isotropic Gaussian kernel of 0.6 mm. A two-sample t-test was performed and voxel-wise differences for T2* were considered statistically significant at p-value < 0.05 after correcting for multiple comparison by FDR. For both VBM and T2* map images, the voxel-wise analyses were executed separately, at each scan point (3 M, 6 M, 9 M and 11 M). The T2* maps were also used for estimating the trajectory of CMB ‘load’ and volume changes in the thalamus over time in rTg-DI rats compared to WT rats. For this purpose, a thalamic ROI was overlaid onto the T2* maps and the mean T2* value was extracted for each rat at each scan time point. T2* values ≤20 ms within the thalamus were identified on the parametric T2* maps in each rat using the Amira software segmentation editor (Amira 6.4, ThermoFisher Scientific). The setting of the T2* threshold of ≤20 ms to quantify the thalamic CMB was determined based on two experienced imagers’ (HB and HL) assessment of ‘best match’ with the well-defined low intensity regions observed bilaterally in the thalamus. The number of voxels with T2* ≤ 20 ms was converted into mm3 and used as an estimate of ‘total hemorrhagic load’ in the thalamus.
DTI image analysis
In vitro DTI image analyses were performed at both mesoscopic (whole brain, anatomical regions of interest) and microscopic (voxel-wise) scales. First, voxel-wise tensor maps were calculated using the diffusion software toolbox (http://www. fmrib.ox.ac.uk/fsl/). 50 Second, 3D voxel-wise tensor maps were spatially normalized by using the DTI-TK diffeomorphic deformable image registration algorithm (https://www.nitrc.org/projects/dtitk).51,52 Finally, fractional anisotropy (FA) was calculated in the spatially normalized space for each subject.
Voxel-wise statistical analyses were performed after smoothing the spatially normalized DTI indices by a 0.4 mm Gaussian smoothing kernel. A two-sample t-test was performed for animals in each age group using SPM12. A voxel was considered statistically significant at p-value < 0.05 after correcting for multiple comparisons by FDR. Characterization of anatomically defined regions of interest (ROI) was performed using deterministic streamline fiber tractography. 53 Connectivity of WM tracts within corpus callosum (CC), anterior commissure (AC), and the projection fibers from CC to frontal cortex (FC) was manually delineated. ROIs were delineated by using whole-brain population-averaged fiber tracts (Supplementary Figure 2). In addition, an image plane orthogonal to the long axis of the structure was created in evaluating the 2D slice profile of FA.
Immunohistochemical analyses
All rats in the longitudinal MRI scan series underwent histological analysis for the detection of fibrillar amyloid, neuroinflammation and CMB. Immunohistochemistry and histology were performed as previously described and detailed in the supplemental method.40,54–56
Statistical analysis
The data are presented as mean estimates or differences of means for the tissue compartment outcomes with standard deviations (SD) for univariate summaries or standard errors (SE) otherwise. Designed experiments that yielded one measurement per rat were analyzed using linear regression analysis. For experiments with repeated measurements on each animal, we used a generalized estimating equations (GEE) to account for repeated measures correlations. All hypotheses were tested using Wald test statistics. Pairwise comparisons between the two strains at each age were investigated. The p-values were not adjusted for multiple comparisons. All hypothesis tests and 95% confidence intervals (CI) are two-sided. Analyses were performed using the Stata (version 16.1) statistical package. Additional statistical analysis was carried out using XLSTAT statistical and data analysis solution. (Boston, USA. https://www.xlstat.com). Cohen’s d was also calculated in the voxel-wise analyses as a measure of effect size.57,58
Results
In all anesthetized rats, oxygen saturation (SpO2) and heart rate were measured continuously during the ∼1-h MRI scan and these data for each of the four scan sessions are presented in the Supplementary Figure 3. Statistical analysis on the influence of age and strain on SpO2 rate at the beginning (5-min) and end of the scans (55-min) revealed no differences across strains for either time point. For heart rate measures at the end of the scan, differences were significant for the variables age (p-value < 0.0001) and strain (p-value < 0.004) indicating that rTg-DI rats were hemodynamically more sensitive to the effect of anesthesia.
CAA type 1 pathology accelerates age-dependent white matter loss
Volumes for GM, WM and CSF tissue compartments of rTg-DI and WT rats at 3 M, 6 M, 9 M and 11 M age points are summarized in Supplementary Table 1. For TIV, there was no significant difference between WT and rTg-DI rats as noted in the p-values for the tests of pairwise differences. For the GM compartment, the statistical analysis revealed no volumetric differences between strains at any age. However, an overall ∼10% GM volume loss was documented from 3 M to 11 M in both strains (p-value < 0.001, Supplementary Table 1 and Figure 1). The temporal profiles of WM volume from rTg-DI and WT rats differed across the four age groups (p-value < 0.001) and is also reflected in the four pairwise differences (Supplementary Table 1, p-values < 0.001). Figure 1 shows the WM volume changes as a function of age and illustrates that the rTg-DI and WT rats diverge between 6 M and 9 M, with a pairwise mean difference of −51.7 mm3 (95% CI = [−72.7, −30.7] cm3, p-value < 0.001). Note also, that the difference between the age-dependent WM volume profiles is largest at 11 M (mean difference = −74.5 mm3 (95% CI = [−95.7, −53.4] cm3, p-value < 0.001) (Supplementary Table 1).
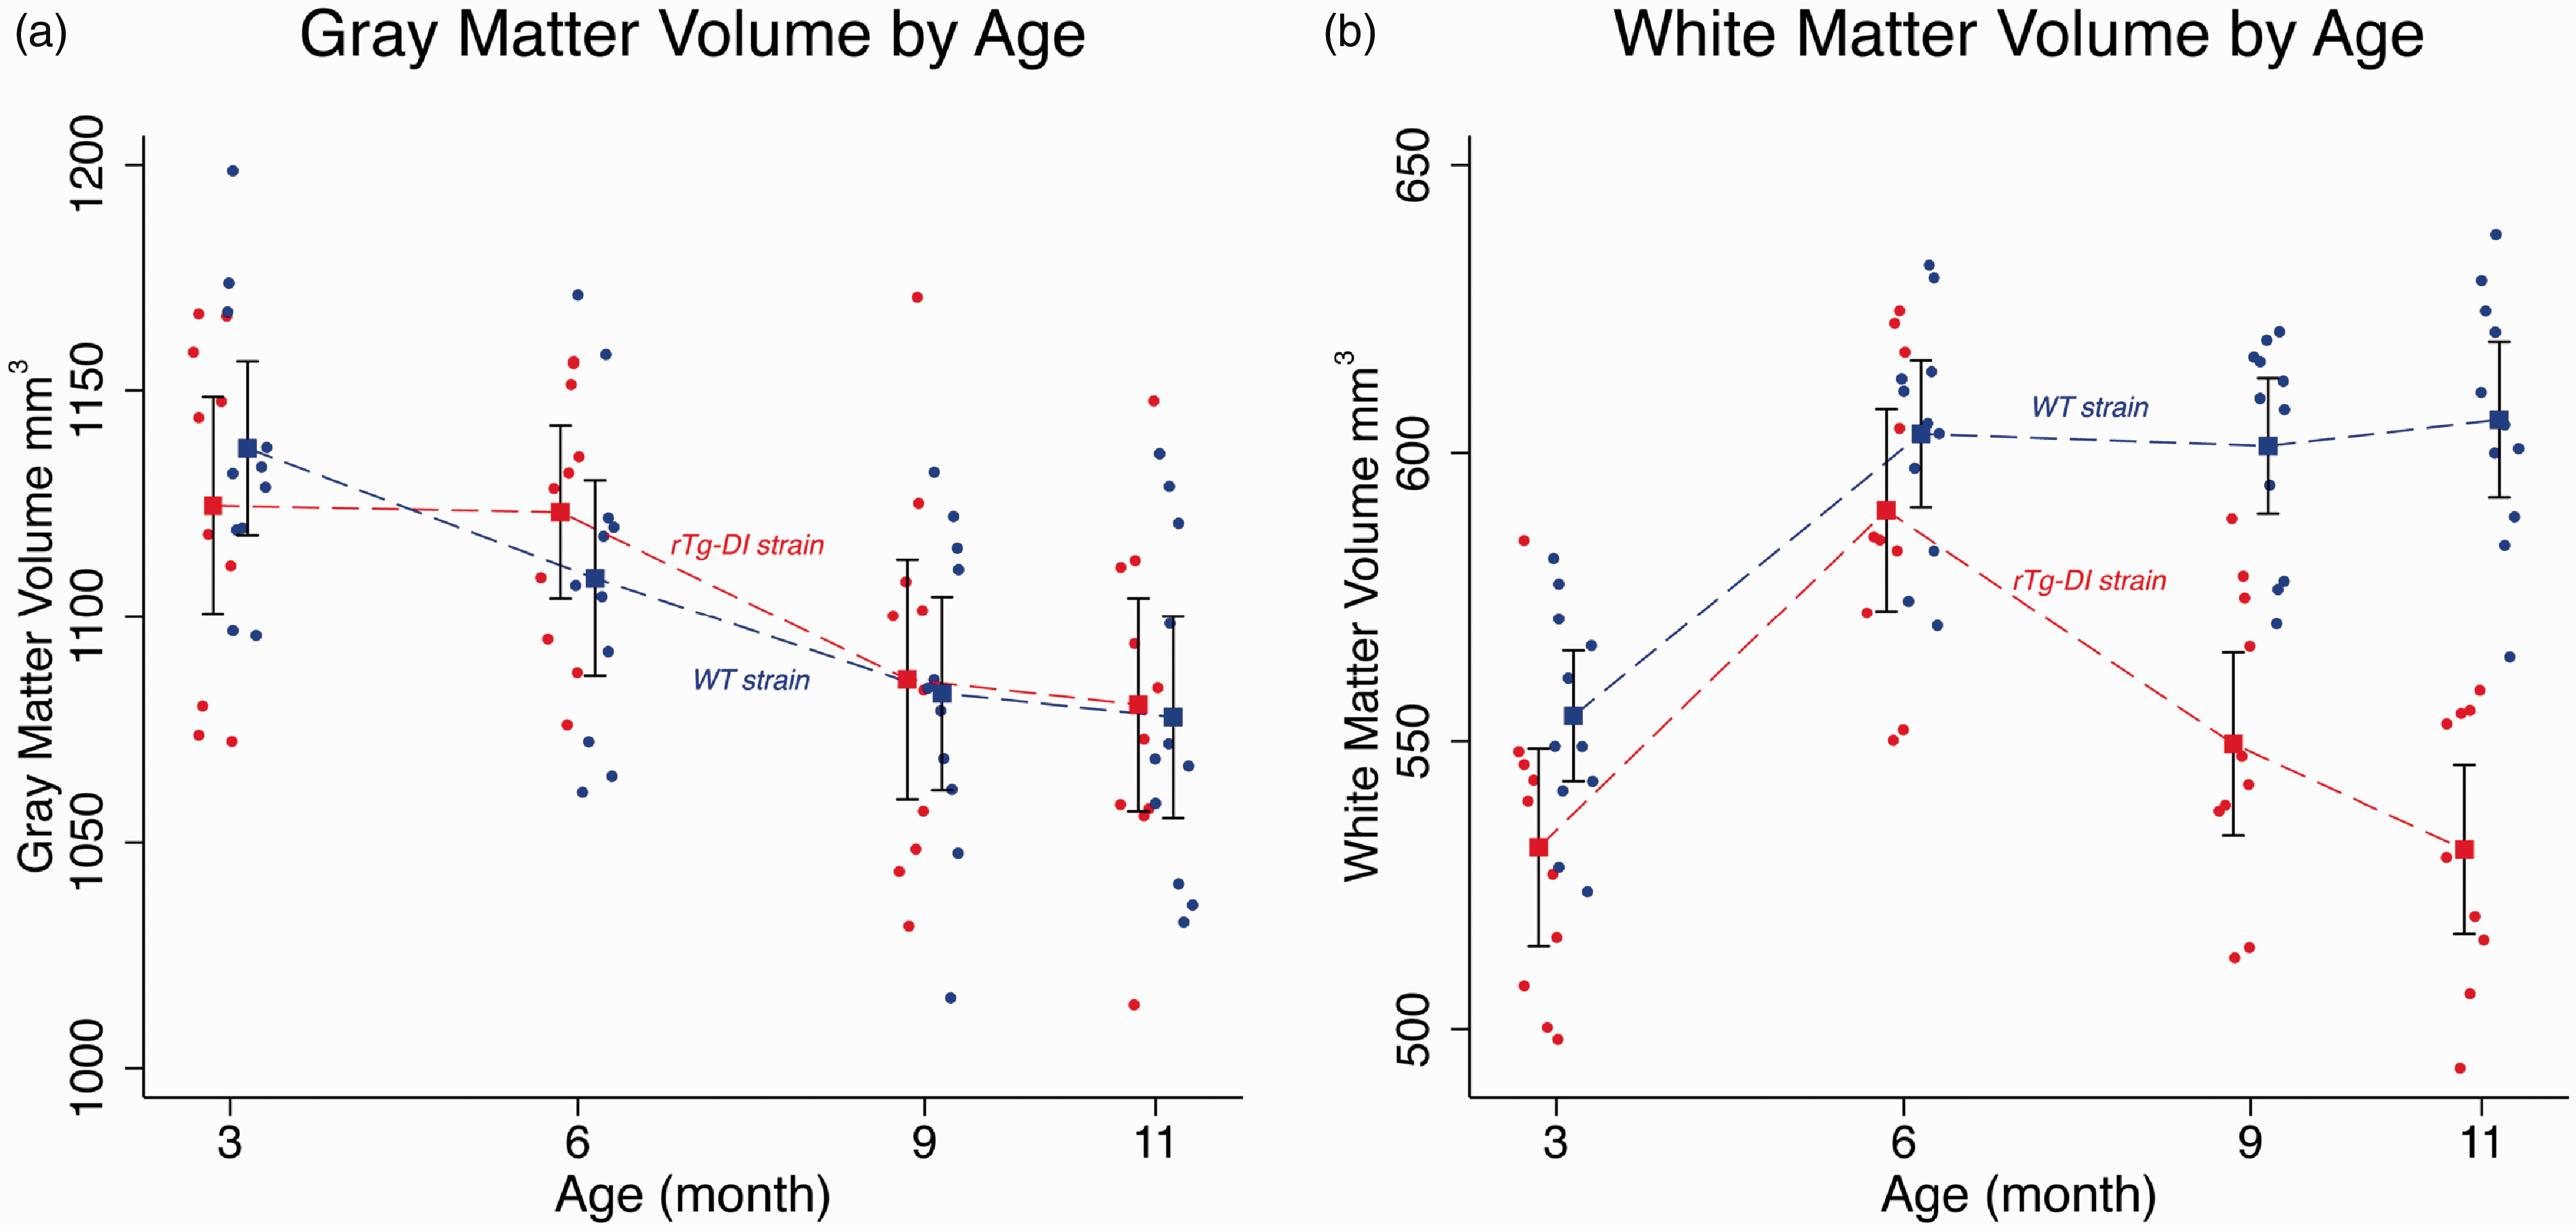
Significantly greater white matter loss observed in rTg-DI compared to WT rats. Mean and 95% confidence bands for age-dependent volumetric changes of the grey matter (GM) (a), white matter (WM) (b) for WT (blue, filled circles) and rTg-DI rats (red, filled circles) extracted from proton-weighted magnetic resonance images acquired in vivo. Observations for the WT group have been shifted slightly left of the rTg-DI group at each age to more clearly display the data. Individual filled circles represent individual rats. Model estimates are presented as means (filled squares) with 95% pairwise confidence intervals (black bands) using generalized estimating equations (GEE). Mean differences were tested for rTg-DI vs. WT groups at each age group. For the GM compartment, the results revealed no significant volumetric differences between strains tested at each age. For WM volume, the mean profiles between rTg-DI and WT rats differed statistically across the age groups (p-value < 0.001).
VBM analyses were performed at the designated ages of 3 M, 6 M, 9 M and 11 M to further characterize the spatial distribution of local morphological differences between WT and rTg-DI rats. VBM analysis revealed no GM volume differences between WT and rTg-DI rats at any age (Supplementary Figure 4). However, the VBM analysis on WM revealed striking strain differences as shown in Supplementary Figure 5. Note that in both WT and rTg-DI rats, global volumetric WM maturational growth is apparent from 3 M to 6 M in agreement with the quantitative data (Supplementary Table 1 and Figure 1). While in the WT rats, WM density appeared constant from 6 M to 11 M, rTg-DI rats exhibited extensive, diffuse WM volume loss at 9 M and 11 M (Supplementary Figure 5). To further validate the descriptive VBM analysis, statistical parametric maps (color coded for p-values) were overlaid onto a population-averaged PDW images to display areas with significant morphological differences between the two strains (Figure 2). At 3 M, only a few small clusters were observed to be smaller in rTg-DI compared to WT rats. However, at 6 M, significant WM loss was apparent in the CC, and the deep mesencephalic nuclei of rTg-DI when compared to WT control rats. Furthermore, at 9 M and 11 M, WM loss in rTg-DI rats was widespread and included the entire body of the CC, AC and internal capsule. In addition, WM loss in rTg-DI rats was also notable in the globus pallidus, thalamus, and the central tegmental tract compared to WT rats. No voxels survived the statistical significance in the direction of WM volume greater in rTg-DI compared to WT rats.
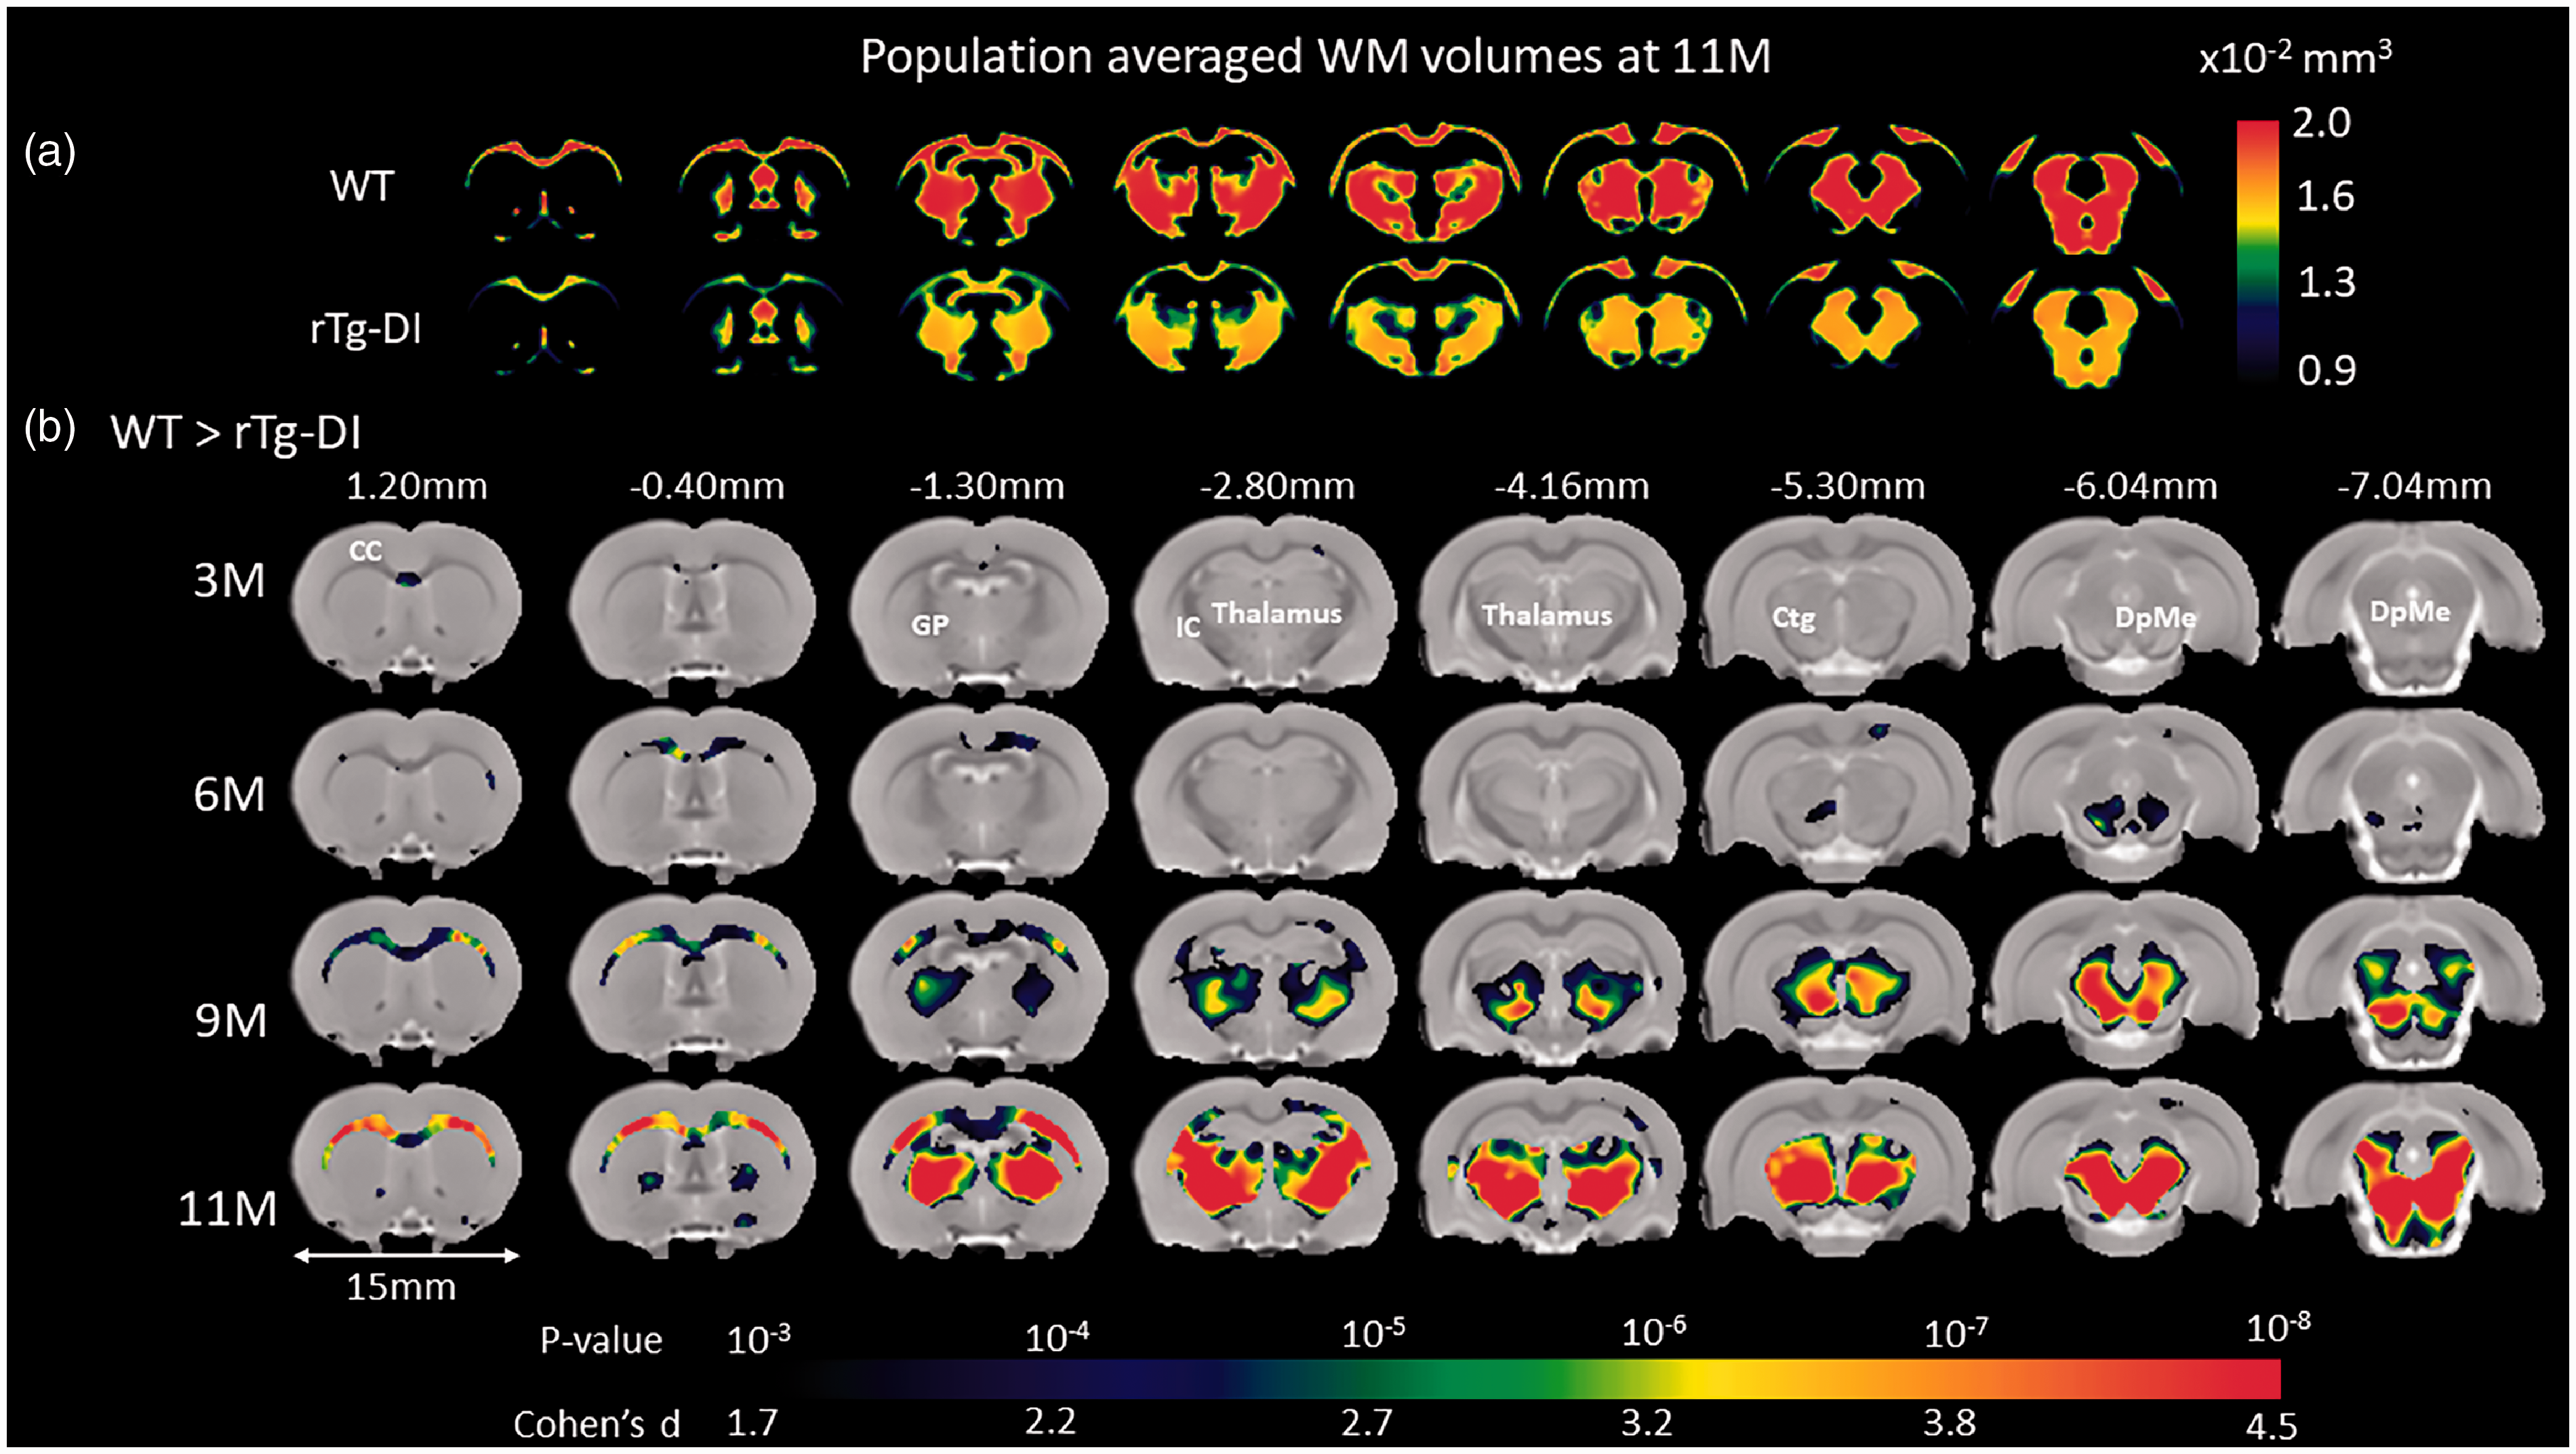
Age-dependent WM loss occurs in a specific anatomical pattern in rTg-DI rats. (a) Spatially normalized population-averaged WM volumetric maps of 11 month (M) old rTg-DI and WT rats are shown in color maps, highlighting extensive WM loss in 11 M rTg-DI rats compared to WT. (b) For each age group, statistical parametric maps (color coded for p-values) were calculated at p-value < 0.05 after FDR multiple comparison correction and overlaid onto population-averaged proton density-weighted MRI images to display anatomical areas with significant white matter (WM) loss in rTg-DI in comparison to WT rats. Cohen’s d represents the effect size. Anatomical levels of the axially displayed anatomical templates are given by their nearest Bregma distance. At 3 M and 6 M, only the corpus callosum (CC) and deep mesencephalic nuclei (DpMe) were significant for WM loss in the rTg-DI rats. However, at 9 M and 11 M, significant WM loss in rTg-DI rats was widespread and included the CC, globus pallidus (GP), internal capsule (IC), thalamus and central tegmental tract (ctg). Scale bar = 15 mm.
In vitro DTI analysis and histology confirm WM damage in rTg-DI CAA type 1 rats
Whole brain DTI image analyses focused on analyzing the key DTI index FA within the WM tissue compartment and FA values within the age groups for WT and rTg-DI rats are summarized in Supplementary Table 2. This analysis revealed that the mean FA was found to be significantly different at 9 M and 11 M of rTg-DI compared to age-matched WT. The voxel-wise FA analysis was performed at the four age groups separately, minor areas of significant differences between the two groups were observed at 9 M (results not shown). At 11 M, widespread areas with significant group differences were found as shown in Figure 3. Largely consistent with the pattern of WM loss observed in vivo as shown in Figure 2, the rTg-DI rats displayed significantly reduced FA values (indicating impaired WM integrity) in several WM structures including CC, AC, fornix, internal capsule, reticular thalamic nuclei and deep mesencephalon. We also observed small focal areas with higher FA values in rTg-DI compared to WT rats (Figure 3). These focal FA increases in rTg-DI rats occurred near the ventral posteromedial thalamic nuclei (VPM) and gustatory thalamic nuclei suggesting enhanced anisotropy in these specific areas.
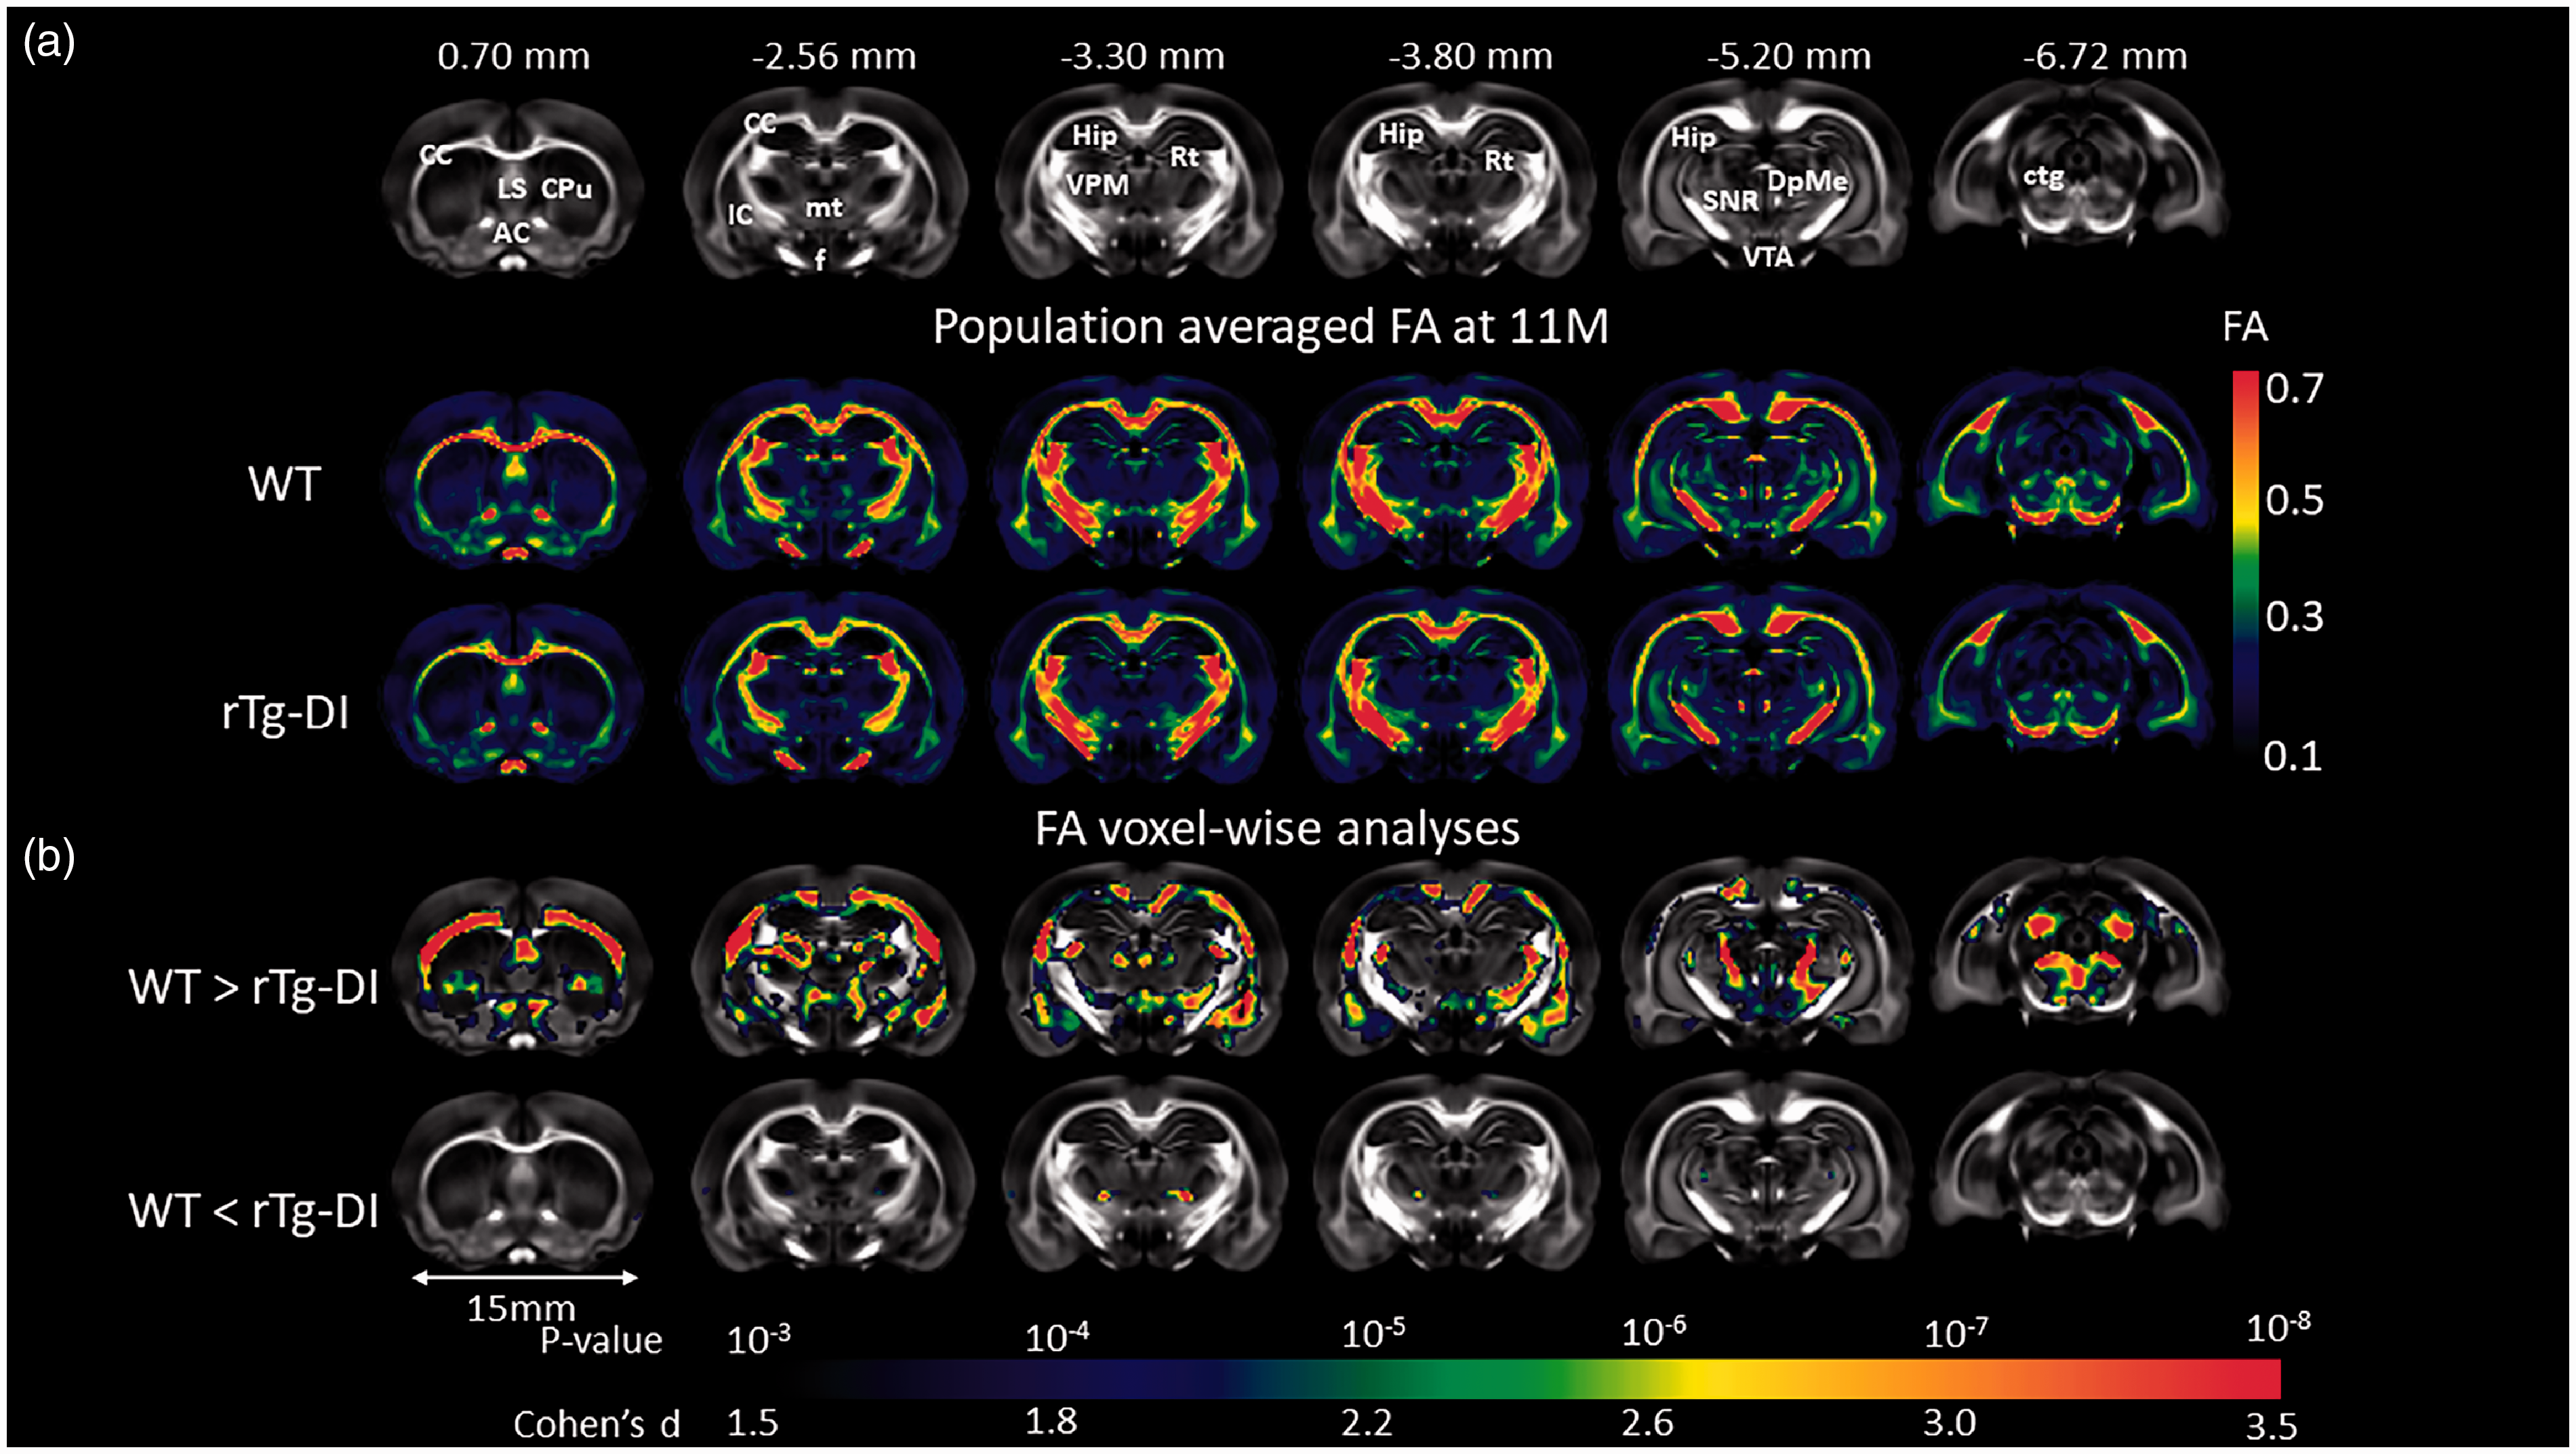
WM loss in rTg-DI rats with late stage disease validated by in vitro DTI. (a) Anatomical templates based on FA contrast are shown to highlight landmarks. Anatomical landmarks of the templates are indicated by their nearest Bregma distance. Anatomical structures of relevance are as follows: CC: corpus callosum; LS: lateral septum; AC: anterior commissure; Cpu: caudate putamen; IC: internal capsule; f: fornix; mt: mammillothalamic tract; VPM: ventral posteromedial thalamic nuclei; Rt: reticular thalamic nuclei; DpMe: deep mesencephalic nuclei; SNR: substantia nigra; VTA: ventral tegmental area; Hip: hippocampus; ctg: central tegmental area. (b) Brain areas where FA values are significantly different (color coded for p-values) in 11 M old rTg-DI rats compared to the age-matched WT rats are shown. Cohen’s d represents the effect size. Scale bar = 15 mm.
To evaluate topographical patterns of reduced FA within WM tracks including the CC, AC and the projection fibers from CC to FC between the two strains at 11 M, we extracted and plotted their respective FA values along planes orthogonal to the long axis of the ROIs (Supplementary Figure 6). In normal WT rats, the FC projection fibers exhibited a monotonically decreasing trend as the slices became closer to the cortex (Supplementary Figure 6). Similarly, in normal WT rats, FA values within the AC became lower as the slices approached the olfactory bulb. When comparing across strains, differences in FA values were noted to be slice dependent. For example, in the CC, substantial FA decreases (∼15%) in rTg-DI rats were found in the body of CC compared to WT rats, while FA values in the genu and splenium were within similar range (∼2%) for the two strains. In the AC, the anterior portion exhibited larger differences (∼10% lower in rTg-DI rats) compared to the posterior portion (∼3% lower in rTg-DI rats). In contrast, FC slice profiles were nearly identical across all slices except first several slices, which were positioned proximal to the body of CC which exhibited relatively high FA values (∼0.4). In summary, the topographical analysis of FA changes in the pre-selected WM tracks showed that in rTg-DI rats, large portions of the CC body and the AC displayed WM loss, while the genu of the CC and the FC was less effected.
Myelin staining in brain sections from a parallel group of aged WT and rTg-DI rats revealed an obvious thinning and significant ∼30% reduction (p-value < 0.05) in the volume of the CC (Figure 4(a) to (c)). Similarly, quantitative measures showed a significant >40% reduction (p-value < 0.01) in myelin basic protein (MBP) levels in the CC of these rats further supporting the reduction in WM in this region (Figure 4(d)). Together, these pathological findings are highly consistent with WM loss observed in the MR imaging (Figures 1 to 3). Supplementary Figure 7 presents immunohistochemical labeling of axons with the pan-axonal neurofilament marker SM312 to further validate the MRI and histopathology data by documenting differences in normal and pathological axons in several WM regions in 11 M WT and rTg-DI rats. Guided by the MRI results of WM damage, we focused on documenting axonal pathology in the CC (body and genu) and thalamus. At 11 M of age, obvious strain differences were noted between WT and rTg-DI rats (Supplementary Figure 7(b) to (i)). First, thinning of the CC above the dorsal hippocampus in the 11 M rTg-DI rats compared to WT was clearly discernable (Supplementary Figure 7(b) and (f)). Second, in 11 M rTg-DI rats, general axonal loss was evident throughout the body of the CC compared to 11 M WT (Supplementary Figure 7(c) and (g)). Also, in the genu of the CC, axonal density did not appear to be affected; however, general disintegration (i.e. shorter axonal segments and lack of axonal coherence) was noted in the in rTg-DI rats compared to WT rats (Supplementary Figure 7(d) and (h)). Finally, in the thalamus, axonal density was reduced, and axonal directional pattern appeared disrupted in the 11 M in rTg-DI rats when compared to WT (Supplementary Figure 7(e) and (i)).
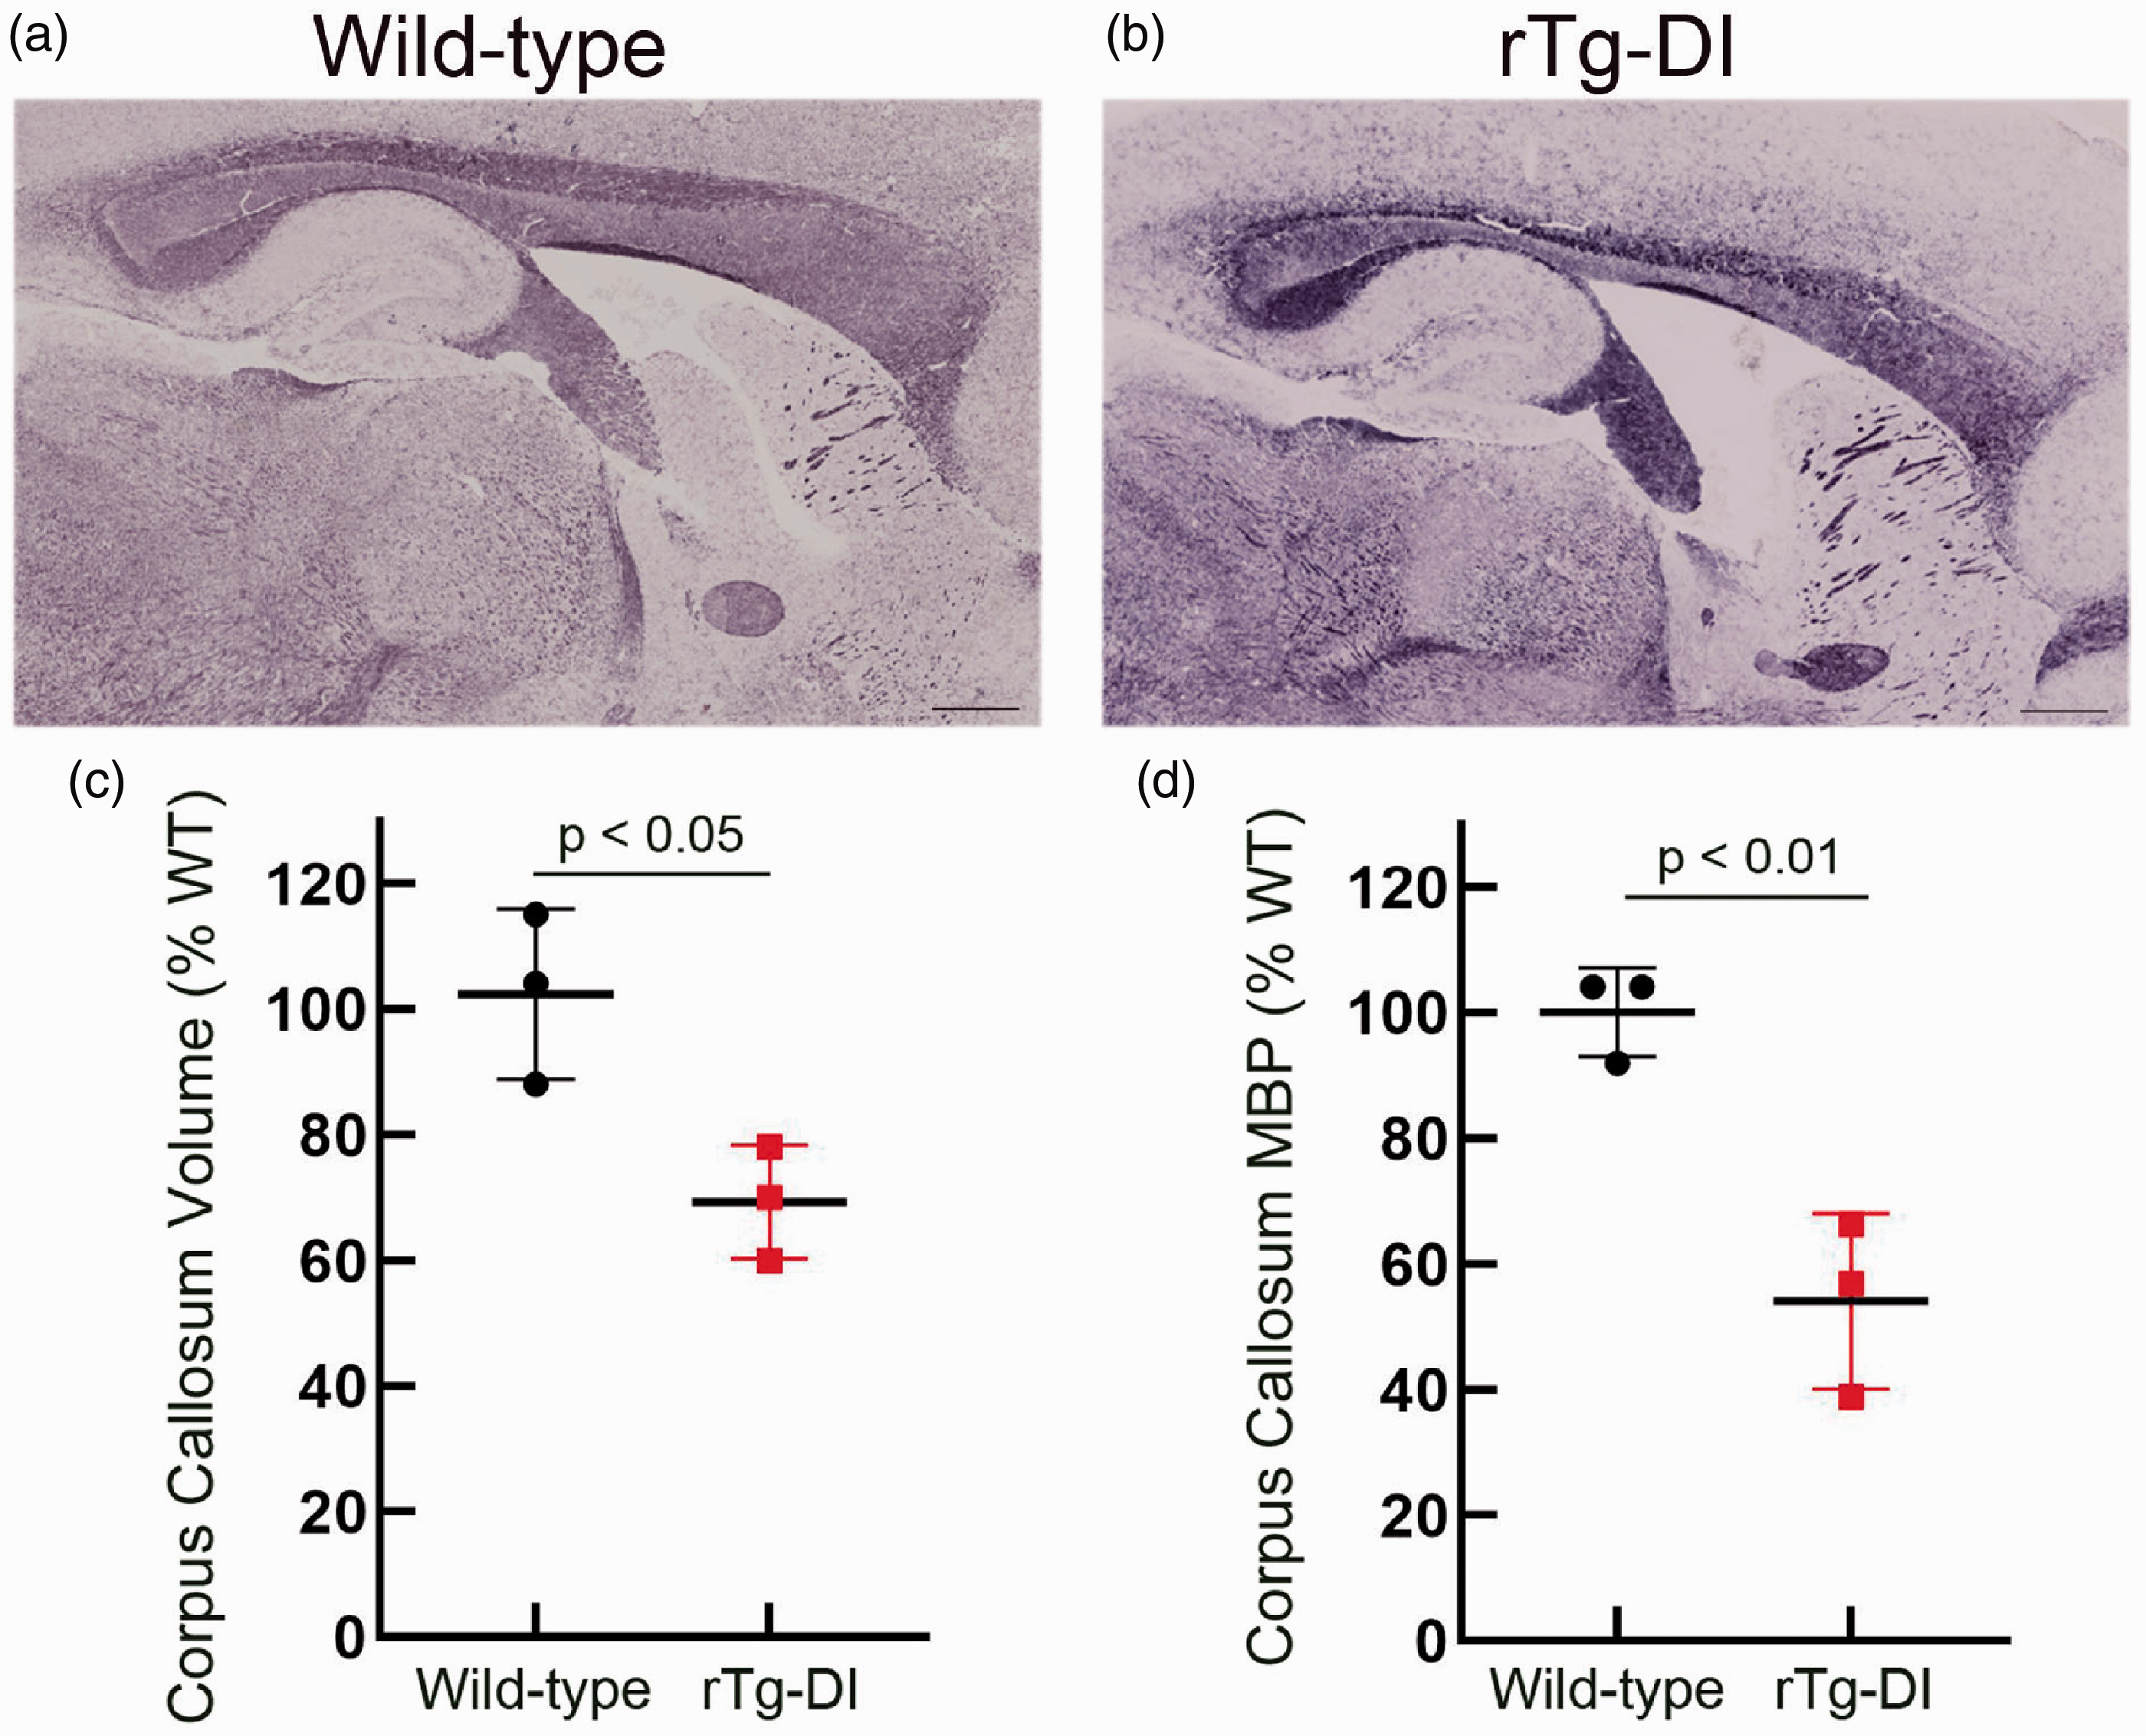
Myelin loss in the corpus callosum of rTg-DI rats. Representative sagittal sections from 11 M old WT rat (a) and rTg-DI rat (b) stained for myelin showing a reduction in the size of the corpus callosum. Scale bars = 1000 µm. (c) Stereological quantitation of the corpus callosum volume from 11 M WT (black dots) and rTg-DI (red dots) rats. Data shown are the mean ± SD of n =3 rats per group; p-value < 0.05. (d) The corpus callosum in 11 M WT and rTg-DI rats was collected by laser capture microscopy and MBP levels were determined by quantitative immunoblotting. Data shown are the mean ± SD of n = 3 rats per group; p-value < 0.01.
Thalamic and cortical T2* hypointensities emerge at 6 M in rTg-DI rats
T2* maps of the brain reflect local magnetic susceptibility and are therefore sensitive for detecting blood products and other macro- or microscopic inhomogeneities within a given tissue compartment.59–61 We used T2* maps primarily for detecting evolution of thalamic CMB in the rTg-DI rats over time. Color-coded T2* maps as shown in Figure 5(a) anatomically distinguish WM regions (e.g. CC, fimbria, internal capsule and cerebellar WM) from GM regions due to myelin’s inherently lower transverse relaxation time (WM T2* ∼25 ms, green colors). Second, when comparing T2* brain maps of WT to rTg-DI rats, the most striking abnormalities are the bilateral, symmetrical thalamic T2* hypo-intensities. Third, areas in cortex also exhibited reduced T2* differences between the two strains. Specifically, column-shaped hypointensities began to manifest at 6 M in rTg-DI rats and became progressively more prominent with aging but were mostly absent in WT rats (Supplementary Figure 8). The column-shaped T2* hypo-intensities penetrated the entire cortex and appeared to merge with CC. Voxel-wise T2* analyses were performed to identify areas with statistically significant age-dependent T2* differences between WT and rTg-DI rats. Figure 5(b) shows the statistical parametric maps at 3 M, 6 M, 9 M and 11 M of significantly reduced T2* values in rTg-DI compared to WT rats (with color-coded p-values) overlaid onto a population-averaged anatomical PDW template. At 3 M, no differences were found in T2* between the two strains. However, at 6 M, significantly reduced T2* values were observed within the ventral posterolateral (VPL) and ventral posteromedial (VPM) nuclei and these thalamic areas grew in size at 9 M and 11 M to encompass the entire thalamus. Thalamic focal hypointense lesions were apparent on T2* in 100% of the rTg-DI rats at 11 M of age. In rTg-DI but not WT rats, significant widespread T2* reductions in the cortices were also evident at 9 M and 11 M (Figure 5). Figure 6 shows the age-dependent trajectories of (1) total thalamic CMB load in rTg-DI rats from 3 M to 11 M as evaluated by T2* values (Figure 6(a)), (2) age-dependent CMB volume growth derived from calculating voxels with T2* values ≤20 ms within the thalamus (Figure 6(b)) in comparison to WT rats. In agreement with voxel-wise analysis, statistical analysis of age-dependent CMB load trajectories from the two strains based on T2* shows that their profiles (curves) are different across the age groups (p-value < 0.0001, Figure 6, Supplementary Table 3). Specifically, based on T2* data, CMB starts emerging at 6 M in rTg-DI rats (Figure 6(a)). Based on volumetric assessment, CMB emerge at 6 M and at 11 M CMB volume in rTg-DI rats averaged ∼7 mm3. Of note, the T2* threshold of ≤20 ms for quantifying CMB was set empirically based on ‘best match’ of the focal hypo-intense lesions observed bilaterally in thalamus, and very small CMB might not be captured by this approach.
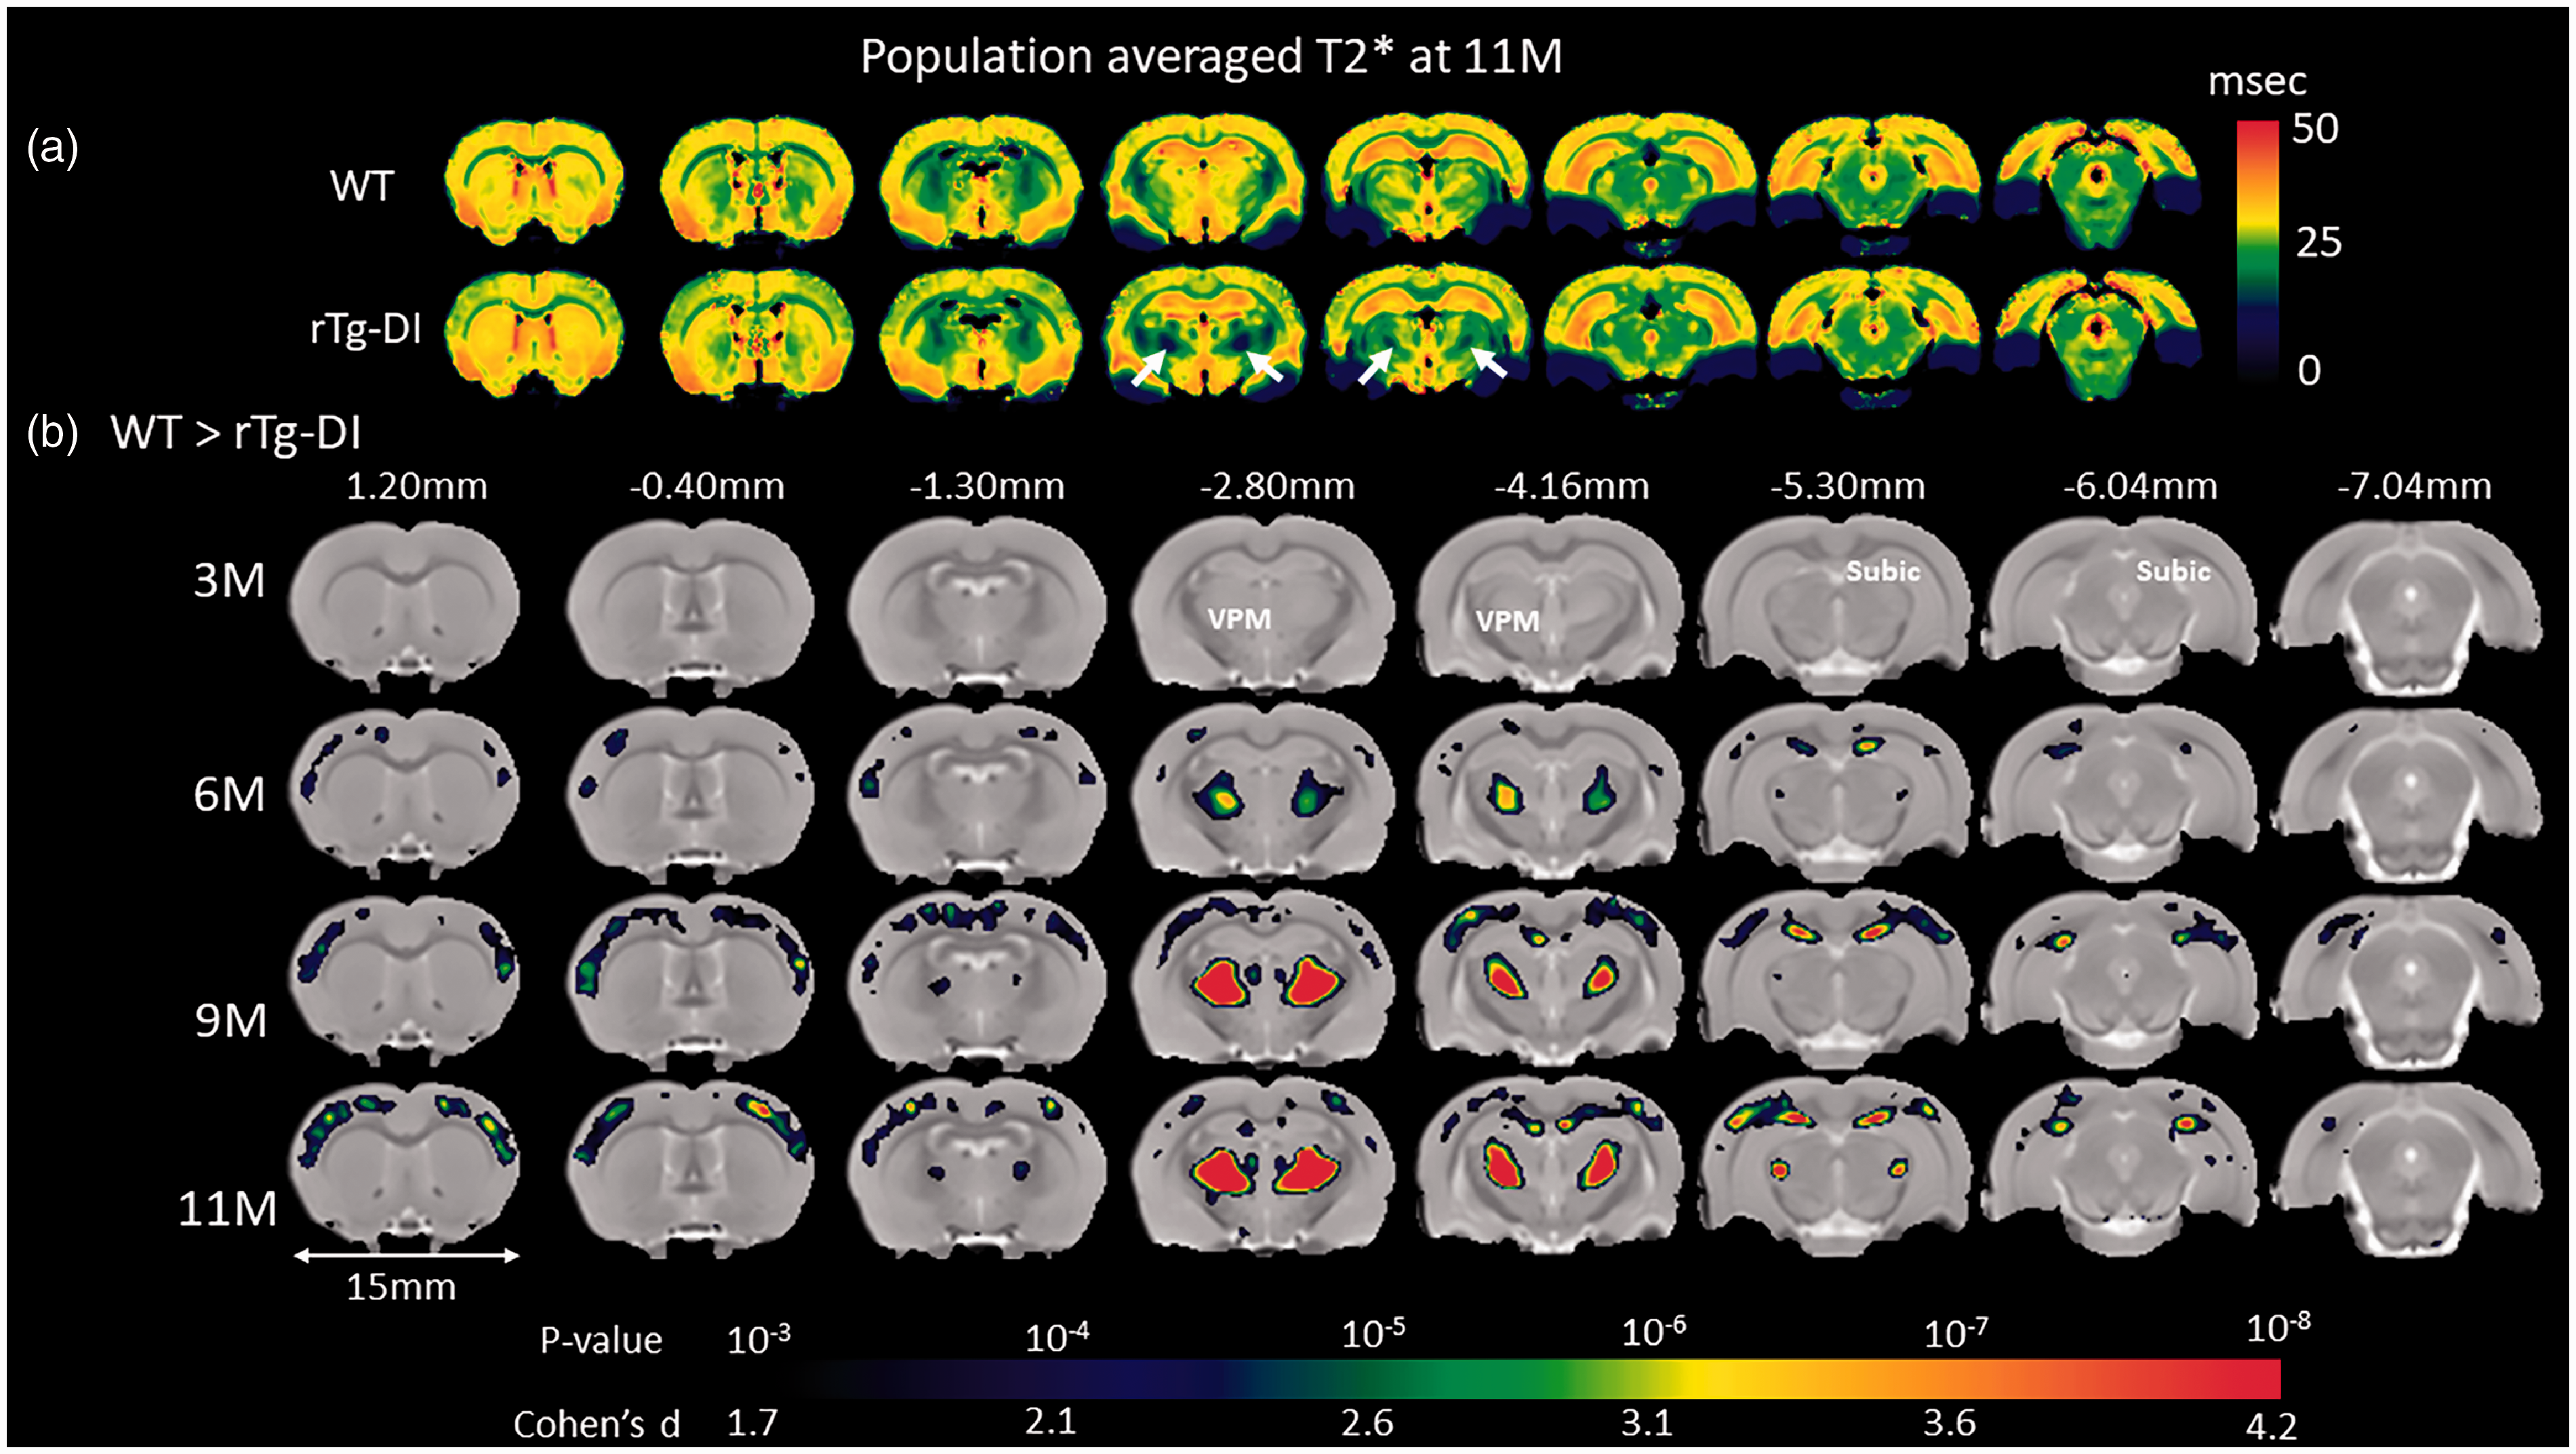
Brain areas with reduced T2* values in rTg-DI compared to WT rats. (a) Spatially normalized population averaged color-coded T2* maps of 11 M old rTg-DI and WT rats. Blue and red colors represent low and high T2* values, respectively. Significantly reduced T2* values (white arrows) in the thalamus are suggestive of blood products. (b) Voxel-wise T2* analyses were performed to quantify areas with statistically significant T2* differences between WT and rTg-DI rats at 3 M, 6 M, 9 M and 11 M of age. The statistical parametric maps of significantly reduced T2* values in rTg-DI rats compared to WT rats (with color-coded p-values) are overlaid onto a population-averaged anatomical PDW template and show changes in thalamus (ventral posteromedial nucleus (VPM)), subiculum (subic), and in the somatosensory cortices. Cohen’s d represents the effect size. Scale bar = 15 mm.
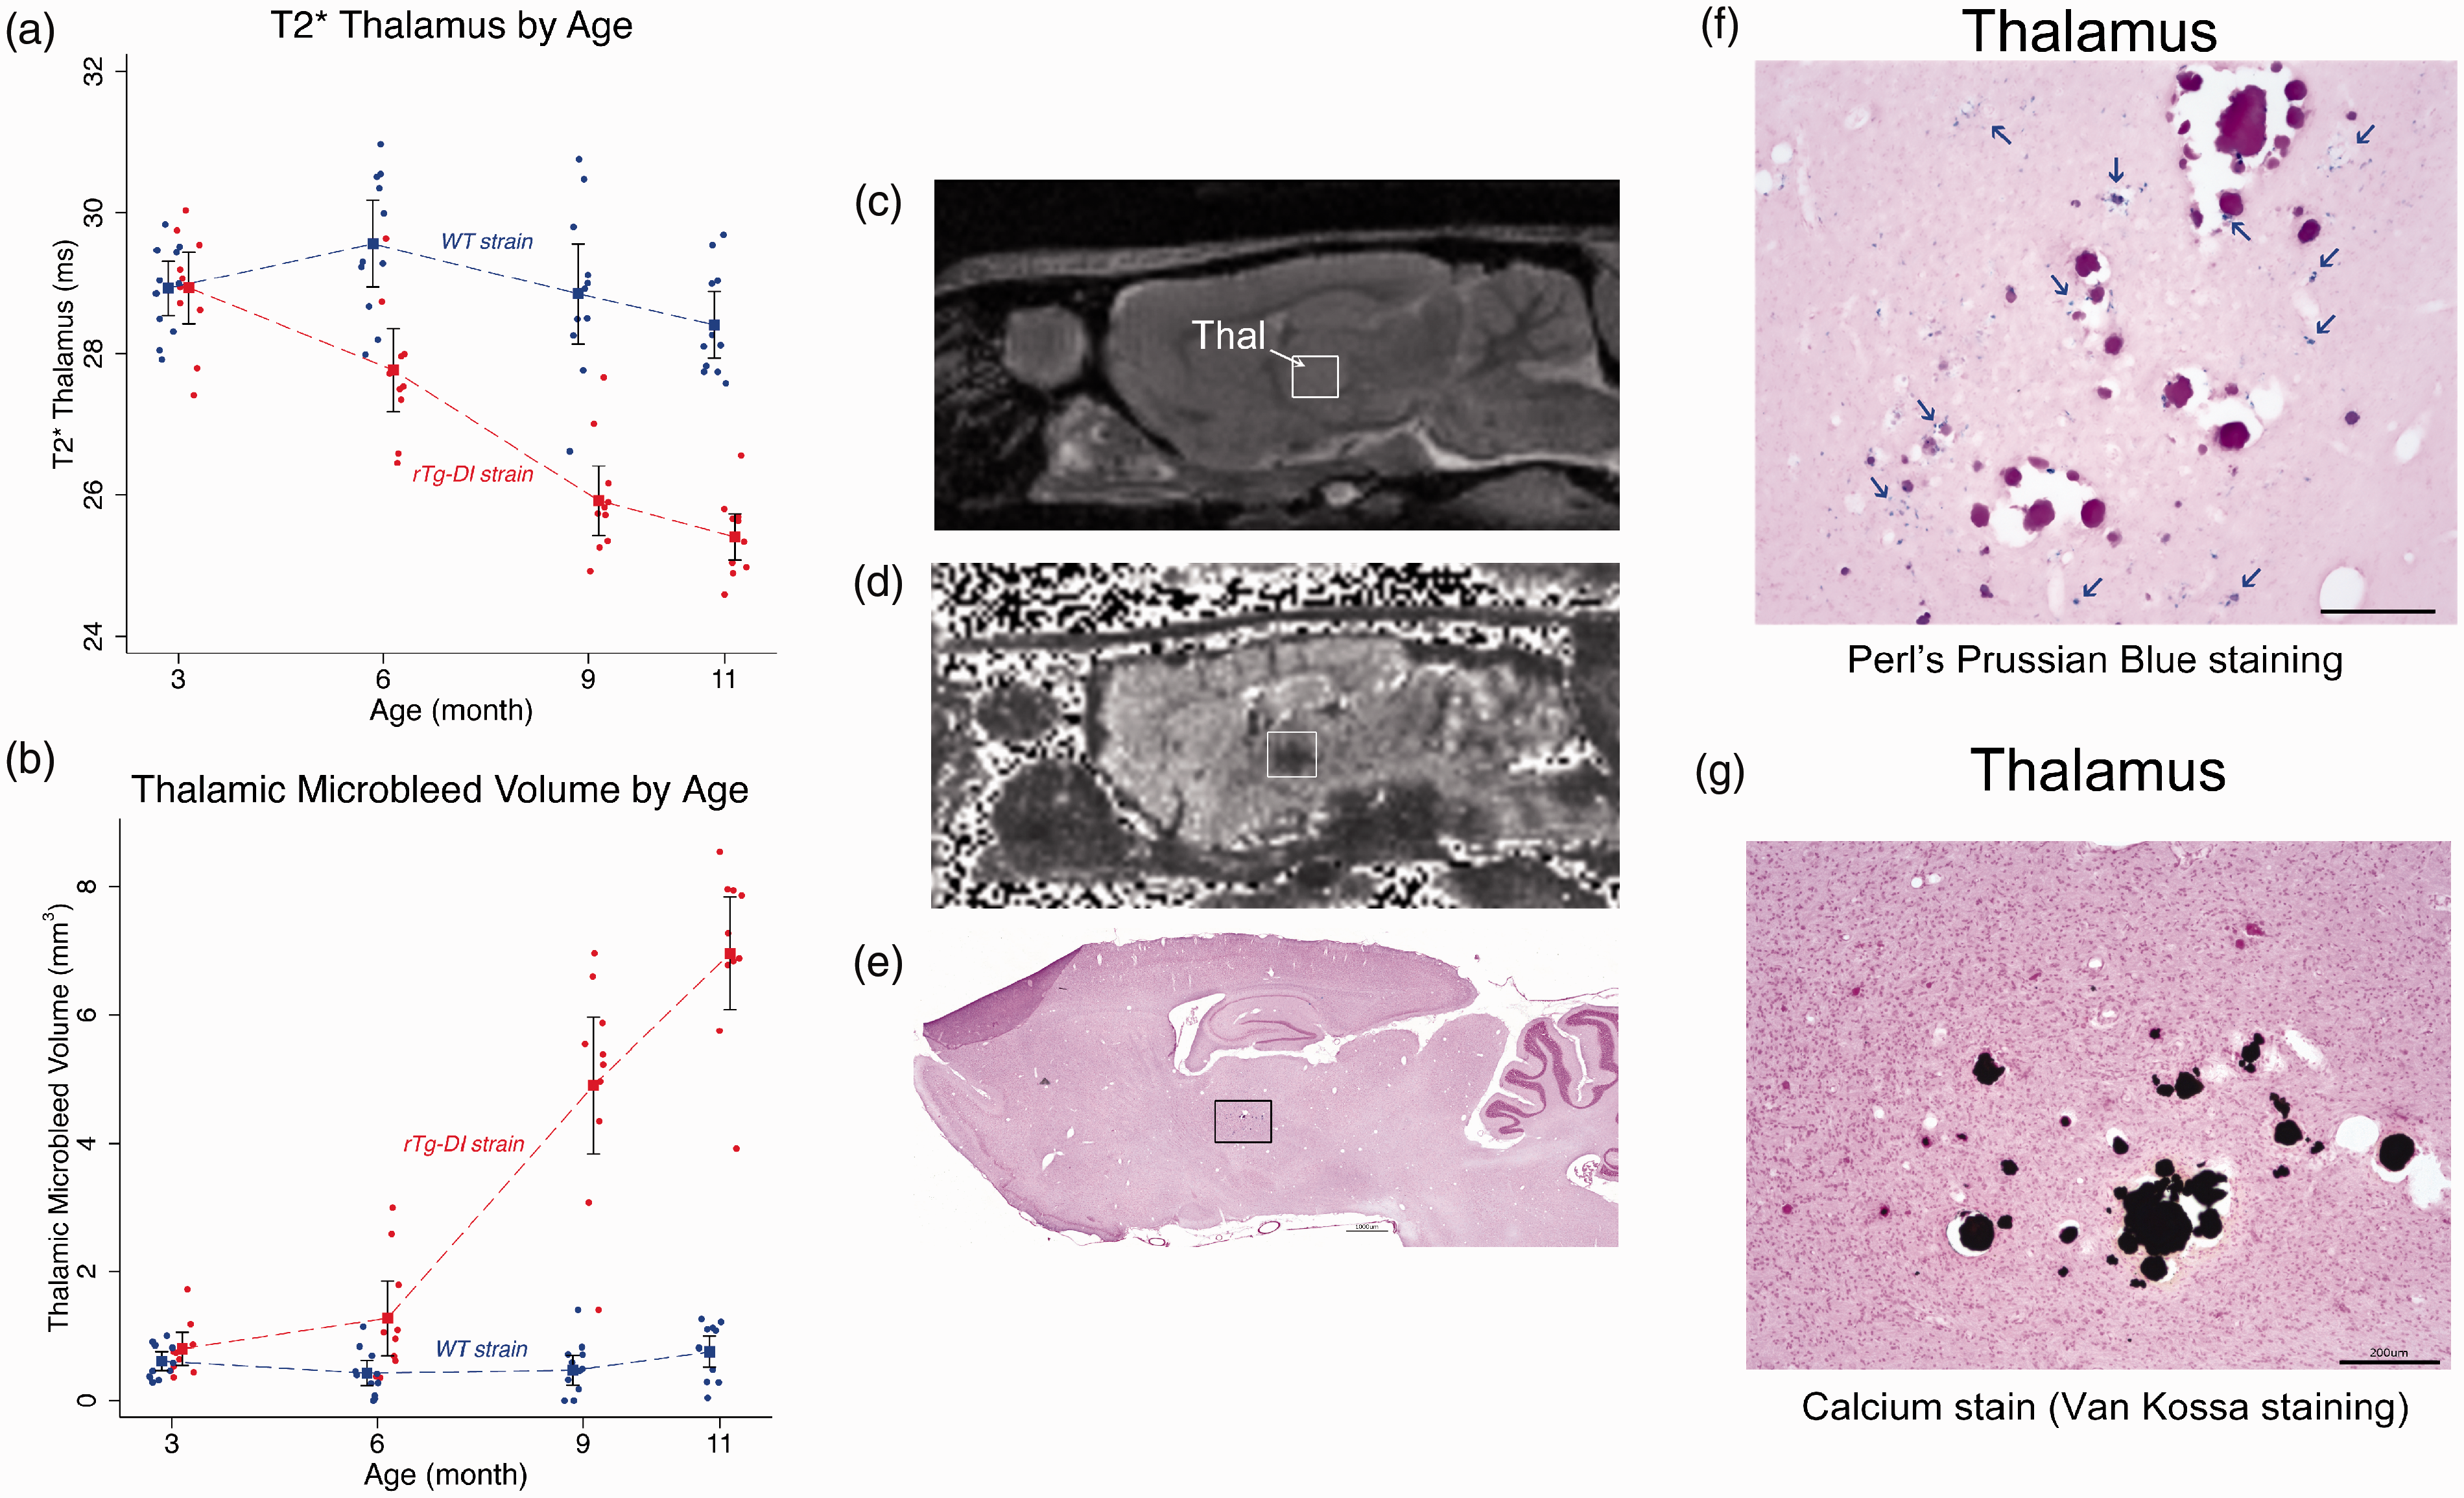
Thalamic microbleeds by T2* emerge at 6 M in rTg-DI rats. (a) Age-dependent trajectories of the total thalamic CMB load in rTg-DI rats from 3 M to 11 M as evaluated by mean T2* values. Blue and red filled circles represent WT and rTg-DI rats, respectively. Statistical analyses show that age-dependent trajectories of the two strains are statistically different with respect to the age groups (p-value < 0.0001). A distinct difference between mean T2* data is present at 6 M in rTg-DI rats: mean T2* is 1.8 ms lower than WT rats, (p-value = 0.001). (b) Age-dependent CMB volume derived based on number of voxels with T2* values ≤20 ms within the thalamus in comparison to WT rats. Blue and red filled circles represent WT and rTg-DI rats, respectively. Rapid CMB growth is apparent at 9 M and onwards in rTg-DI rats (p-values for pairwise mean differences at both 9 M and 12 M < 0.001). Model estimates are presented as means (filled squares) with 95% pairwise confidence intervals (black bands) using generalized estimating equations (GEE). (c) Anatomical proton-density-weighted MRI from an rTg-DI rat in the sagittal plane at the level of the dorsal hippocampus and thalamus. Thal: thalamus. (d) Corresponding T2* map from the same rat shown in (c). The hypointense areas in the Thal are evident. (e)Post-mortem histological stain for perivascular hemosiderin using Perl’s Prussian Blue stain. The black box depicts the magnified areas (f, g). (f) Magnified area from the thalamus showing numerous small deposits hemosiderin deposits (indicated by blue arrows), many surrounding what appear to be occluded vessels. (g) Numerous occluded and calcified microvessels were confirmed in the same thalamic area. Scale bars = 50 µm.
We also confirmed the presence of thalamic CMB in all rTg-DI rats at 11 M as defined by Prussian blue iron staining for perivascular hemosiderin deposits (Figure 6(f).) In the longitudinal cohort of rTg-DI rats, CMB were observed within the VPM/VPL thalamic nuclei bilaterally (Figure 6(c) to (g)). In all rTg-DI rats, petechial Prussian blue positive deposits were observed to be diffusely dispersed in the thalamus and in the majority of rTg-DI rats numerous occluded and calcified microvessels were also evident (Figure 6(f) and (g)). Prussian blue-positive ferritin products were not observed in the cortex (not shown) including areas associated with the column-shaped hypointense signal on the T2* maps (Supplementary Figure 8). In a subset of 11 M old rTg-DI rats, the % area fraction of hemosiderin was measured in the thalamus revealing 2.01 ± 0.70% (n = 4; SD) for hemosiderin coverage in this region, consistent with previous findings. 40
Given the clinical literature associating vascular amyloid deposition with CMB and the Boston criteria for CAA diagnosis,62,63 we also investigated amyloid deposition patterns in 11 M old rTg-DI rats in pre-selected areas (Figure 7). Perivascular capillary Aβ deposits in rTg-DI rats were abundant in cortex, hippocampus and thalamus (Figure 7(c) to (e)). Further, the microvascular Aβ deposits were strikingly dense in the thalamic region (Figure 7(e)) when compared to the cortex and hippocampus (Figure 7(c) and (d)). Further, quantification of the % area capillary amyloid coverage confirmed the high level of perivascular capillary Aβ deposits in thalamus (Figure 7(f)). Thus, the emergence of CMB in the thalamic region is likely associated with the heavy microvascular Aβ burden in this region. As expected, perivascular neuroinflammation in the form of astrogliosis and activated microglia in rTg-DI rats was also pervasive in 11 M rTg-DI rats in regions with heavy microvascular amyloid burden such as the thalamus and hippocampus in comparison to WT (Supplementary Figure 9). Astrocytes appeared to be increased in number and volume in 11 M rTg-DI rats (Supplementary Figure 9(e) to (h)) when compared to 11 M WT rats (Supplementary Figure 9(a) to (d)). In the hippocampus and thalamus of WT rats, Iba 1-positive microglia were sparse in numbers and exhibited the resting, surveillance phenotype with long extended processes (Supplementary Figure 9(k) and (l)). In contrast, in 11 M rTg-DI rats, the number of microglia in hippocampus and thalamus was increased and the microglia phenotype was activated with the characteristic enlarged cell bodies and retracted processes (Supplementary Figure 9(o) and (p)).
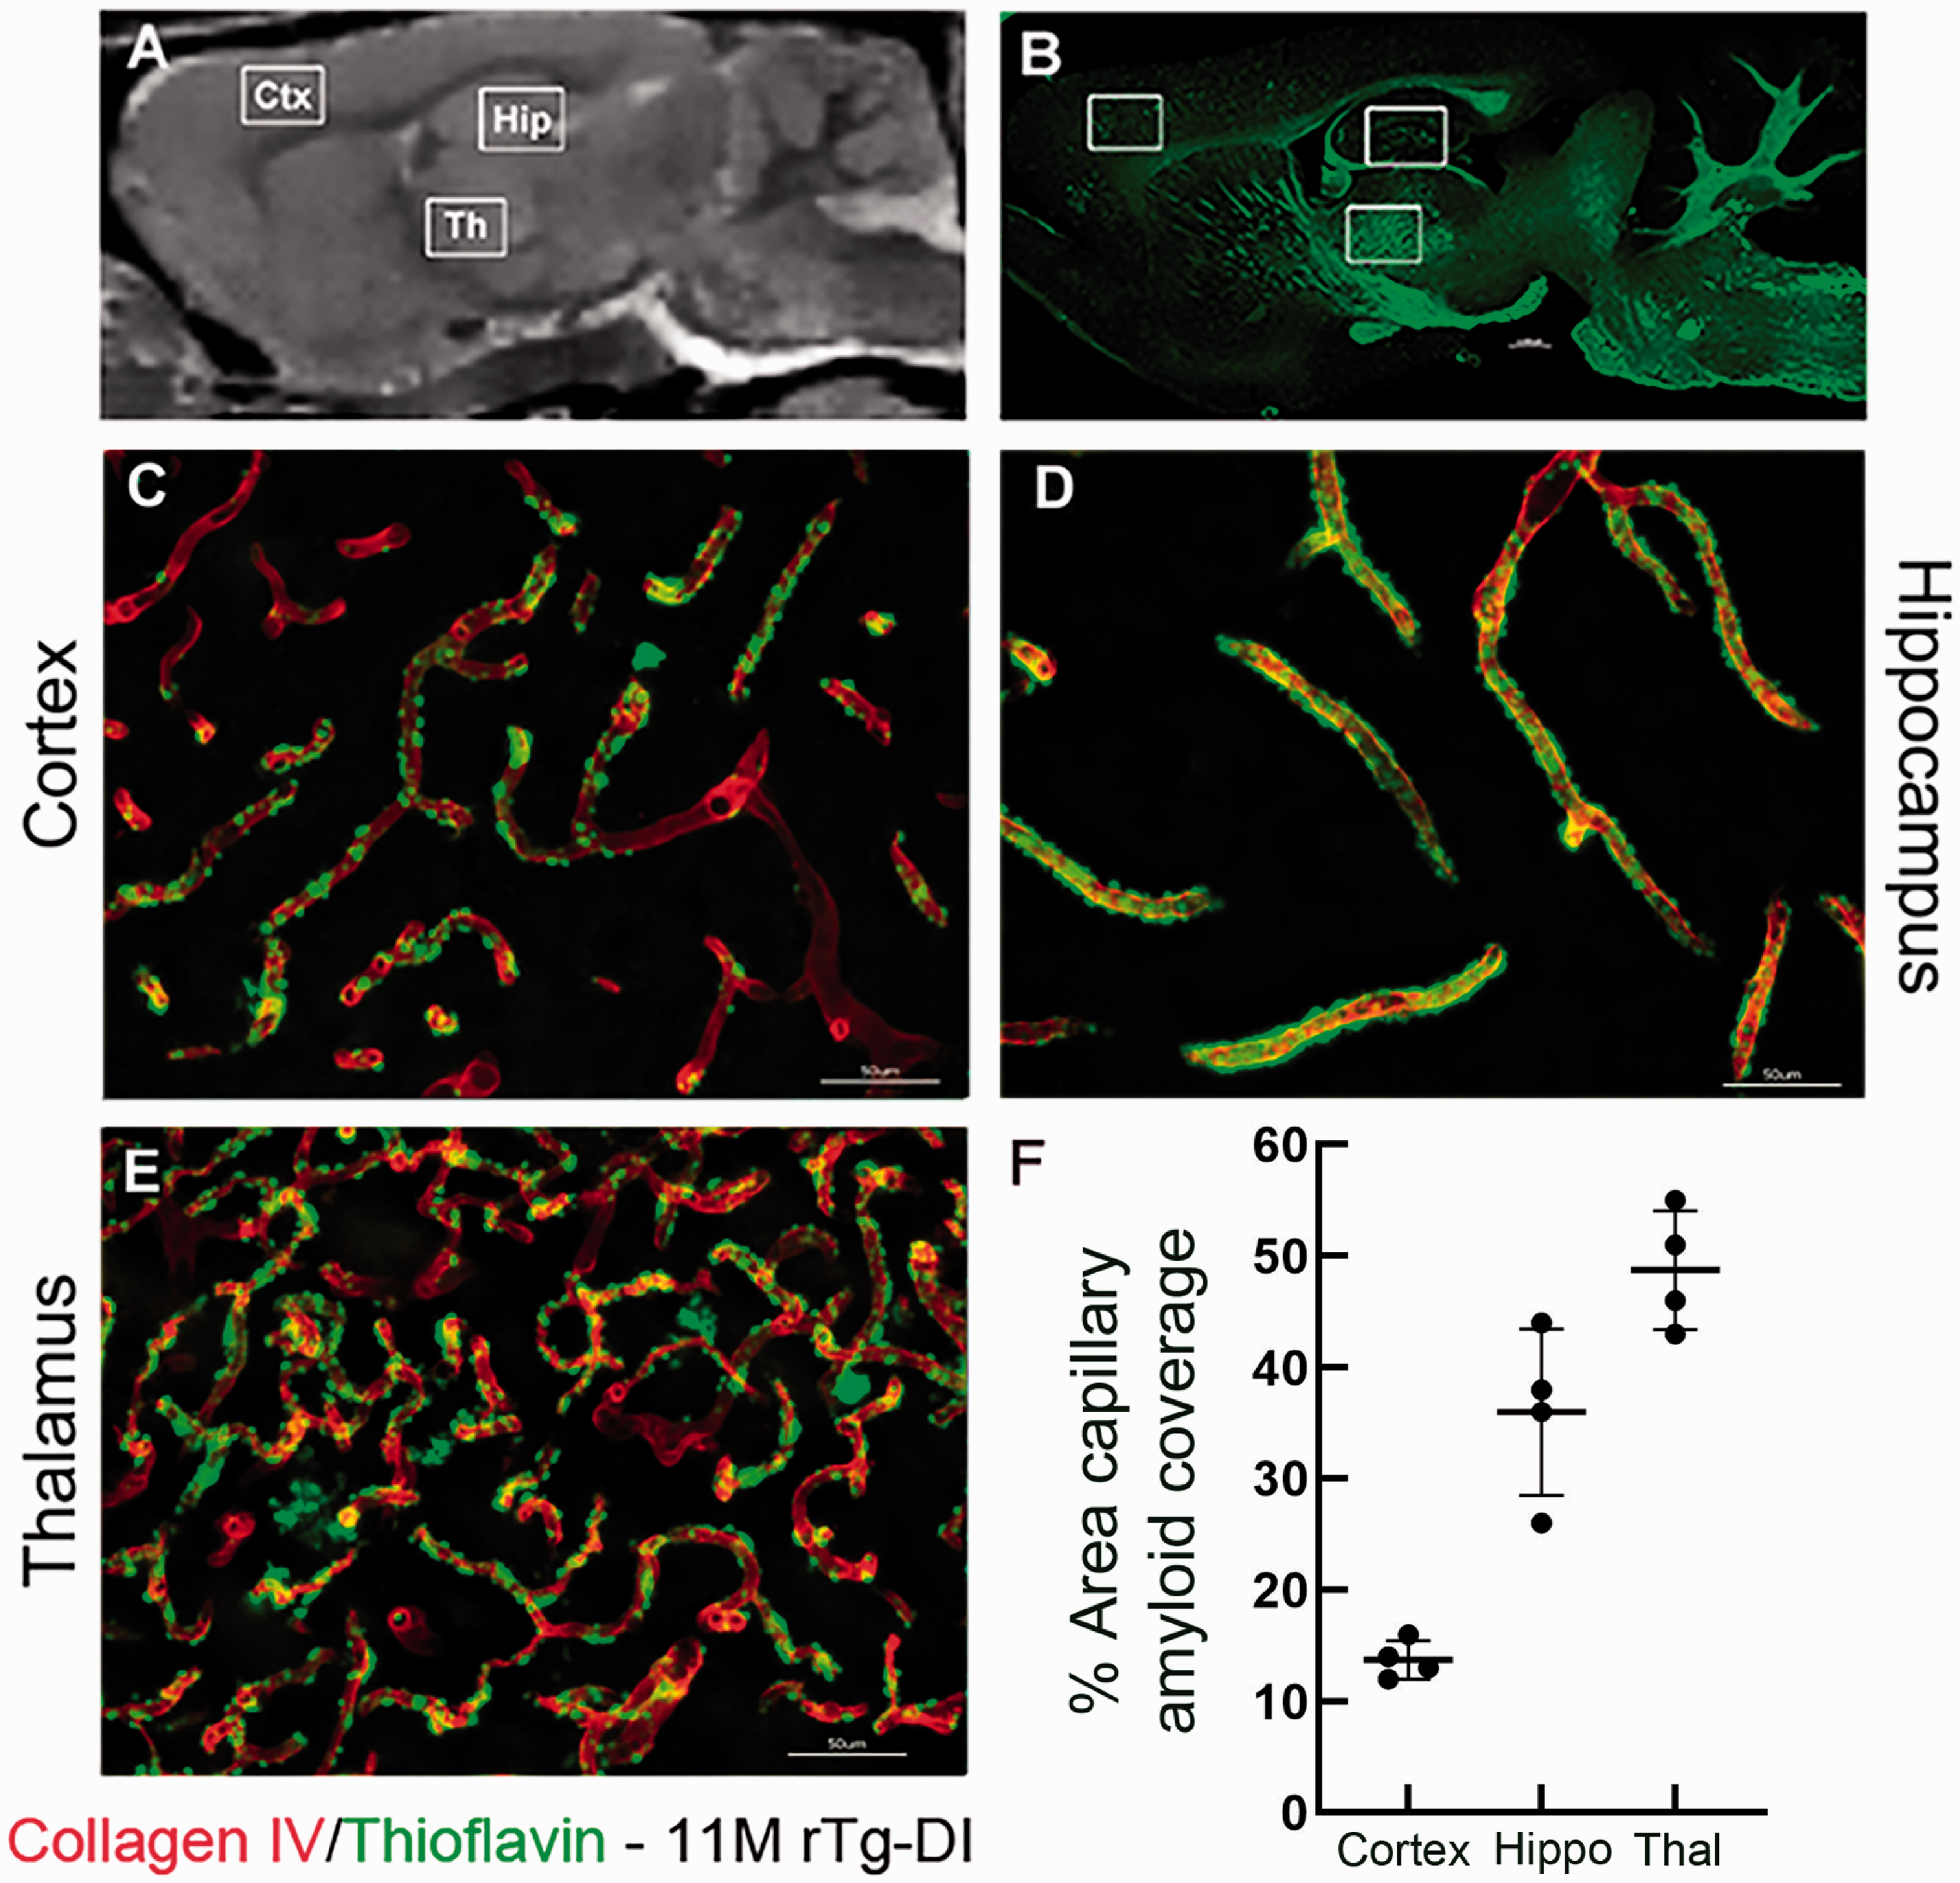
Pattern of microvascular fibrillar Aβ deposition in 11 M rTg-DI rats. (a) Sagittal plane from a proton-density-weighted MRI of a WT rat highlighting anatomical areas of interest: Cortex (Ctx), hippocampus (Hip) and thalamus (Thal). (b) Sagittal brain section from an 11 M old rTg-DI immunolabeled with thioflavin S (ThS) to identify fibrillar amyloid (green). The white boxes highlight the anatomical areas magnified in c–e which are sections from these areas now immunolabeled with rabbit polyclonal antibody to collagen IV to specifically detect cerebral microvessels (red) and stained with ThS to identify fibrillar amyloid (green). The microvascular amyloid deposits are clearly present in Ctx (c), in the hilus region of the hippocampus (d) and in the thalamus (e). Scale bars = 50 µm. (f) The quantitation of microvascular amyloid load in the three brain regions confirming the thalamic area is most heavily affected.
Discussion
The contribution of CAA pathology to subcortical WM disease is a critical question to address for understanding the role of CAA in the pathogenesis of VCID and AD.64–66 The overlap of clinical symptoms between AD and CAA poses significant challenges for understanding their respective contributions to VCID and ultimately for advancing preventive and novel therapeutics. Here we used our novel rTg-DI transgenic rat model of the CAA-type 1 40 in combination with advanced MRI and histological measures to show that evolving CAA type 1 pathology, including CMB, is associated with WM disease. The demonstrated reliability of MRI measures of WM disease with aging makes in vivo MRI studies of the rTg-DI rat model ideal for studying CAA type 1 in isolation without other comorbidities like hypertension or other AD pathologies. Further, the 4-fold larger brain size in comparison with the mouse brain allows improved anatomical resolution using in vivo MRI.
To execute the longitudinal in vivo MRI study, we combined two time-efficient sequences designed to track morphometry as well as CMB. We used a PDW sequence for WM and GM morphometric analysis similar to our previous study on spontaneously hypertensive rats 44 and for CMB load we implemented a multiple gradient echo sequence to derive T2* maps allowing for quantitative age-dependent comparisons across animals and groups. We further validated WM loss by implementing in vitro DTI on separate series of rTg-DI and WT rats to assess WM integrity via FA analysis. The morphometric quantitative in vivo data showed that rTg-DI rats (but not WT controls) started developing WM loss in the CC at 6 M, which rapidly progressed at 9 M and 11 M into a specific pattern of WM loss incorporating the entire body of the CC, internal capsule, AC, thalamus and midbrain. The WM loss documented in vivo was confirmed by in vitro DTI and histology. Remarkably, in spite of massive perivascular Aβ deposition and neuroinflammation in cortex, hippocampus and thalamus, the rTg-DI rats did not exhibit more significant age-dependent GM loss when compared to WT controls at any time point. We also demonstrated that CMB emerged at 6 M in the thalamus in rTg-DI rats and dramatically expanded in thalamus at 9 M and 11 M. The total thalamic CMB volume was not strongly associated with total WM loss in rTg-DI rats (results not shown).
Cerebral microbleeds in CAA type 1 rTg-DI rats
According to the Boston criteria, the key diagnostic imaging features related to a probable case of CAA pathology in humans are the presence of cerebral micro/macrohemorrhages.28,62 CAA-related hemorrhage is thought to result from excessive vascular Aβ deposits leading to structurally brittle vessels that are unable to withstand changes in blood pressure. 67 An alternate hypothesis states that increased expression of proteolytic enzymes contributes to CMB by disrupting the vessel wall in CAA. 25 In support of clinical data linking CAA pathology with cerebral hemorrhage, in the rTg-DI rats, CMB emerged in the thalamus which also exhibited the most extensive deposition of microvascular fibrillar Aβ. A dense network of capillaries with microvascular amyloid was evident in thalamus when compared to cortex and hippocampus. Other reasons for the susceptibility of the thalamus to microvascular Aβ deposition and CMB should be noted. In rodents, the thalamus is proportionately larger than other brain regions compared with the proportions in the human brain. Therefore, it seems more plausible that perivascular Aβ accumulation including microbleeds will emerge in the rodent in the thalamus. Another possibility for extensive perivascular Aβ accumulation in the thalamus may be related to patterns of glymphatic transport flow and waste drainage which has been shown to be less efficient in deep regions such as the thalamus.68–70
In the rTg-DI rats, CMB as defined by lower T2* values was observed to emerge at 6 M in the ventral posteromedial and posterolateral thalamic nuclei. CAA type 1 (as documented in this study) is not the only cSVD associated with thalamic CMB. In patients with genetic forms of CADASIL, ∼50% have microbleeds and these are mostly in the deep structures including thalamus.71,72 In clinical cases of sporadic cSVD, the pattern and prevalence of CMB vary with the underlying type of cerebral angiopathy, its severity and age of patient, but in general up to about 20% of patients with sporadic cSVD have a CMB somewhere. 73 The Boston criteria state that microbleeds at the cortical grey-white matter junction (so-called lobar microbleeds) indicate CAA, whereas those in deep structures like thalamus, internal capsule, lentiform and caudate nuclei indicate hypertensive small vessel pathology. However, in human CAA, although there are often many lobar microbleeds, there are often microbleeds in the deep structures including thalamus (personal observation, Dr. Wardlaw). Of note, CMB are also observed in the thalamus in preference to other sites in other rodent cSVD models, for example the carotid coil hypoperfusion models 74 and in the APP23 mouse model. 75
We observed column-shaped T2* hypo-intensities in the somatosensory cortex of rTg-DI rats which were not associated with histological evidence of hemorrhage and therefore must be attributed to alternate pathophysiology. Quantitative T2* maps reflect local magnetic susceptibility within a given tissue compartment which can be affected by a variety of physical and physiological effects including iron deposition, deoxyhemoglobin, low tissue oxygenation levels, high myelin content, vessel dilation, capillary tortuosity, and/or dense core parenchymal Aβ plaques.60,76–78 As we excluded iron deposition by histology and the absence of dense core Aβ plaques in the rTg-DI rats, alternative explanations should be explored. The cortical column-shaped T2* hypo-intensities could signify vascular remodeling/dilation related to the CAA type 1 pathology.40,79 Given that most of the column-shaped hypo-intensities appeared in somatosensory cortex including barrel cortex, it is reasonable to suggest that they might represent diaschisis of cortical functional column/units in the form of secondary damage due to the thalamic CAA and CMB involving VPM and VPL. 80 In this context, it is noteworthy that rTg-DI mice and rats display early signs of deficit in the novel exploration behavioral tasks.40,55 In this particular test, the rodents are placed in an open field to explore for novel and distinct objects of a short trial period, and the rTg-DI rats exhibit slowing in the manner of exploration of the unique objects suggesting perceptual slowing. 40 This behavioral phenotype could be explained by the lack of major input they would use in exploring new environment and stimuli (e.g. projections from the thalamic VPM to barrel cortex).
Diffuse white matter loss in rTg-DI rats
WM degeneration detected by VBM and DTI analyses was robustly observed in rTg-DI rats around 9 M of age and included CC, internal capsule, AC, thalamus and midbrain. Topographical WM differences between the two strains detected by the morphometric VBM analysis based on PDW images and FA based DTI maps were noted. Both modalities consistently yielded WM compromise in CC, AC, certain parts of thalamus and midbrain (Figures 2 and 3) in rTg-DI compared to WT rats. The loss of WM in the CC observed by imaging was supported by histological myelin staining as well as by direct measurement of MBP levels in the CC supporting the overall analysis and conclusions. However, the extent of WM damage in thalamus and midbrain was different which is likely due to the different parametric measure. The FA parameter is sensitive to loss of WM integrity in pure WM areas and thalamus, the latter of which is a mix of WM and GM, which is therefore an area with inherently lower FA values in normal brain. On the other hand, the VBM analysis based on PDW contrast includes the entire thalamus in the WM template, was more sensitive to WM loss and detected difference at 9 M as well as 11 M. In addition, axonal loss and disruption of WM tracts including the CC and thalamus were confirmed by the SM312 pan axonal neurofilament marker (Supplementary Figure 7). The progressive WM loss and CMB load in thalamus in the rTg-DI rats affect their cognitive function. In the recent study by Popescu et al., 81 a comprehensive age-dependent analysis of cognitive function and behavior in the rTg-DI and WT rats was described using a battery of behavioral tasks. In this study, WT and rTg-DI rats were first evaluated at 3 M of age and habituated to operant training; with data collection beginning at 6 M (when microvascular amyloid starts becoming more extensive) and continuing for 4 M until a final evaluation at 12 M when microvascular Aβ is severe and WM loss significant. 81 The behavioral task performance analysis revealed a general ‘slowing’ of cognition (rather than deficient memory capacity) starting at 7 M in the rTg-DI rats which progressively worsened. 81 Specifically, cognitive assessments showed that rTg-DI rats interacted with their environment more hesitantly and performed ‘slower’ when compared to WT rats consistent with thalamo-cortical dysfunction impacting sensorimotor integration.
We explored the possible mechanisms which might underlie WM loss in the rTg-DI rats. First, WM structures in the rTg-DI rats such as the CC and AC exhibited neither CMB, excessive Aβ deposition nor neuroinflammation indicating that axonal damage was not directly related to either of these pathologies in contrast to what was recently reported in a mouse model of pericyte degeneration. 82 The temporal trajectory of CMB and WM damage suggested that WM damage succeeds the thalamic CMB. However, statistical analysis did not support strong association between thalamic CMB and WM loss which might be attributed to a small sample size combined with a noisy CMB readout signal from the T2* maps. Future studies will need to further explore a potential association between these two parameters. Regardless, the anatomical specificity of WM loss in the CC, AC and midbrain suggest that it is either secondary (or Wallerian) to the thalamic CMB similar to what is reported in CADASIL patients.71,72,83
In summary, white-matter hyperintensities is a well establish imaging feature of normal aging in human and its burden is also associated with cSVD and CAA.8,84 However, until now it has been unclear if CAA pathology alone may contribute to WM degeneration since clinical cases of CAA most often overlap with other cSVD subtypes or AD. Our study now provides novel evidence that CAA type 1 pathology can lead to significant WM loss and degeneration and the extent of WM loss is likely to underlie the early behavioral deficits observed in rTg-DI rats. The evidence of WM loss in CAA is important because long range cortical projection fibers are of great interest in understanding VCID in cSVD.10,85,86 The present findings further underscore the utility of rTg-DI rats to further explore the mechanistic basis of WM degeneration in CAA.
Supplemental Material
sj-pdf-1-jcb-10.1177_0271678X20944226 - Supplemental material for Diffuse white matter loss in a transgenic rat model of cerebral amyloid angiopathy
Supplemental material, sj-pdf-1-jcb-10.1177_0271678X20944226 for Diffuse white matter loss in a transgenic rat model of cerebral amyloid angiopathy by Hedok Lee, Feng Xu, Xiaodan Liu, Sunil Koundal, Xiaoyue Zhu, Judianne Davis, David Yanez, Joseph Schrader, Aleksandra Stanisavljevic, Douglas L Rothman, Joanna Wardlaw, William E Van Nostrand and Helene Benveniste in Journal of Cerebral Blood Flow & Metabolism
Supplemental Material
sj-pdf-2-jcb-10.1177_0271678X20944226 - Supplemental material for Diffuse white matter loss in a transgenic rat model of cerebral amyloid angiopathy
Supplemental material, sj-pdf-2-jcb-10.1177_0271678X20944226 for Diffuse white matter loss in a transgenic rat model of cerebral amyloid angiopathy by Hedok Lee, Feng Xu, Xiaodan Liu, Sunil Koundal, Xiaoyue Zhu, Judianne Davis, David Yanez, Joseph Schrader, Aleksandra Stanisavljevic, Douglas L Rothman, Joanna Wardlaw, William E Van Nostrand and Helene Benveniste in Journal of Cerebral Blood Flow & Metabolism
Supplemental Material
sj-pdf-3-jcb-10.1177_0271678X20944226 - Supplemental material for Diffuse white matter loss in a transgenic rat model of cerebral amyloid angiopathy
Supplemental material, sj-pdf-3-jcb-10.1177_0271678X20944226 for Diffuse white matter loss in a transgenic rat model of cerebral amyloid angiopathy by Hedok Lee, Feng Xu, Xiaodan Liu, Sunil Koundal, Xiaoyue Zhu, Judianne Davis, David Yanez, Joseph Schrader, Aleksandra Stanisavljevic, Douglas L Rothman, Joanna Wardlaw, William E Van Nostrand and Helene Benveniste in Journal of Cerebral Blood Flow & Metabolism
Supplemental Material
sj-pdf-4-jcb-10.1177_0271678X20944226 - Supplemental material for Diffuse white matter loss in a transgenic rat model of cerebral amyloid angiopathy
Supplemental material, sj-pdf-4-jcb-10.1177_0271678X20944226 for Diffuse white matter loss in a transgenic rat model of cerebral amyloid angiopathy by Hedok Lee, Feng Xu, Xiaodan Liu, Sunil Koundal, Xiaoyue Zhu, Judianne Davis, David Yanez, Joseph Schrader, Aleksandra Stanisavljevic, Douglas L Rothman, Joanna Wardlaw, William E Van Nostrand and Helene Benveniste in Journal of Cerebral Blood Flow & Metabolism
Footnotes
Funding
The author(s) disclosed receipt of the following financial support for the research, authorship, and/or publication of this article: The present work was supported by National Institutes of Health RF-AG053991 (H.B., W.V.N.), NS091969 (H.B., W.V.N.), RF-AG057705 (H.B.) and Foundation Leducq Transatlantic Network of Excellence(16/CVD/05) (H.B., J.W.).
Acknowledgements
The authors thank Peter Brown of MRRC (Magnetic Resonance Research Center) at Yale University for coil development and support. Furthermore, the authors would like to thank Stefan Constantinou and Simon Sanggaard for tissue preparation.
Declaration of conflicting interests
The author(s) declared no potential conflicts of interest with respect to the research, authorship, and/or publication of this article.
Authors’ contributions
HL and HB conceived and planned the study and wrote the manuscript. HL executed all in vitro experiments and processed and analyzed MRI data; XL and SK performed in vivo MRI experiments; WVN, XZ, FX, JD, JS and AS bred and genotyped rTg-DI and WT rats, performed quantitative histology and biochemistry and edited the manuscript; DY and HB performed the statistical analysis; DL and JW edited the manuscript.
Supplemental material
Supplemental material for this article is available online.
References
Supplementary Material
Please find the following supplemental material available below.
For Open Access articles published under a Creative Commons License, all supplemental material carries the same license as the article it is associated with.
For non-Open Access articles published, all supplemental material carries a non-exclusive license, and permission requests for re-use of supplemental material or any part of supplemental material shall be sent directly to the copyright owner as specified in the copyright notice associated with the article.