
Abstract
Previous research has documented elevated risk of brain cancer in patients with multiple sclerosis (MS). Separately, human leukocyte antigen (HLA) has been implicated in protection or susceptibility for both conditions. The aim of the current study was to assess a possible role of shared immunogenetic influence on risk of MS and brain cancer. We first identified an immunogenetic profile for each condition based on the covariance between the population frequency of 127 high-resolution HLA alleles and the population prevalence of each condition in 14 Continental Western European countries and then evaluated the correspondence between MS and brain cancer immunogenetic profiles. Also, since each individual carries 12 HLA alleles (2 × 6 genes), we estimated HLA protection and susceptibility for MS and brain cancer at the individual level. We found that the immunogenetic profiles of MS and brain cancer were highly correlated overall (P < .001) and across all 6 HLA genes with the strongest association observed for DRB1, followed by DQB1 and HLA-A. These findings of immunogenetic overlap between MS and brain cancer are discussed in light of the role of HLA in the immune system response to viruses and other foreign antigens.
Significance Statement
Multiple sclerosis and brain cancer prevalences covary with the population frequencies of human leukocyte antigen (HLA) alleles. The resulting immunogenetic profiles of multiple sclerosis and brain cancer are highly correlated. Shared immunogenetic influences may underlie elevated occurrence of brain cancer in patients with multiple sclerosis.
Introduction
The human immune system is designed to promote health via detection and elimination of pathogens and, under healthy conditions, that role is preserved; however, immune system alterations are implicated in a wide range of conditions, 1 and common mechanisms may underlie co-occurrence of immune-mediated conditions. To that end, both multiple sclerosis (MS), a chronic autoimmune disease characterized by central nervous system demyelination and axonal degradation, and cancer are associated with immune system dysfunction, 2 prompting several studies investigating cancer risk in patients with MS. Those studies have generally found that overall cancer risk as well as the risk of some specific cancers is reportedly lower in patients with multiple sclerosis (MS) compared to the general population3-5; however, brain cancer is often found to be more common in MS patients5-7 (c.f., Ref. 8 ) and is associated with decreased survival. 9 It has been suggested that the immunological profile of MS patients may be related to be increased or decreased risk of some cancers. 7 Since human leukocyte antigens (HLA) are critically involved in the human immune response, here we evaluated the association of MS and brain cancer though the lens of shared HLA profiles.
The HLA region on chromosome 6, the most polymorphic region of the entire human genome, codes for 2 main classes of cell-surface proteins involved in the human immune system response to non-self antigens including viruses, bacteria, and cancer neoantigens. HLA Class I (HLA-A, B, C) binds with and presents intracellular antigen peptides to CD8+ cytotoxic T cells, signaling destruction of infected cells; HLA Class II (HLA-DR, DQ, and DP genes) binds with and presents endocytosed extracellular antigen peptides to CD4+ T cells, thereby promoting B-cell mediated antibody production and adaptive immunity. HLA has been implicated in a wide variety of conditions 10 and subtle differences, particularly in the binding groove, contribute to variation in disease associations.11,12
HLA has been widely implicated in autoimmune diseases including MS.13-18 The strongest and most consistent HLA-MS effect is increased MS risk associated with HLA-DRB1*15:01, although several other HLA alleles have been associated with MS risk (eg, A*03:01) and protection (eg, DRB1*14:01 and A*02:01). 14 We have recently utilized an immunogenetic epidemiological approach19-27 to characterize an HLA profile for various conditions based on correspondence between the population frequencies of 127 HLA Class I and II alleles and the population prevalence of a given disease in Continental Western European countries. That approach results in identification of HLA alleles that are negatively associated with disease prevalence (ie, protective alleles) as well as HLA alleles that are positively associated with disease prevalence (ie, susceptibility alleles). Application of that approach to MS 23 generally corroborated several previous findings regarding HLA-MS associations and extended the literature regarding HLA-MS associations to include effects of a large number of HLA alleles, many of which were found to be protective against MS prevalence at the population level.
HLA has also been widely implicated in cancer.25-29 Like MS, several previous studies investigating the influence of HLA on brain cancer have identified HLA associations with increased or decreased brain cancer risk; however, findings across studies have been inconsistent.30-37 Population-differences in HLA composition38,39 coupled with differences in sample characteristics may partially account for the inconsistent findings. For example, in Caucasian Germans, HLA-A*25, HLA-B*27, and HLA-DRB1*15 were associated with increased risk of cerebral glioma whereas HLA-DRB1*07 was associated with decreased risk. 37 In Italians, HLA-A*11, DQB1*06, DRB1*14, and DRB3*01 were associated with increased risk of glioma and B*07, C*04, and C*05 were associated with decreased risk. 32 Still, studies in the United States including primarily individuals of European Ancestry identified protective effects of HLA-A*3230,31 and DQB1*05 37 on glioma risk and increased risk associated with B*13 and B*55 32 as well as DQB1*06 and DRB1*13. 36 In addition to sample differences, most prior HLA-brain cancer studies have relied on 1-field HLA resolution which limits HLA-disease associations to the allele level. Since even single amino acid differences in HLA affect disease associations,11,12 2-field resolution, which specifies protein-level differences within an allele group, permits more nuanced investigation of HLA-disease effects. One large consortium study of glioma patients and controls of European ancestry reported increased risk of glioma in carriers of DRB1*15:01, DQA1*01:02, and DQB1*06:02, and the related extended haplotype. 33
In light of increased brain cancer in MS patients and some evidence of common HLA associations in both conditions (eg, DRB1*15:01), here we first identified an immunogenetic profile for MS and brain cancer based on the covariance between the population frequency of 127 high-resolution HLA alleles and the population prevalence of each condition and then evaluated the correspondence between MS and brain cancer immunogenetic profiles.
Materials and Methods
Prevalence of multiple sclerosis and brain cancer
The population prevalences of MS and brain cancer (BC) were computed for 14 countries in Continental Western Europe (Table 1). For each country we identified the total number of people with each condition in 2016 from the Global Health Data Exchange, 40 a publicly available catalog of data from the Global Burden of Disease study, and divided those values by the total population of each country in 2016. 41 Life expectancy was not included in the current analyses since it is virtually identical for these countries. 20
Multiple sclerosis (MS) and brain prevalence (BC) in the 14 CWE countries studied. Counts (N) are for 2016.

HLA alleles
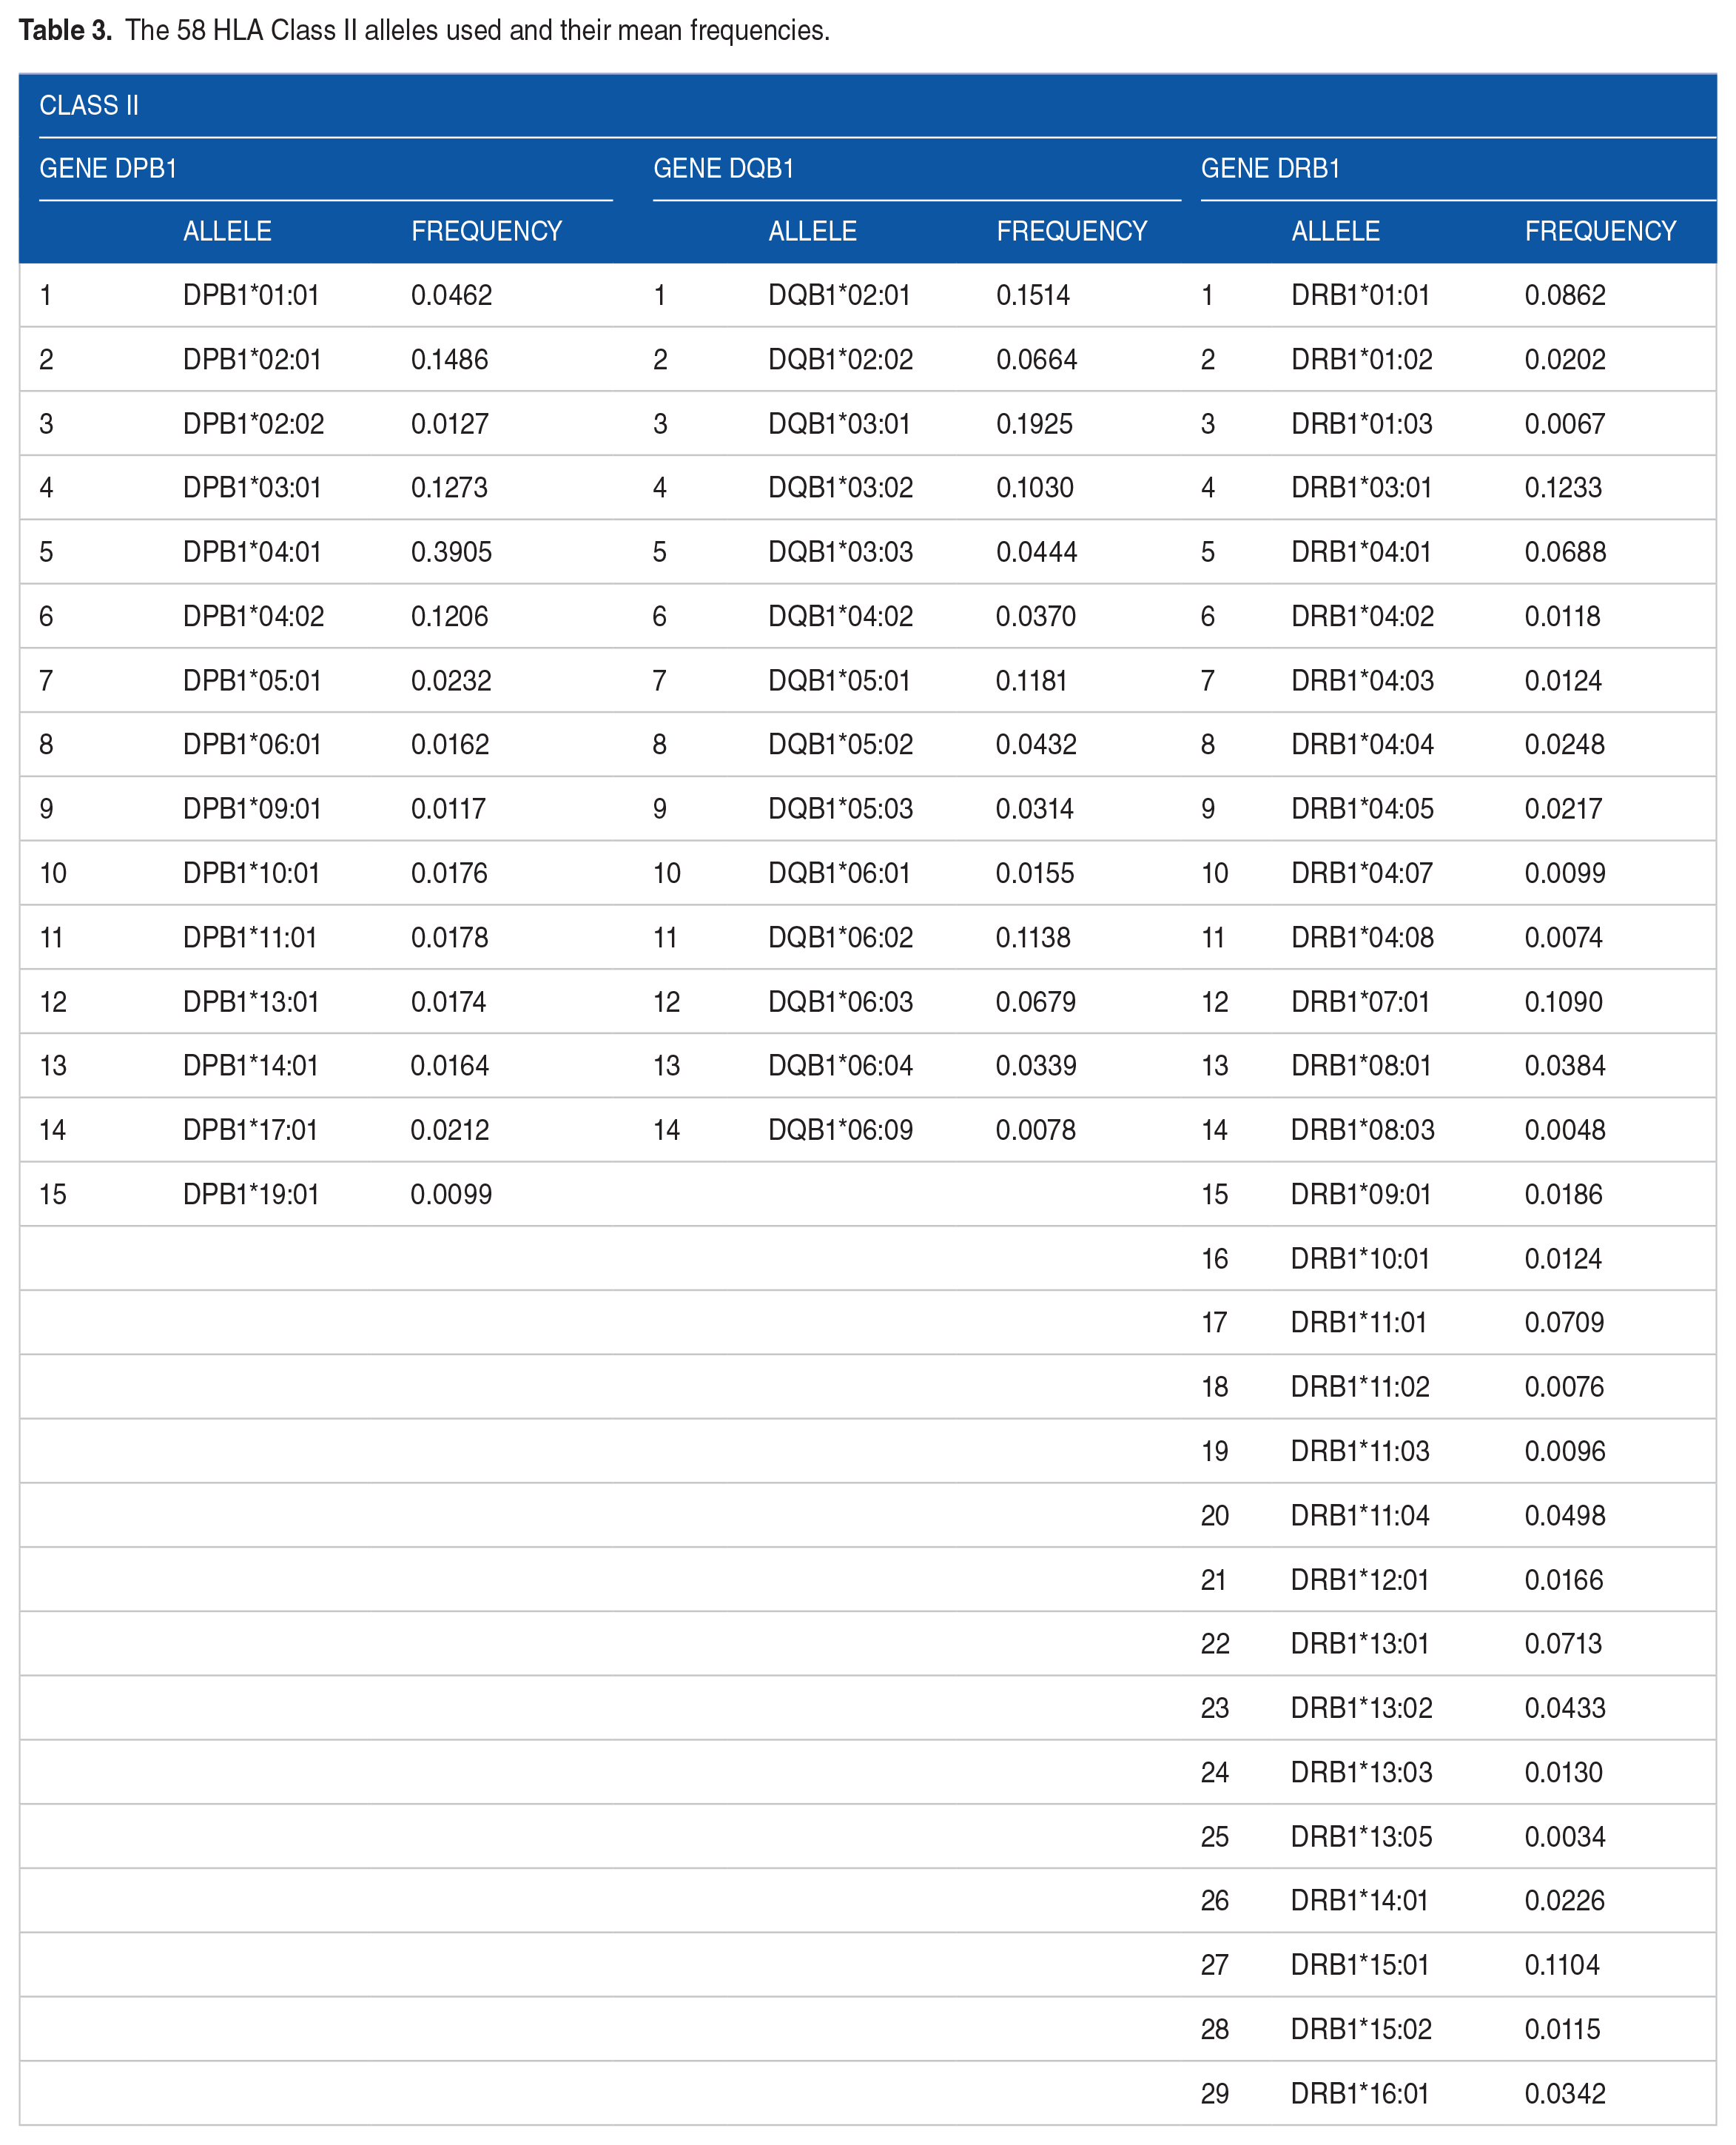
We obtained the population frequency of 127 HLA alleles from 14 Continental Western European Countries (Austria, Belgium, Denmark, Finland, France, Germany, Greece, Italy, Netherlands, Portugal, Norway, Spain, Sweden, and Switzerland), The frequencies of all reported HLA alleles of classical genes of Class I (A, B, C) and Class II (DPB1, DQB1, DRB1) for each of the 14 Continental Western European countries were retrieved from Allele Frequencies in Worldwide Populations (http://allelefrequencies.net/hla6006a.asp) on October 20, 2020. There was a total of 2746 entries of alleles from the 14 Continental Western European countries, comprising 844 distinct alleles. Of those, 127 alleles occurred with frequencies ⩾0.01 in 9 or more countries and were used in further analyses (69 Class I and 58 Class II alleles). The alleles and their mean frequencies of the individual alleles (across countries) are given in Tables 2 and 3 for HLA Class I and Class II, respectively. Alleles of genes DRB3, DRB4 and DRB5 were not used since they do not occur in all individuals. All but one (A*36:01) of the 127 alleles have previously been reported to be Common in all population groups (African/African American, Asian/Pacific Islands, European/European descent, Middle East/North Coast of Africa, South or Central America/Hispanic/Latino, Native American populations, and unknown/not asked/multiple ancestries/other, and in all groups combined (Total). 42 Allele A*36:01 was Intermediate for American, Asian/Pacific Islands, European/European descent, but Common for all other groups and Total. 42
The 69 HLA Class I alleles used and their mean frequencies.

The 58 HLA Class II alleles used and their mean frequencies.
Immunogenetic (HLA) profiles of MS and BC
We computed the covariance between the prevalence of each disease and the population frequency of 127 HLA Class I (N = 69) and Class II (N = 58) alleles in the 14 CWE countries above. The covariance can be negative or positive, indicating a protective or susceptibility (P/S) association, respectively. We call these covariance values MS-PScov and BC-PScov scores for MS and BC, respectively. Thus the HLA profiles for each disease is a vector of 127 PScov scores. The equation for the PScov scores is:

where
Standard parametric (mean, standard deviation, etc.) and nonparametric statistics (median, interquartile range, etc.) were used to evaluate the distribution of scores. We used Tukey’s 43 fences to identify outlier and extreme values of the PScov distribution, as follows.


where Q1, Q3 are the 25th and 75th percentiles, respectively. These fences demarcated outlier values, that is, values outside the fences.
Random permutations test for assessing the statistical significance of the MS and BC HLA PScov profiles
In this analysis, we tested the null hypothesis that the MS- and BC-HLA PScov profiles (vectors) may be due to chance by performing the permutation test below. Let H be the observed Disease-HLA profile and H′ be the profile obtained by random permutation, as follows. (1) For each allele, its observed frequencies were paired to randomly permuted prevalences of MS (or BC) in the 14 CWE countries above. (2) The covariance between allele frequency and corresponding (to the permuted country) disease prevalence was computed to yield a “permuted” Disease-HLA profile, H′, consisting of 127 PScov scores. (3) The observed (H) and permuted (H’) PScov profiles were ranked and the absolute differences between the H and H′ ranks computed and summed: a sum of zero would indicate that the 2 profiles are the same. (4) Finally, we carried out this procedure 1 000 000 times and counted the number of times M that that sum was equal to zero, indicating that the ranks of the observed and permuted PScov scores are the same. (5) Then, the ratio
Application to individuals
Since every individual carries 12 classical HLA alleles (2 of each 3 HLA Class I and 3 Class II genes), average MS PScov and BC PScov scores were calculated:


We obtained expected estimates of ξ and θ using a bootstrap procedure, 44 as follows. For each gene and disease, 2 scores were drawn randomly (with replacement) from the pool of available alleles of that gene and disease, and were averaged to yield bootstrap values of ξ* and ζ* for a simulated “individual.” The procedure was repeated 1000 times for a total of 1000 ξ* and ζ* values. The association between MS PScov and BC PScov scores was evaluated by computing the Pearson correlation between the individual (original) MS and BC PScov scores, and between ξ* and ζ*.
Implementation of analysis procedures
The IBM-SPSS statistical package (version 27) was used for implementing standard statistical analyses, including nonparametric exploratory data analysis, 43 regression analysis, and testing of proportions. All P values reported are 2-sided. The permutation test and bootstrap procedure was implemented using FORTRAN (Geany, version 1.38, built on or after 2021-10-09) and 64-bit Mersenne Twister random number generator with a large random double-precision odd seed.
Results
Prevalences
The prevalences of MS and BC (Table 1) were weakly but statistically significantly positively associated (Figure 1; Pearson r = .541, P < .046; Spearman r = .578, P = .030, N = 14).

The prevalence of brain cancer is plotted against the prevalence of MS. N = 14 CWE countries. See text for details.
HLA MS- and BC PScov scores
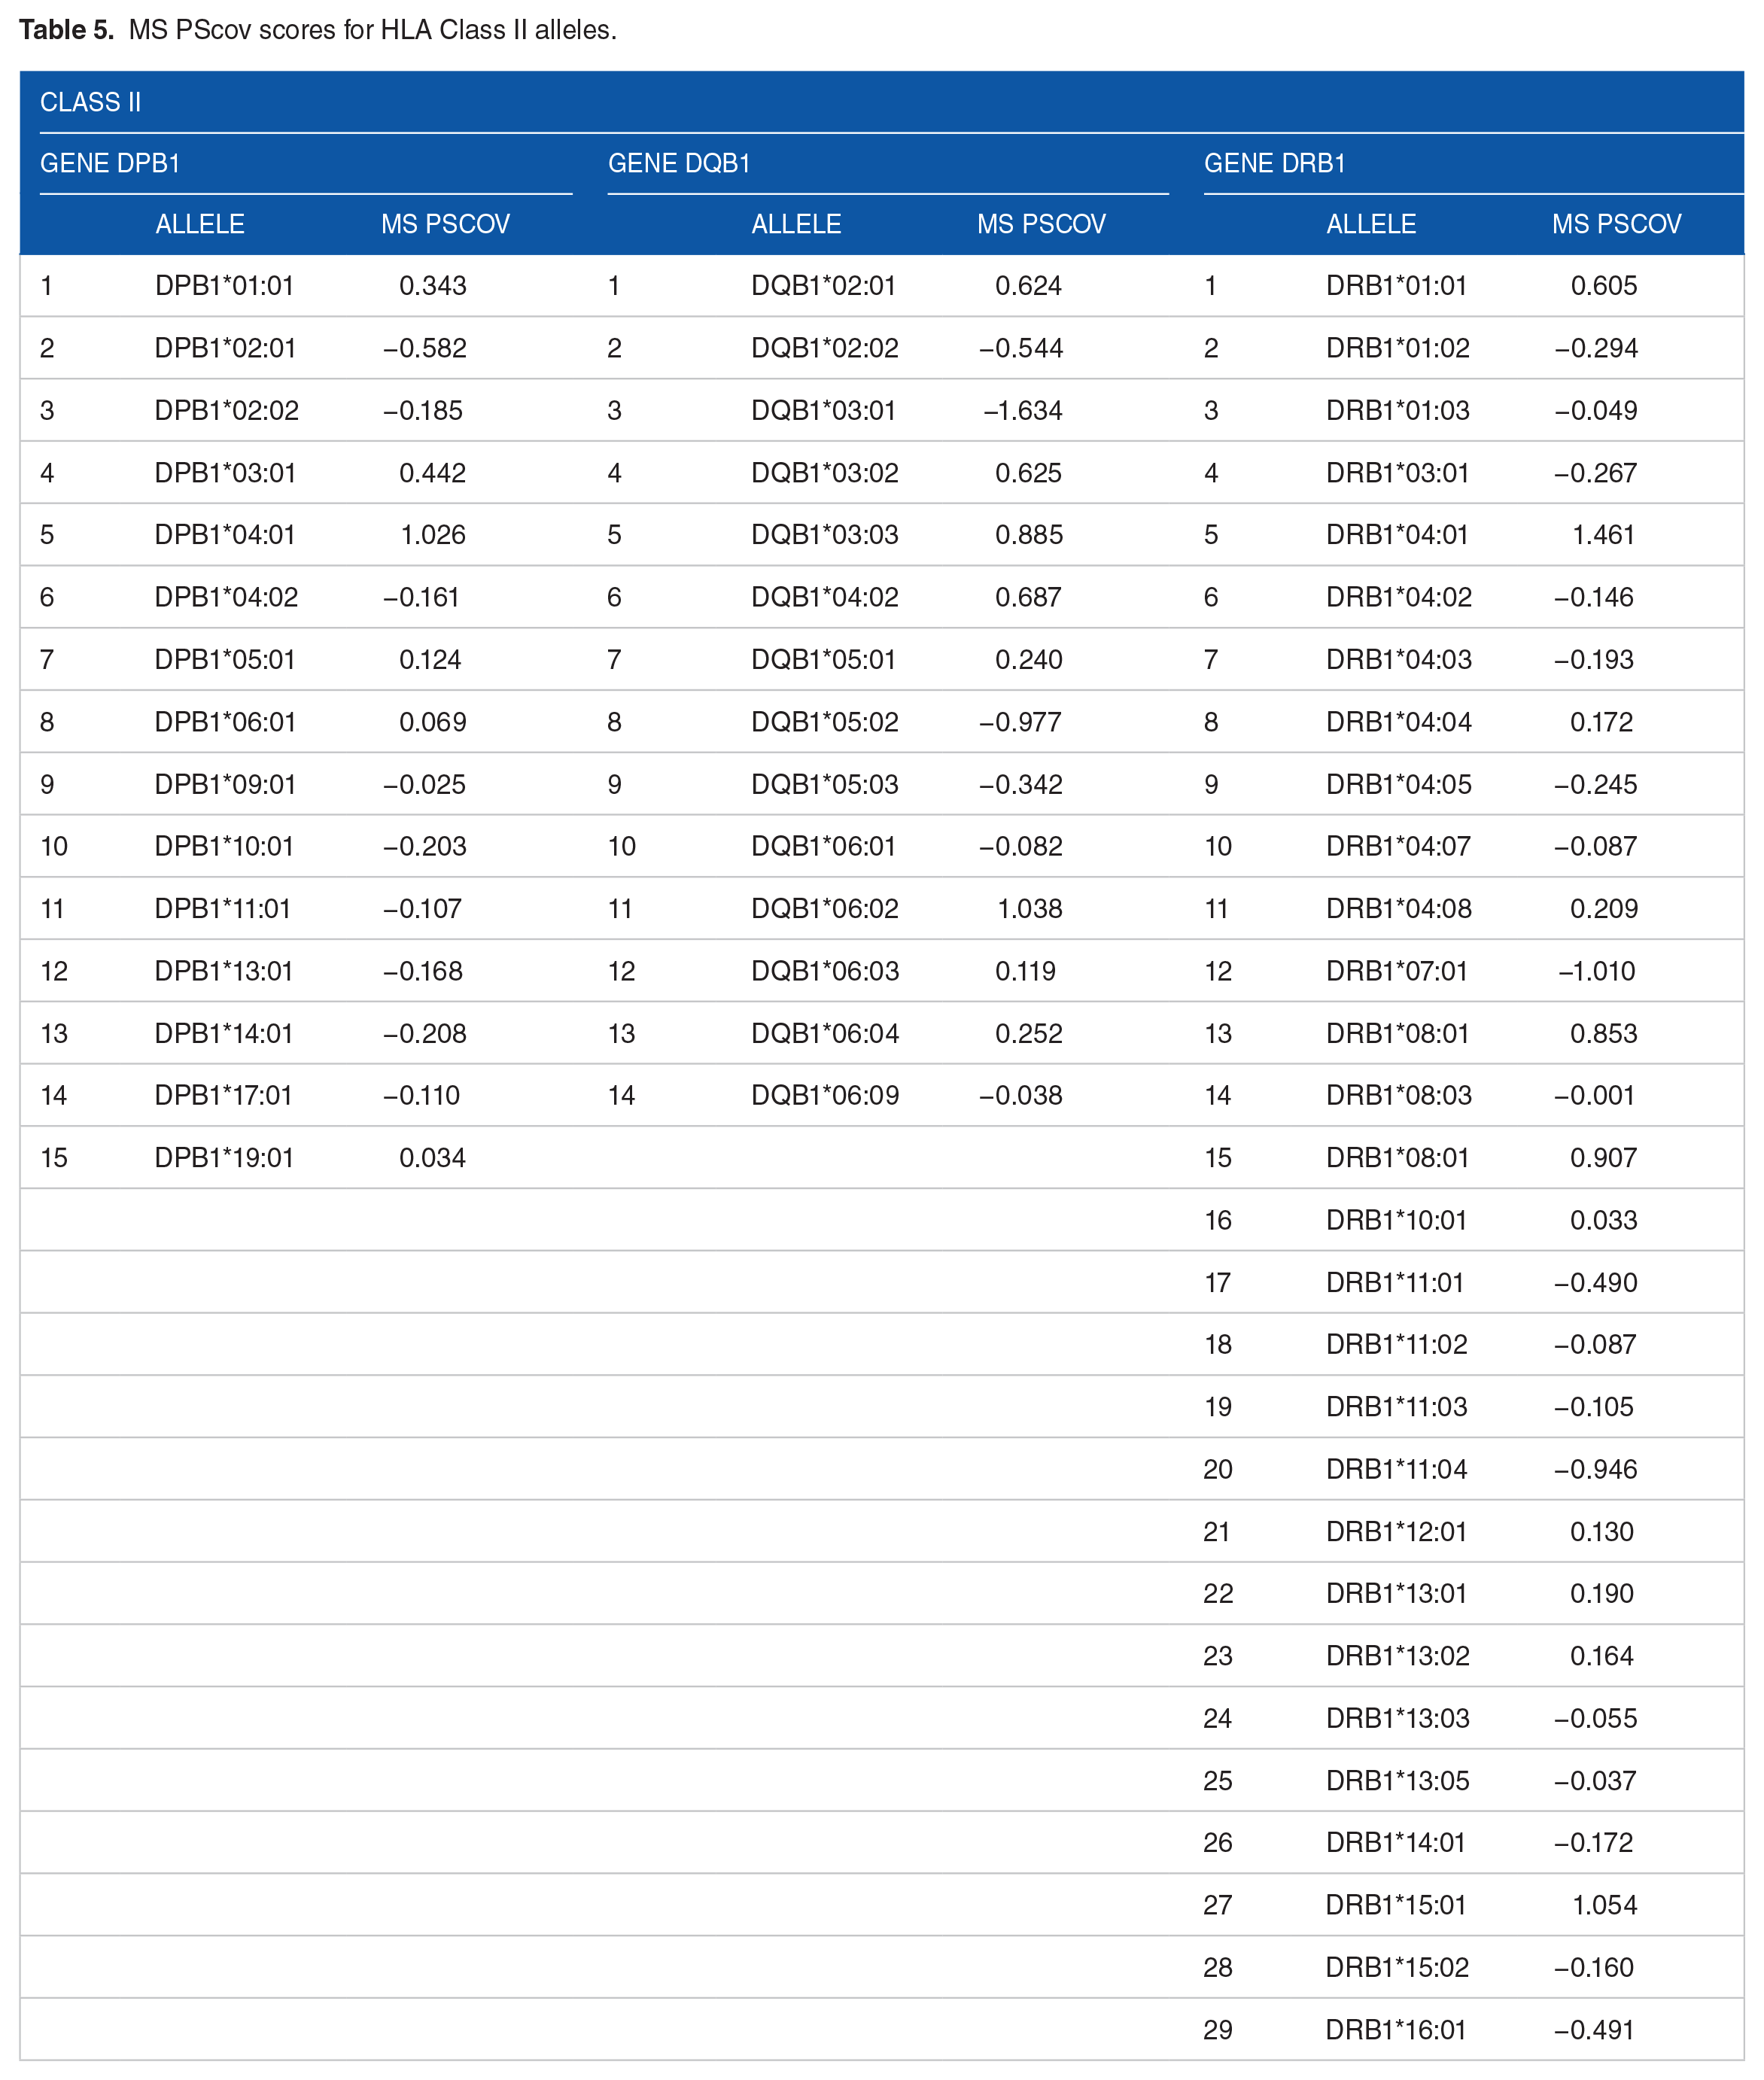
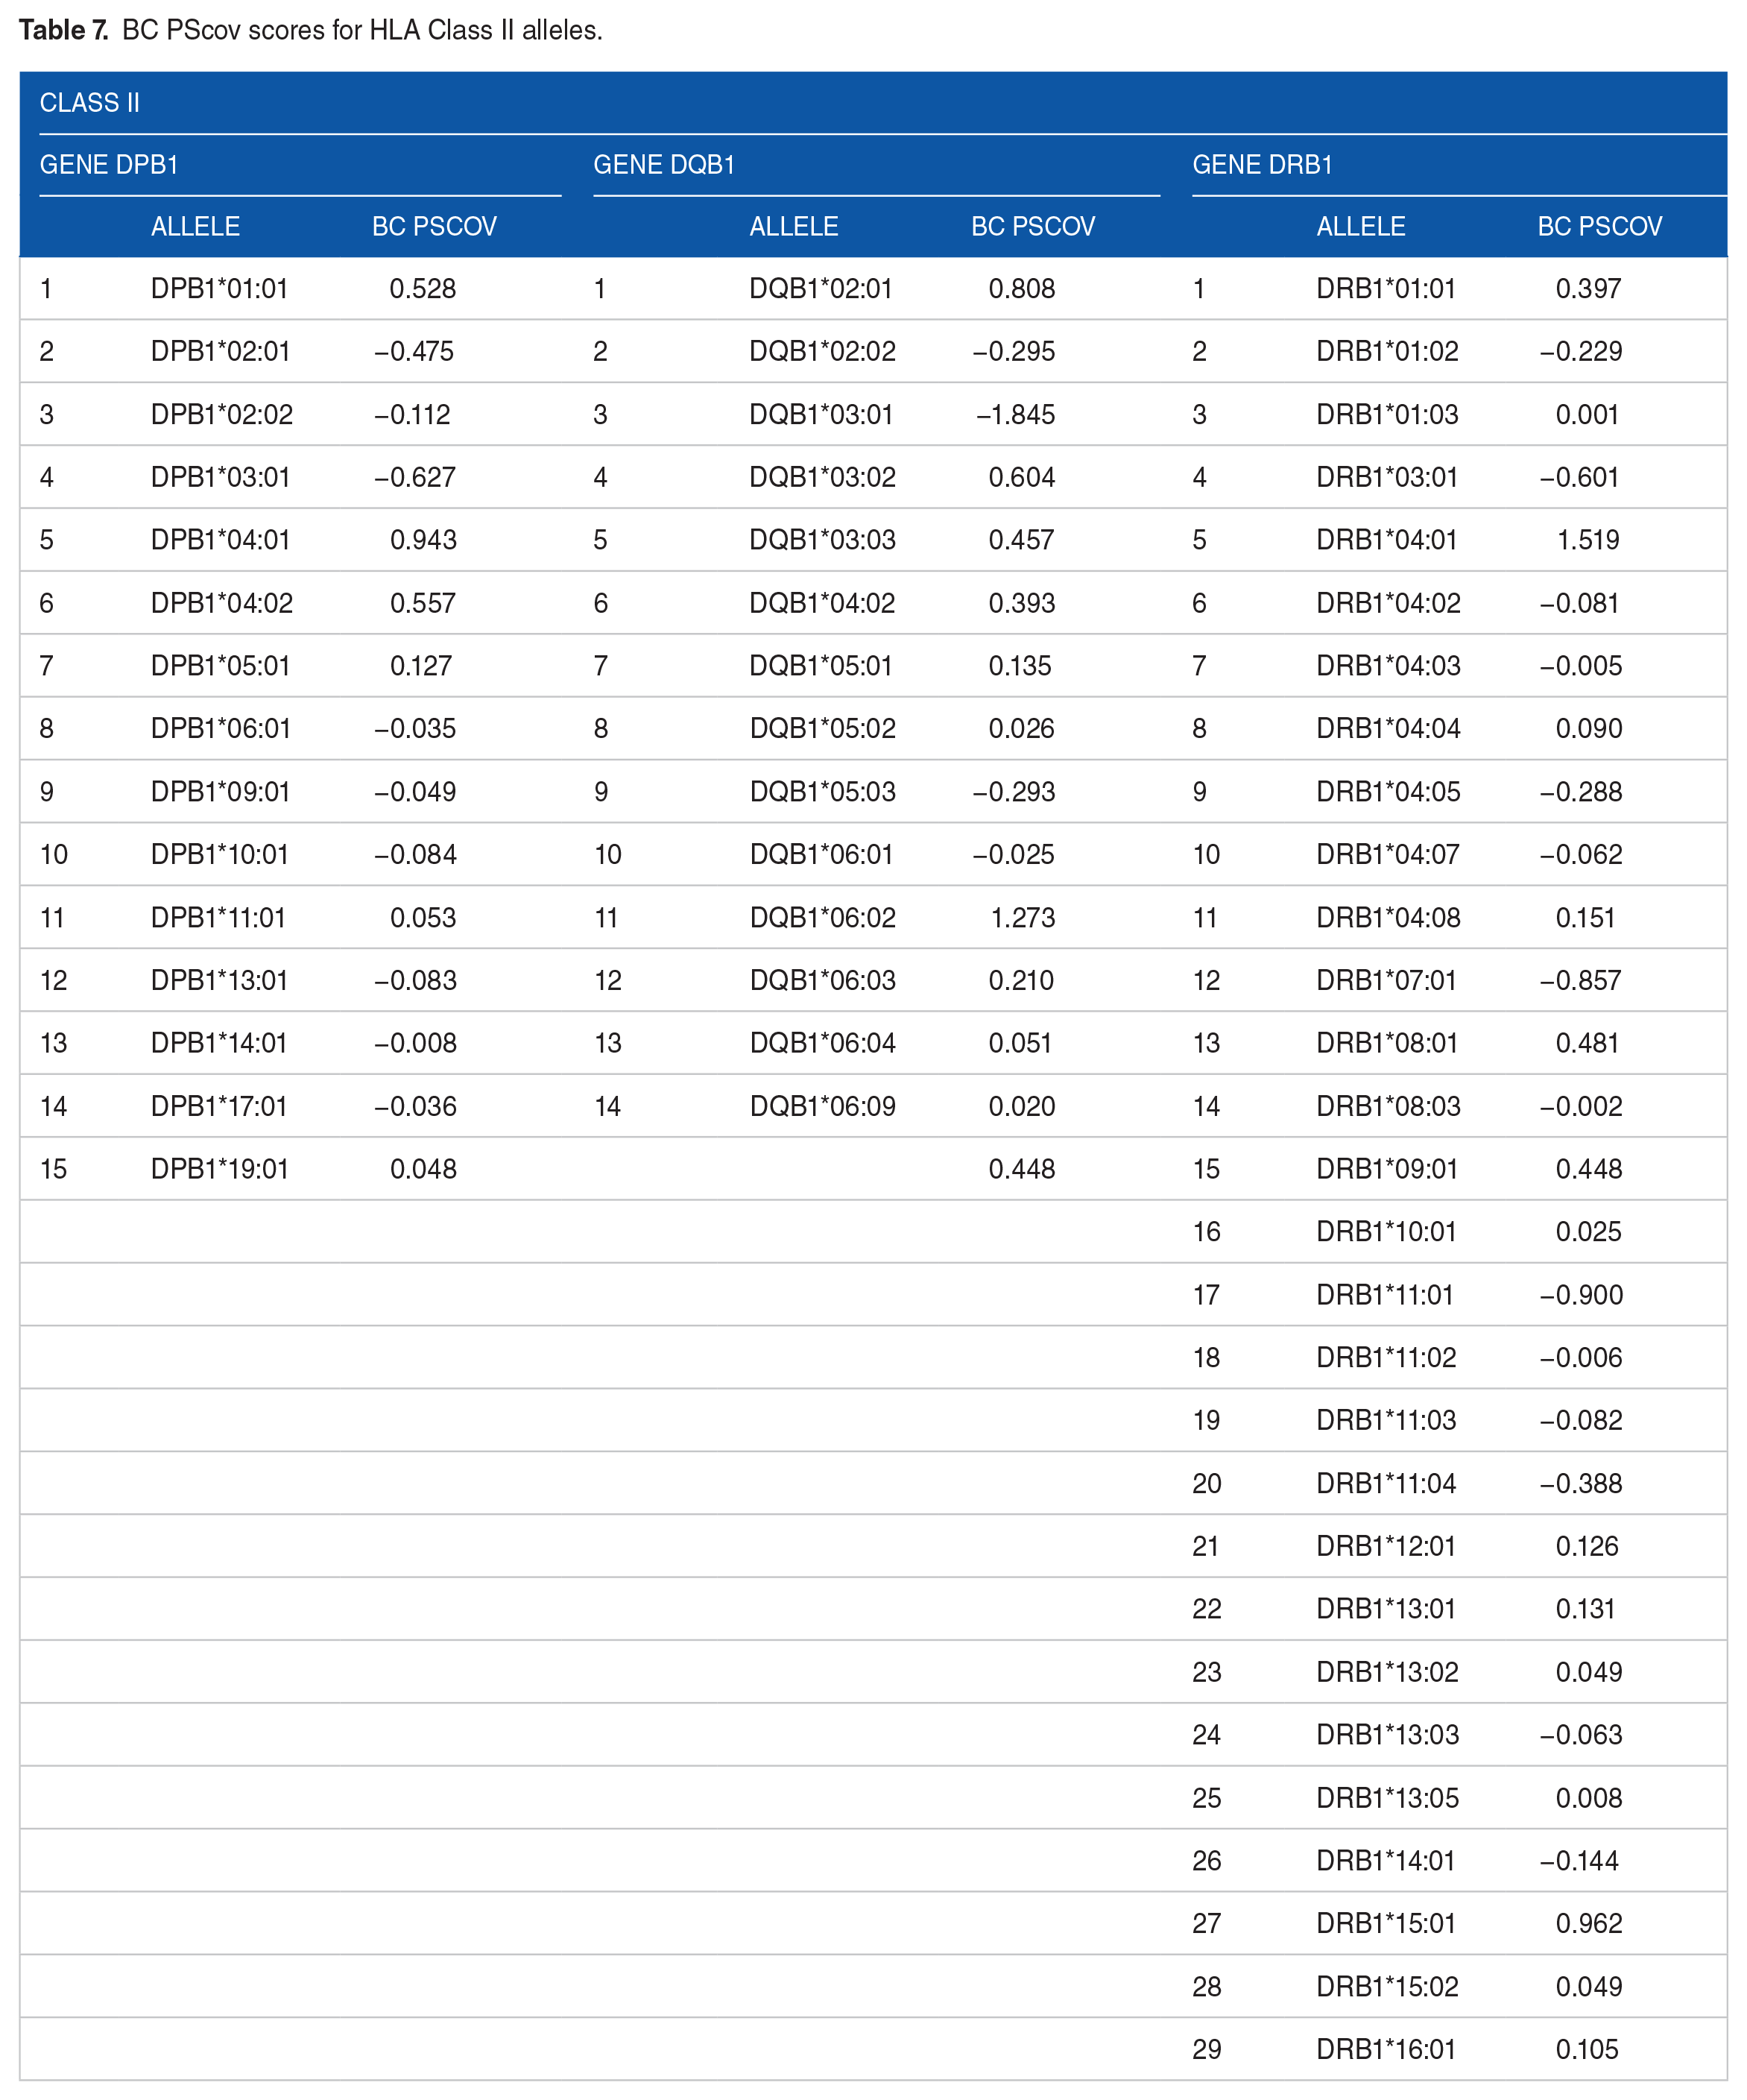
The MS PScov scores are given in Tables 4 and 5 for HLA Class I and II alleles, respectively; the BC PScov scores are given in Tables 6 and 7 for HLA Class I and II alleles, respectively. These sets of MS-HLA and BC-HLA PScov scores could not be due to chance, since no cases were found where a random pairing of MS- or BC- prevalence with allele frequency (out of 1 000 000 runs) matched the observed MS-HLA or BC-HLA or PScov profiles, thus rejecting the null hypothesis that the observed profiles could be accounted for by chance (P < 1 × 10⁻⁶) for both MS and BC PScov scores.
MS PScov scores for HLA Class I alleles.

MS PScov scores for HLA Class II alleles.
BC PScov scores for HLA Class I alleles.

BC PScov scores for HLA Class II alleles.
MS and BC PScov scores are plotted ranked in Figure 2A and B respectively. It can be seen that they comprised similar numbers of protection (negative) and susceptibility (positive) values. More specifically, MS PScov scores comprised 78/127 (61.4%; Z = 2.573, P = .01, Wilson score test for single proportion; null hypothesis is 50%) protection values versus 62/127 (48.8%; Z = −0.266, P = .790, same test; null hypothesis of 50%) of BC PScov. This small preponderance of 12.6% in protective scores in MS versus BC was statistically significant (Z = 2.018, P = .044, Wald H0 test of independent sample proportions).

(A) Multiple sclerosis (MS) PScov scores are plotted ranked, (B) same for brain cancer (BC) scores. N = 127 HLA alleles.
Distributions of MS and BC PScov scores
Their frequency distributions and boxplots are shown in Figures 3A, B, 4A and B, respectively. The distributions were unimodal and did not differ significantly from each other (P = .071, Kolmogorov-Smirnov test), nor did the scores paired for each allele (paired t-test, t[126], P = .764).

Frequency distributions of MS (A) and BC (B) PScov scores.

Boxplots of the distributions of MS (A) and BC (B) PScov scores shown in Figure 3. See text for details.
Associations of MS and BC PScov scores
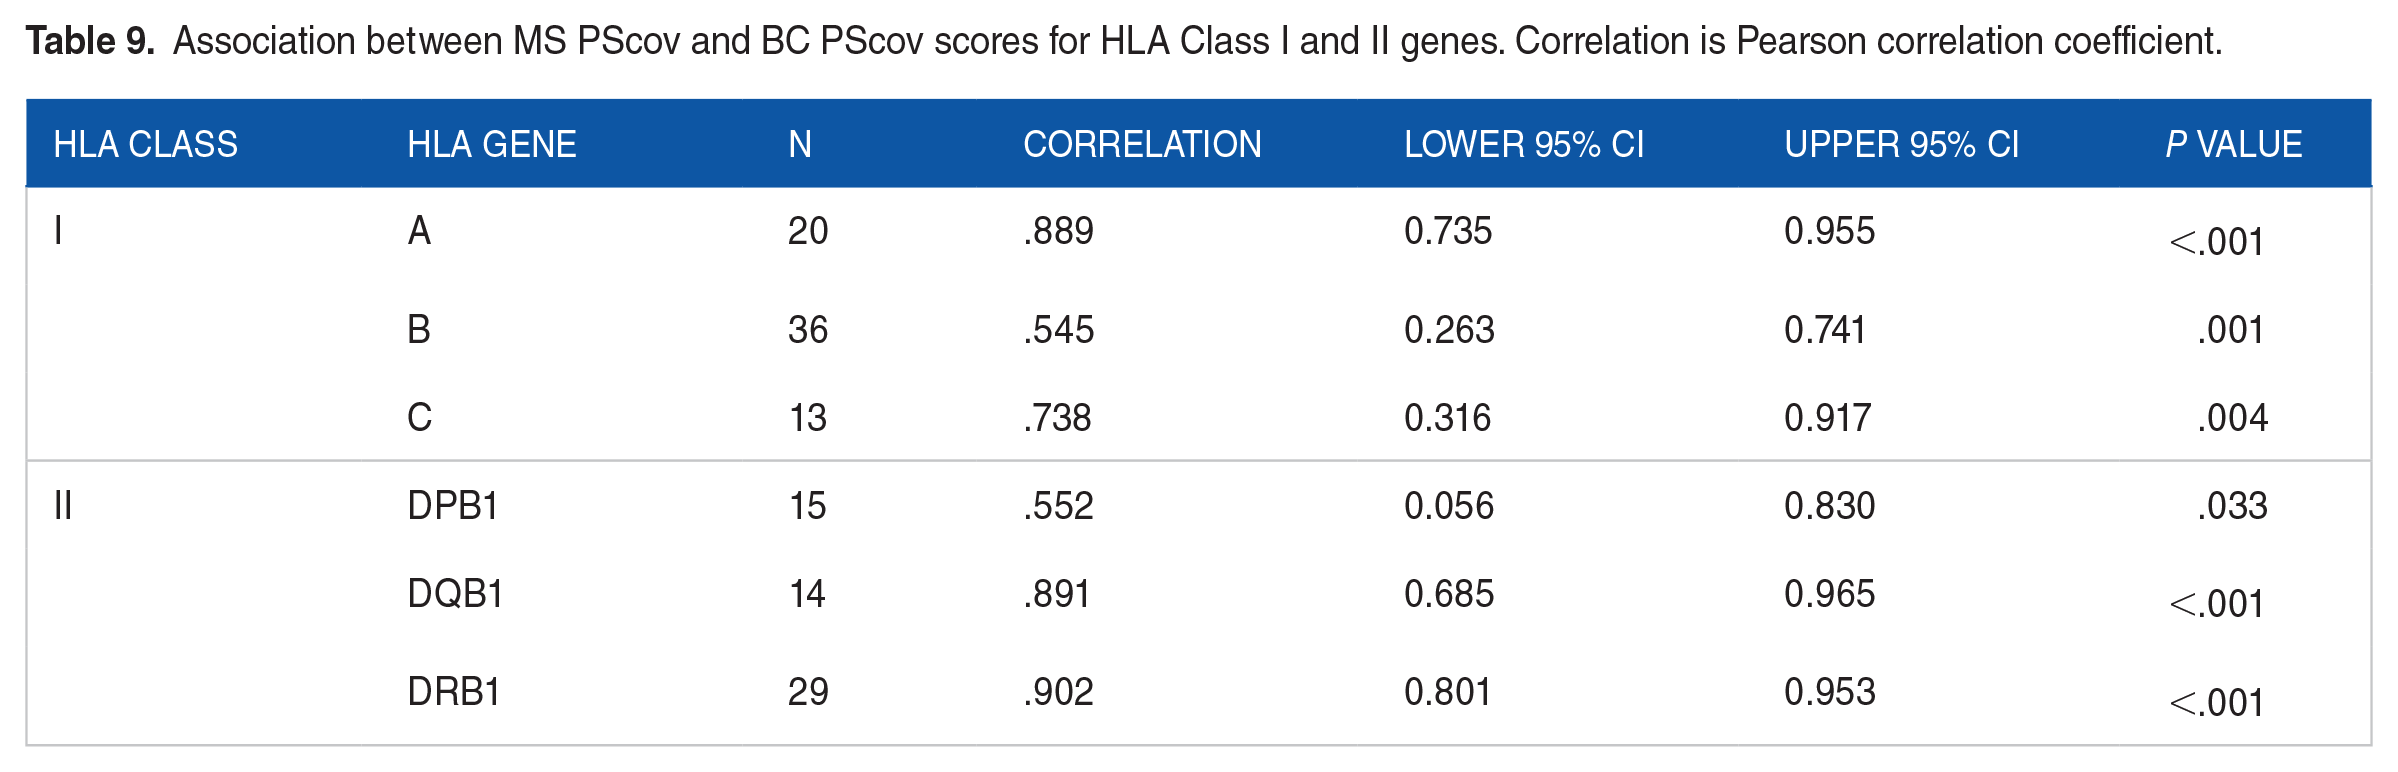
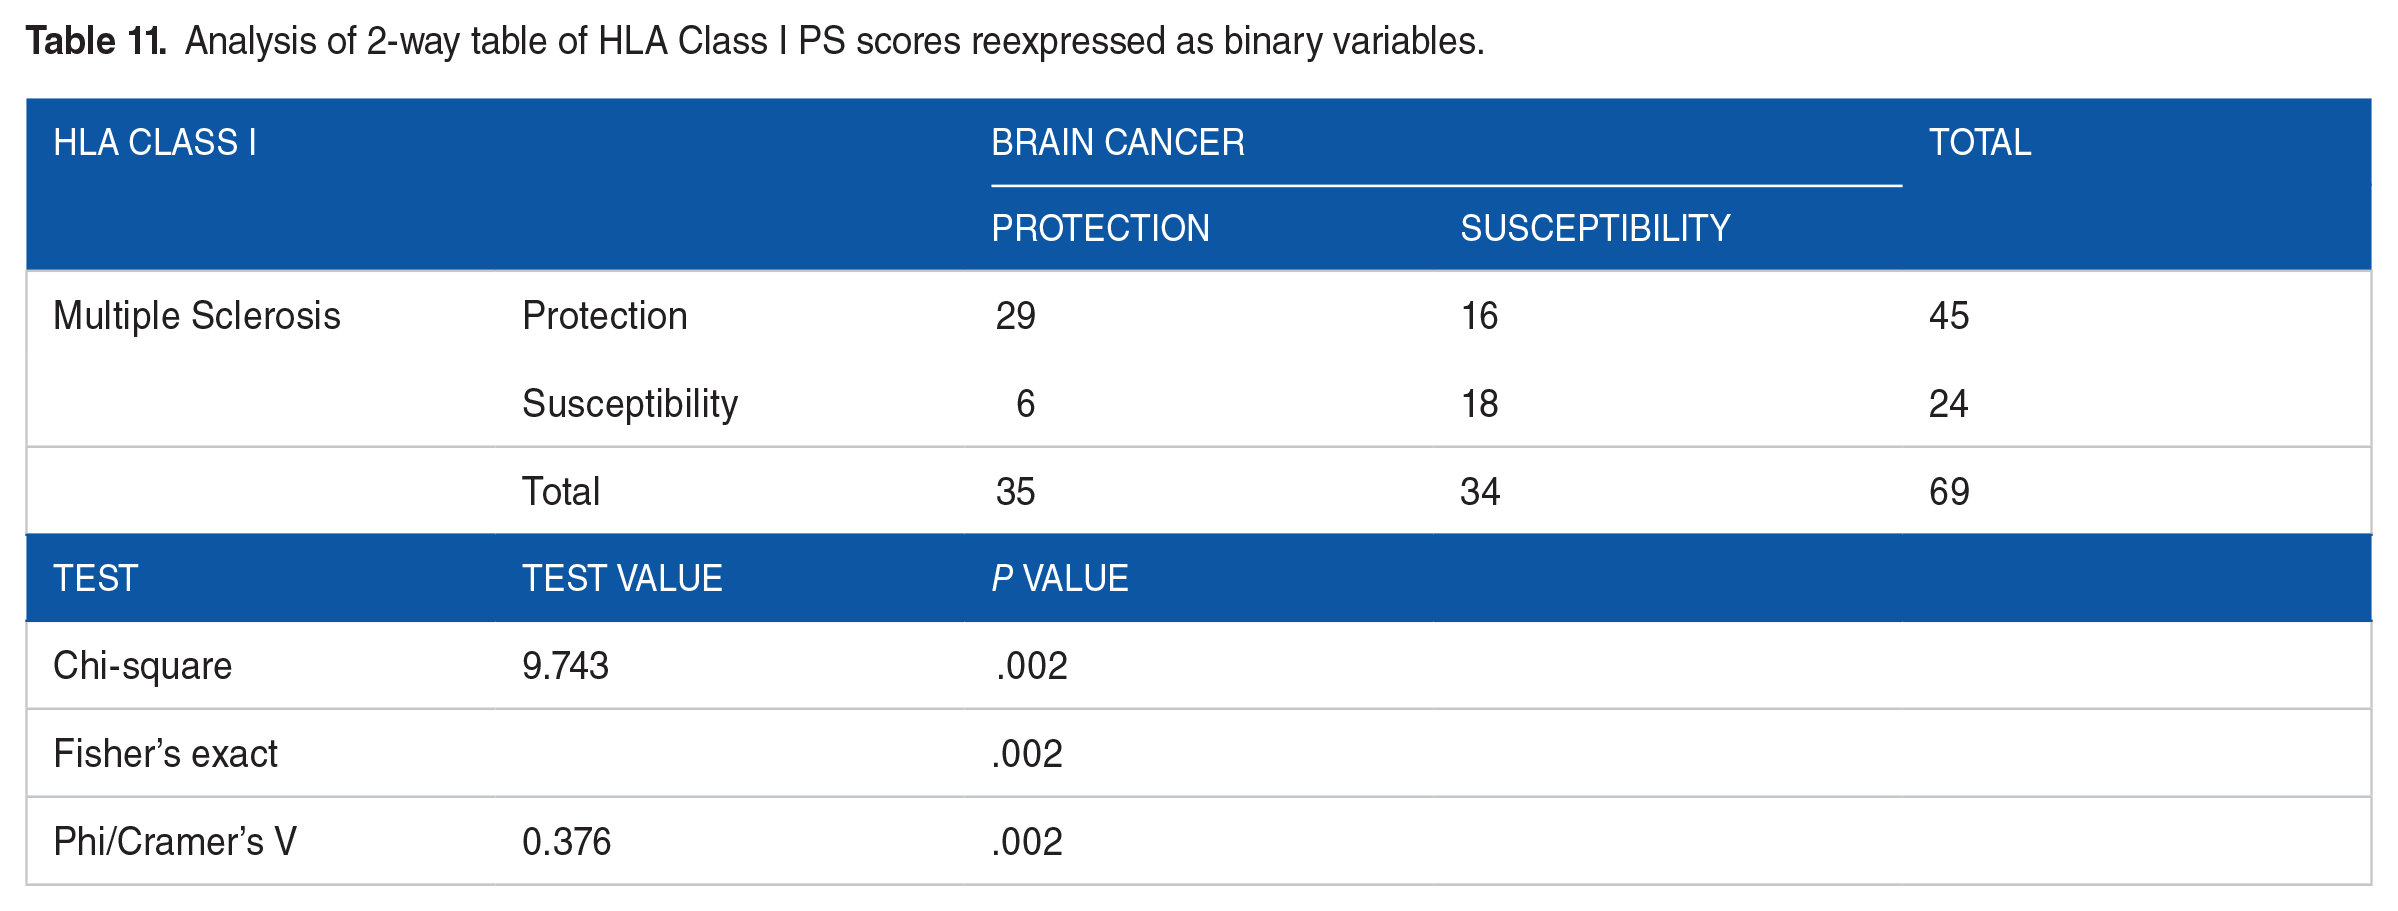
MS and BC PScov scores were highly significantly and positively correlated (Figure 5; r = .752, P < .001, N = 127). This significant positive correlation held for both HLA Class I and II alleles (Table 8), and all 6 HLA genes (Table 9). A similarly positive association was observed with respect to the protection/susceptibility proportions, as shown in Tables 10 to 14. It can be seen that (a) all associations were positive, as indicated by the positive Phi/Cramer’s V measure, and (b) associations were statistically significant for the whole set of 127 alleles (Table 10), and the sets for Class I (Table 11), Class II (Table 12), Class I gene A (Table 13), and Class II genes DQB1 and DRB1 (Table 14). The strongest association was observed for Class II and gene DRB1.

BC PScov scores are plotted against MS PScov scores. N = 127 HLA alleles. See text for details.
Association between MS PScov and BC PScov scores for HLA Class I and II. Correlation is Pearson correlation coefficient.

Association between MS PScov and BC PScov scores for HLA Class I and II genes. Correlation is Pearson correlation coefficient.
Analysis of 2-way table of all PS scores reexpressed as binary variables.

Analysis of 2-way table of HLA Class I PS scores reexpressed as binary variables.
Analysis of 2-way table of HLA Class II PS scores reexpressed as binary variables.

Analysis of 2-way table of HLA Class I genes PS score reexpressed as binary variables.

Analysis of 2-way table of HLA Class II genes PS scores reexpressed as binary variables.

Application to individuals
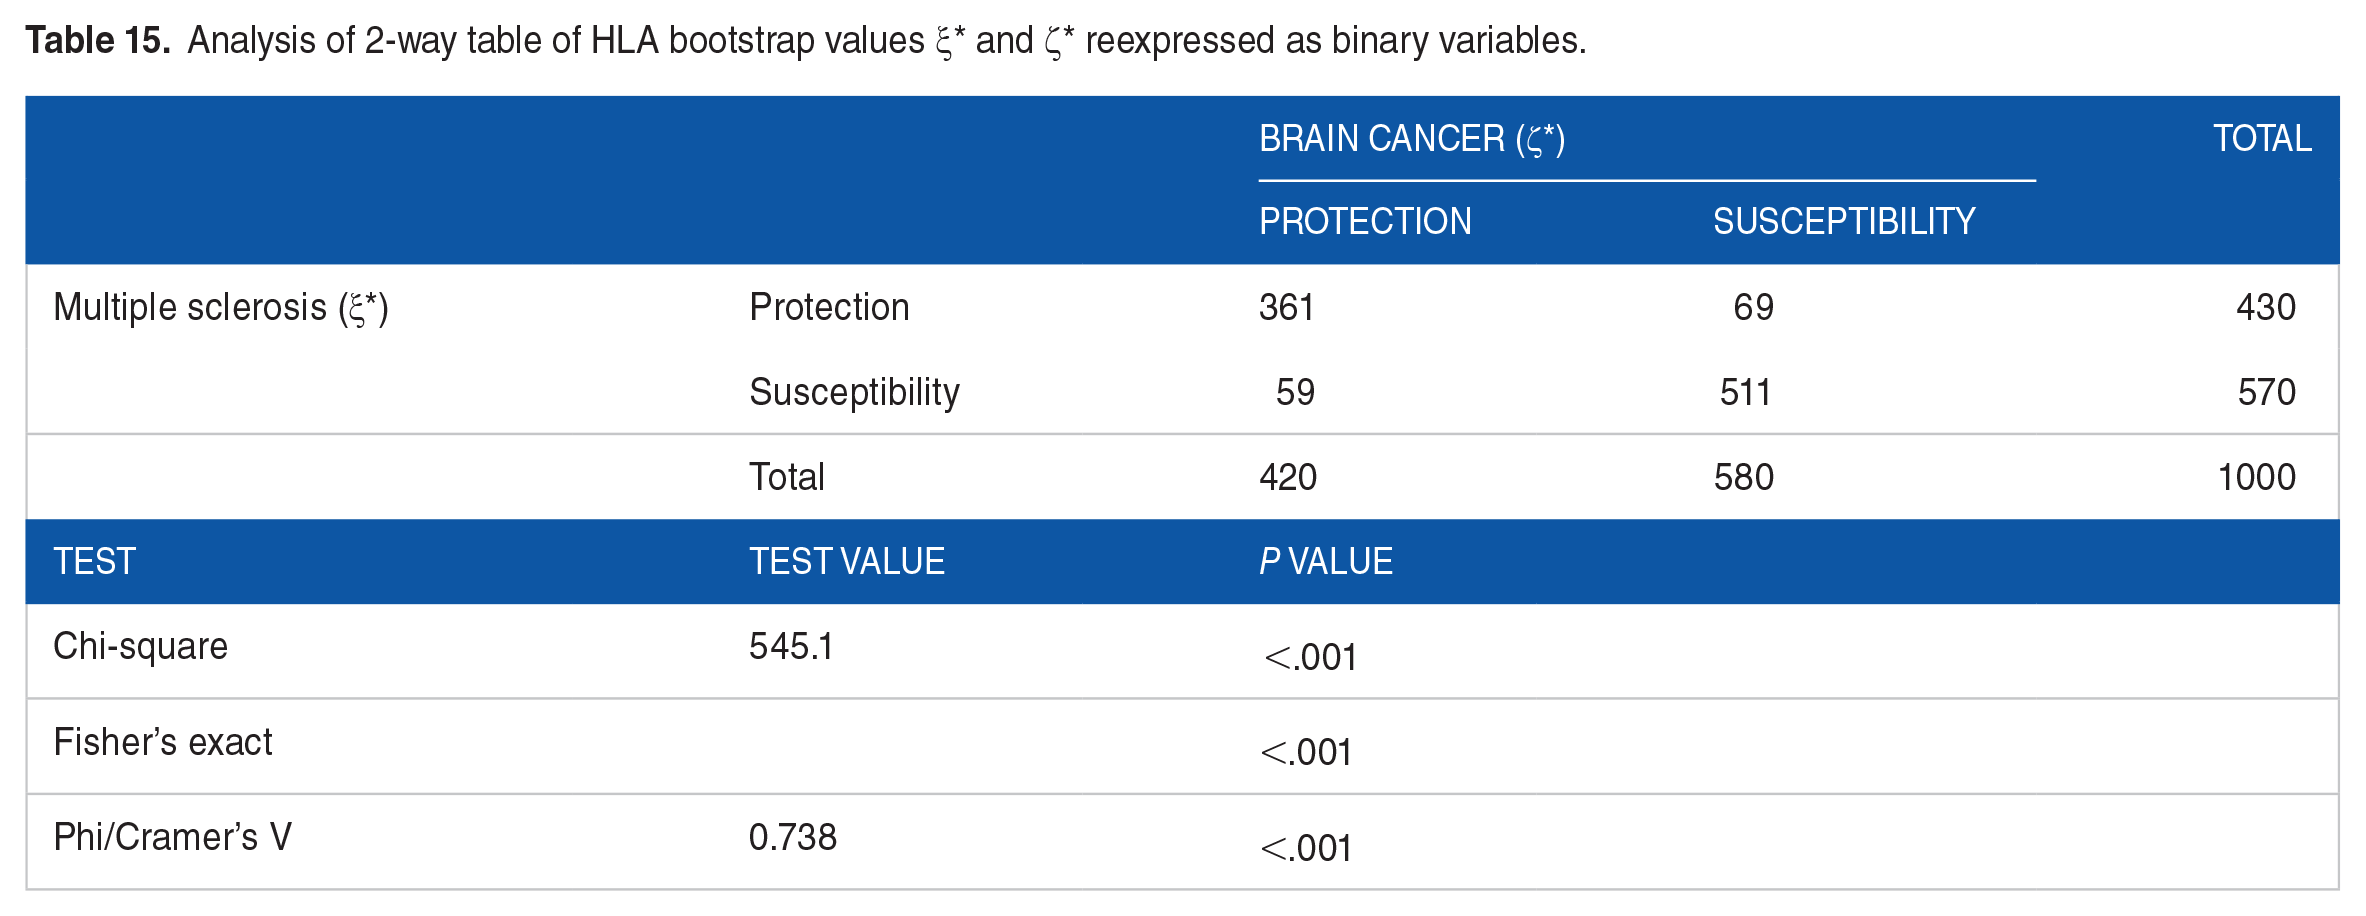
In this analysis, we generated 1000 bootstrap values of averages of MS and BC PScov scores, ξ* and ζ*, respectively, by averaging 12 PS scores, 2 per gene, randomly selected. This is a more realistic assessment of HLA protection/susceptibility for MS and BC, since an individual carries 12 HLA alleles (2 × 6 genes), each with their own PScov score. The frequency distributions of ξ* and ζ* are shown in Figure 6A and B, respectively. We found the following. (a) There was a statistically significant bias in both distributions toward susceptibility scores (only 42% protective ξ* and 43% ζ*; P < .001, Wilson score test for single proportion, against the null hypothesis of 50%). Similarly, (b) there was a significant bias toward susceptibility of the PScov score itself (mean ± SEM: ξ* 0.0346 ± 0.0047; ζ* 0.0287 ± 0.0042; P < .001, one sample t-test against the null hypothesis that mean is zero). (c) The variance of the ξ* distribution was 1.3x higher than that of ζ* (P < .001, Levene’s test for equality of variances). (d) The distributions of ξ* and ζ* did not differ significantly (P = .164, Kolmogorov-Smirnov test). (e) Paired per allele, ξ* was significantly higher than ζ*, although the difference was small (0.00594 ± 0.0021, P = .004, paired t-test). (f) The boxplots of the ξ* and ζ* distributions (Figure 7A and B) are remarkably similar, with the exact same number of protective and susceptibility outliers, the latter outnumbering the former by 8:1. (g) ξ* and ζ* were strongly, highly significantly and positively correlated (Figure 8; r = .900, P < .001, N = 1000). Similarly, their PScov counts, reexpressed as binary variables, were highly significantly and positively associated (Table 15).

Frequency distributions of MS ξ* (A) and BC ζ* (B) bootstrap values. N = 1000 values per distribution. See text for details.

Boxplots of the distributions of MS ξ* (A) and BC ζ* (B) PScov scores shown in Figure 6. See text for details.

BC ζ* is plotted against MS ξ*. N = 1000 bootstrap values.
Analysis of 2-way table of HLA bootstrap values ξ* and ζ* reexpressed as binary variables.
Discussion
Separate lines of research have documented increased risk of brain cancer in MS patients and have implicated HLA in protection or susceptibility for each condition. Here we evaluated the association between HLA profiles of MS and brain cancer to assess a possible role of shared immunogenetic influence on disease risks. We found that the immunogenetic profiles of MS and brain cancer were highly correlated overall and across all 6 HLA genes with the strongest association observed for DRB1 followed by DQB1, and HLA-A. These findings suggest not only that certain alleles may contribute to risk of both conditions but also that certain alleles confer protection against both conditions, both in terms of population prevalence and individual risk. The findings are discussed in light of the role of HLA in the immune system response to foreign antigens.
Multiple sclerosis and brain cancer immunogenetic overlap
The current study documented robust similarities in both HLA risk and protection for MS and brain cancer, especially related to Class II HLA-DRB1. Prior research has found that the highest susceptibility for MS is associated with the HLA-DRB1 gene. 15 In particular, DRB1*15:01is widely linked to MS risk 14 ; notably, DRB1*15:01 has also been linked to brain cancer.33,37 In our study, we similarly found strong associations between DRB1*15:01 and risk of both MS (MS PScov = 1.054) and brain cancer (BC PScov = 0.962). As shown in Tables 4 to 7, it can be seen that several other alleles also exhibited strong positive associations with both MS and brain cancer prevalences including A*03:01, DPB1*04:01, DQB1*06:02, and DRB1*04:01. Some of these associations appear to be novel; however, A*03:01 has previously been implicated in MS, 45 independent of linkage disequilibrium between DRB1*15:01 and-DQB1*06:02, 46 and DQB1*06 has been implicated in brain cancer risk. 32 Of note, the present finding that DQB1*06:02 was highly associated with both MS and brain cancer risk but DQB1*06:01 was not speaks to the importance of high-resolution (2-field) genotyping to more clearly identify HLA-disease associations that may be masked by allele group-level analyses. In addition to mutual risk alleles, several alleles were negatively associated with both MS and brain cancer prevalence and are considered mutually protective including DQB1*03:01 and DRB1*07:01. Previous research has documented protective effects of DRB1*07 on glioma 37 and MS. 47 DRB1*07:01 has also been found to protect against autoimmune conditions including Graves disease,48,49 rheumatoid arthritis, 50 and psoriatic arthritis. 51 We are not aware of prior studies documenting protective effects of DQB1*03:01 on MS or brain cancer; however, prior studies have reported protective effects of DQB1*03:01 on neurological syndromes 52 and Type I diabetes. 53 Taken together, the present findings highlight shared immunogenetic profiles for MS and brain cancer that extend beyond the well-established associations with DRB1 to include mutual robust associations with several HLA genes.
Implications for individuals
A major outcome of this study was the derivation of a unique, continuously-varying measure assessing the protection/susceptibility of an individual to multiple sclerosis (ξ) or brain cancer (ζ), based on their specific genetic HLA makeup. The allele-based MS-HLA and BC-HLA PScov scores provided the building blocks of ξ or ζ, which is the average of the 12 PScov scores of the HLA alleles carried by an individual (equations (2) and (3)). We called this approach the “crowdfunding” nature of HLA contribution to disease, 54 based on the following considerations: (1) the HLA region is the most polymorphic of the entire human genome, (2) every individual possesses 12 HLA alleles, and (3) each HLA allele may differ in terms of the direction and magnitude of its association with a given disease, as captured by the PScov score. Consequently, rather than focusing on “unique” contribution of specific alleles on disease susceptibility and protection, the primary emphasis of our crowdfunding approach is on the combined effects of relatively small contributions of individual alleles which, as a set, will contribute to overall protection/susceptibility of the disease at hand in individuals and populations. This approach is more realistic (given that individuals carry 12 HLA alleles) and different from traditional attempts to identify specific alleles in HLA-disease associations. 55 Actually, the effects of such alleles, when found, would be embedded and integrated with those of other alleles co-existing in the particular individual. This situation may explain why alleles with potentially strong effects themselves are not commonly found, since any HLA-disease association would be always based on contributions by the 12 classical HLA alleles, and of other alleles of non-classical genes (HLA-E, -G, -F), as they may be present in some individuals.
Immunogenetics and the role of viruses in multiple sclerosis and brain cancer
Considering the role of HLA in foreign antigen elimination, the highly significant correlation between immunogenetic profiles of MS and brain cancer supports an influence of exposure to foreign antigens in both conditions. Indeed, several common viruses including human herpes viruses such as Epstein-Barr virus and cytomegalovirus have been implicated in both MS and brain cancer although findings have been mixed.56,57 Like human herpes viruses, infection with John Cunningham virus (JCV) is nearly ubiquitous, 58 and JCV similarly persists in a latent state detectable in normal human brain tissue. 59 While JCV has been primarily associated with progressive multifocal leukoencephalopathy, it has also been implicated in MS 60 and in complications related to immunosuppressive treatment for MS,61,62 as well as in several neoplasms63,64 including brain cancer.64,65 Moreover, JCV DNA has been found in MS plaques and in tumor cells of a patient with concurrent MS and brain cancer. 66 Our findings concur with previous literature regarding a possible common viral contribution to MS and brain cancer and suggest their association may be partially mediated by similar immunogenetic effects. Nonetheless, definitive identification of specific virus(es) involved in both conditions remains to be determined. HLA binding and elimination of viral antigens that have been linked to MS and brain cancer is an interesting avenue for future investigation, particularly in light of mixed findings from studies evaluating effects of anti-viral therapies and preventative vaccines on both conditions.56,57
Increased risk of brain cancer in MS patients has been partially attributed to incidental findings due to increased frequency of brain imaging in MS patients. 9 While possible, our study documenting high correlations between the immunogenetic profiles of MS and brain cancer suggests an alternative explanation based on the human immune response to non-self antigens such as viruses and cancer neoantigens. Furthermore, the present findings identify HLA alleles that are mutually protective against both conditions, mutually susceptible, or in show discordant associations with MS and brain cancer. In the future, these findings may be leveraged to develop personalized precision adjunctive treatments for MS, brain cancer, and other immune-involved conditions based on an individual’s HLA composition. 67
Conclusion and Limitations
The present study provides a novel perspective regarding the link between MS and brain cancer; however, several limitations must be considered. First, HLA-disease associations may differ for different forms of MS and/or different types of brain cancers. Indeed, a recent study documented HLA influence on viral antigen response in glioma subtypes. 68 Here, we evaluated the immunogenetic overlap of MS and brain cancers as a whole and are unable to draw any conclusions about immunogenetic overlap between MS and brain cancer subtypes. Second, the findings are based on population-level HLA-disease associations. We utilized those population-based findings to estimate individual-level HLA protection and susceptibility for MS and brain cancer; however, those estimates remain to be confirmed. Further, since HLA varies across populations,38,39 additional studies are warranted to determine whether the present findings extend beyond Continental Western Europe to other regions. Finally, another limitation of the study is that alleles of genes DRB3, DRB4 and DRB5 were not used since they do not occur in all individuals.
Footnotes
Funding:
The author(s) disclosed receipt of the following financial support for the research, authorship, and/or publication of this article: Partial funding for this study was provided by the University of Minnesota (the Anita Kunin Chair in Women’s Healthy Brain Aging, the Brain and Genomics Fund, the McKnight Presidential Chair of Cognitive Neuroscience, and the American Legion Brain Sciences Chair) and the U.S. Department of Veterans Affairs. The sponsors had no role in the current study design, analysis or interpretation, or in the writing of this paper. The contents do not represent the views of the U.S. Department of Veterans Affairs or the United States Government.
Declaration of conflicting interests:
The author(s) declared no potential conflicts of interest with respect to the research, authorship, and/or publication of this article.
Abbreviations
BC, Brain cancer
HLA, human leukocyte antigen
MS, Multiple sclerosis
Author Contributions
LMJ extracted disease prevalence data. APG extracted allele frequencies and performed data analysis. LMJ and APG wrote and reviewed the paper.
Ethical Approval
This article does not contain any studies with human participants performed by any of the authors.
Data Availability
All data used were retrieved from freely accessible websites, as mentioned in Methods, and, as such, are publicly and freely available. Specifically: