
Abstract
Cardiovascular diseases continue to be the leading cause of mortality and morbidity in the world. The prevalence has been changing with time in the developing and developed world. The higher prevalence in the South Asian population compared to the rest of the world has been reviewed with multiple theories, ranging from genetic predisposition, higher prevalence of diabetes mellitus, dietary patterns, and dyslipidemia with low high-density lipoprotein. The traditional risk scores are still underestimating cardiovascular risk in the large young population of the Indian subcontinent. There is a need to risk-stratify at an early age to start preventive measures early to save lives. The development of risk scores like Framingham Risk Score, QRISK, and ASCVD has been reclassified by adding the CT coronary calcium score. Further enhancing the risk by adding polygenic risk score for coronary artery disease and cardiometabolic disorders will guide us to start preventive measures early in life.
Introduction
Cardiovascular diseases, such as ischemic heart disease and cerebrovascular disease, cause around 17.7 million deaths. 1 India accounts for one-fifth of the deaths accounted worldwide, especially in the younger age group. The Global Burden of Disease study shows an age-standardized cardiovascular disease (CVD) death rate of 272 per 100,000 population in India, which is much higher than the global average of 235. Cardiovascular death occurs in Indians a decade earlier than in the Western population. 2 This brings to the discussion for the need of early risk stratification and early preventive measures in Indians. Particular causes of concern in CVD are early age of onset, rapid progression, and high mortality rate. The advancement in genetic testing and large genome-wide association studies (GWAS) has shown many hereditary pathogenic variants predisposing to CVDs that run in families. Since the Human Genome Project facilitated population-based comprehensive genetic profiling at decreasing costs, GWAS from such endeavors continue to show multifactorial causal mechanisms for CVDs.
What is a Polygenic Risk Score?
A polygenic risk score (PRS) is a single value that estimates an individual’s genetic predisposition or risk factor for a disease based on the known presence of the causative single-nucleotide variants (SNVs). PRSs provide information that can be used to enhance or guide, but not replace, the risk prediction models. It is calculated by adding up an individual’s risk alleles and weighting them by the effect sizes of those alleles found in the large dataset of the GWAS. PRSs are also called polygenic indexes (PGIs), genome-wide scores, or genetic risk scores. PRSs have been developed to predict an individual’s genetic predisposition to many diseases like coronary artery disease (CAD), arrhythmias like atrial fibrillation (AF), sudden cardiac deaths, breast cancer, type 1 and type 2 diabetes, prostate cancer, Parkinson’s disease, Alzheimer’s disease, major depressive disorder, and schizophrenia.
The present clinical models of disease prediction, like the Framingham Risk Score 3 and more, are shown in Table 1. 4 The risk predictive scores have overestimated the clinical setting over time 3 ; there is a gap in prediction in the expanding population. PRS in CVD is gaining importance due to the unexplained early-onset CAD in many parts of the world. Addition of genetic testing to conventional risk prediction models redefines risk scores, potentially much earlier in life, and works toward earlier risk reduction advices. 5 Having any of the parents with a history of premature CAD is associated with higher odds of developing CVD, independent of regular clinical risk factors. 6 In comparing monozygotic twins with dizygotic twins, it was shown that variation in the development of CAD, 7 AF, 8 and diabetes mellitus9, 10 is attributed to common genetic variations (Table 1).
Key Characteristics of the Most Widely Used Risk Prediction Equations.
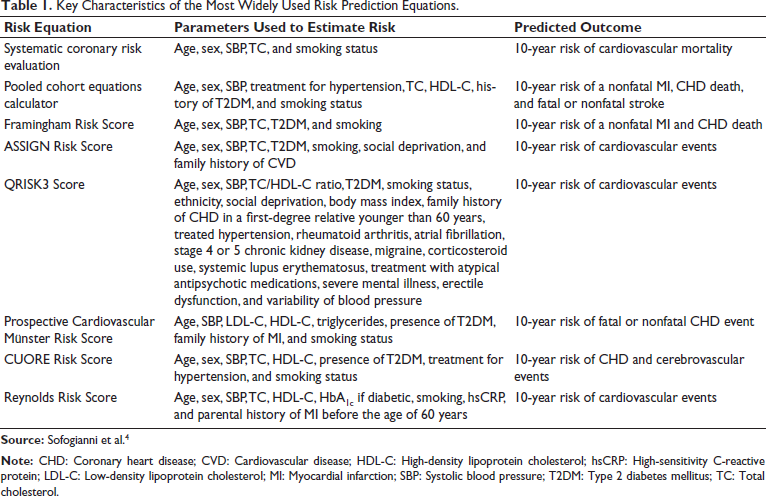
Early-onset myocardial infarction can be caused by some monogenic risk variants in the genes encoding the proprotein convertase subtilisin/kexin type 9 (PCSK9), apolipoprotein B (APOB), and low-density lipoprotein receptor (LDL-R), causing severe hypercholesterolemia; examples of causes of familial hyperlipidemias.11, 12 The examples of monogenic risk variants include variants that cause different diseases, leading to cardiovascular disorders, like glucokinase (GCK) for diabetes, 13 KCNQ1 for AF, 14 and F5 for venous thromboembolic disease. 15
Building a PRS requires having large datasets, typically from GWAS. There will be many SNVs across the genome in the causative leads over time. The list of their effect size is measured by quantifying the association for the disease. Then the PRSs are prepared from the weighted sum of the risk conferred by multiple disease-associated SNVs across the genome. GWAS has shown that many SNVs scattered across the genome are associated with cardiovascular disorders. Each of these variants individually has only a small risk, but collectively, they account for substantial CVD risk with a weighted average.16, 17 The weighted average of risk score prediction will focus on CAD risk and offer provisional guidance to healthcare professionals and patients on the use of PRSs in CVD risk assessment and risk reduction.
Coronary Artery Disease
Hereditary genetic inheritance, a major risk factor for early-onset CAD, could not be quantified. With evolving data on GWAS, the monogenic, polygenic inheritance is better understood and quantified to refine the risk score. The proportion of phenotype explained by the additive sum of genetic factors is around 50%. 18 GWAS of CAD in the general population has shown that common genetic variation also influences the risk for CAD. 19 Increasingly large CAD GWAS continues to identify novel genomic loci; 167 separate genomic loci have been identified to be significantly associated with CAD to date. 20 Systematic pleiotropy analyses indicate that the majority of these loci do not influence CAD risk through well-recognized risk factors like diabetes mellitus, systemic hypertension, dyslipidemia, smoking, or obesity. 21
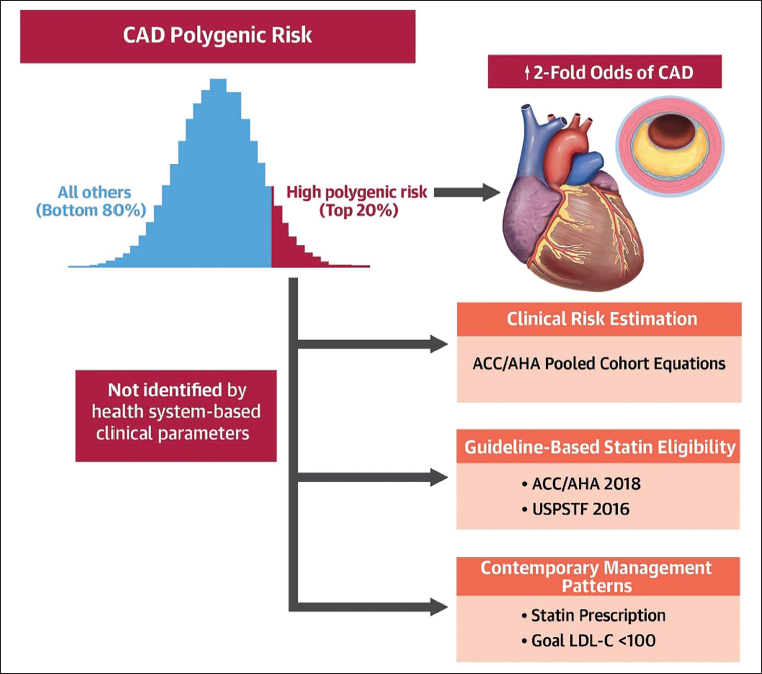
Risk scores are predictors of subclinical coronary atherosclerosis and independently prognosticate coronary vascular events (around 1.5-fold of the CAD PRS; Figure 1).22–24 The conventional risk scores do not detect high-risk CAD PRSs. The top fifth percentile of CAD PRS is associated with an increase of LDL-C by 8 mg/dL, which would have been classified as low risk traditionally.25, 26 The highest odds prediction of CAD, that is, threefold risk, is at the top 95th percentile (1 in 20) of CAD PRS, which is similar to that associated with familial hyperlipidemia without accompanying severe hypercholesterolemia.16, 25 Among the individuals with established atherosclerotic CAD, PRS was independently associated with higher major adverse cardiovascular events (MACE) (1.2-fold higher odds). 27 In the Atherosclerosis Risk in Communities (ARIC) study and Multi-Ethnic Study of Atherosclerosis (MESA) study, PRS addition has shown little improvement in the prediction of MACE. 28 More recent studies have shown better performance by using statistical approaches and validation in larger cohorts. 29 It is likely that the younger age group is going to benefit more among all the age groups. For example, the net relative index reached a peak of 15.4% (95% CI, 11.6%-19.3%) for younger subgroups (Figure 1).
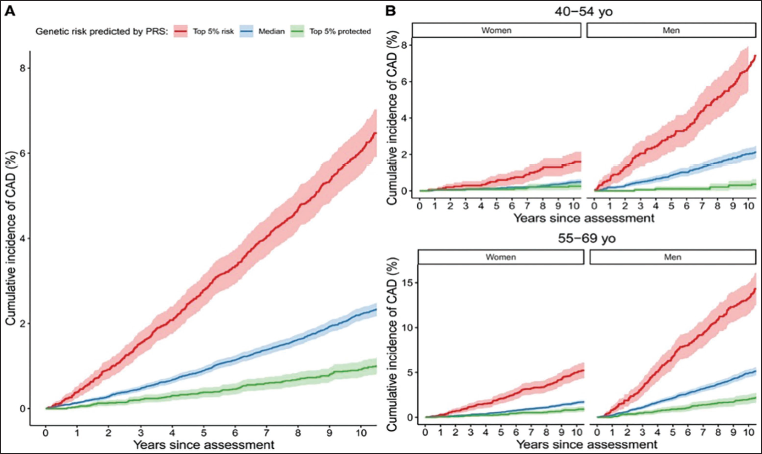
The addition of CT coronary calcium (CAC) score into the risk assessment for CAD was associated with significant improvement in reclassification for the prediction of atherosclerotic cardiovascular events. The results of various studies support the utility of CAC scoring as an adjunct to risk-enhancing factor assessment to more accurately classify individuals with an intermediate risk of atherosclerotic cardiovascular disease (ASCVD) who might benefit from early statin therapy. 30 The UK Biobank study’s integrated risk tool (IRT), which combined PRS with established risk tools (American Heart Association/American College of Cardiology Pooled Cohort Equations (AHA/AACC PCE) or UK QRISK3), showed that the PRS had superior predictive power for CAD events when compared with other published PRSs. When combined with PCE in the IRT, it has superior predictive accuracy. Overall net reclassification improvement (NRI) for the IRT was 5.9% (95% CI, 4.7-7.0). When individuals were stratified into age-by-sex subgroups, the improvement was 8.3%-15.4%, and was larger for all subgroups of men in the 40-54 years age group (15.4% (95% CI, 11.6-19.3); Figure 2). Comparable results were found using a different risk tool (QRISK3 tool) with a broader definition for CVD. 24 Use of the IRT is estimated to help avoid up to 12,000 deaths in the USA and 50,000 deaths in India over 5 years.
Cumulative Incidence of Coronary Artery Disease (CAD) in the UK Biobank Study. (A) All of the Groups. (B) The Four Subgroups According to Age (45-54 Years and 55-69 Years) and Sex. Individuals are Further Stratified by Polygenic Risk Score (PRS)—Defined Risk in the Top 5% of the PRS (Red), the Median 40%-60% Distribution of Risk (Blue), and the Bottom 5% of Risk Distribution (Green). 24
Observational analysis of epidemiological studies or post hoc analyses of randomized controlled trials for CAD prevention have yielded better strategies to reduce CAD risk in the setting of a high CAD PRS. Because a CAD PRS is largely additive of nongenetic factors, adherence to a healthful diet mitigates CAD risk regardless of CAD PRS; however, given the worse prognosis, the absolute risk reduction from a healthful diet among those with a high CAD PRS may be greater than for those without a high CAD PRS.31, 32
A personal communication of the PRS changed the behavior of the high-risk group after 1.5 years. 20.8% of individuals in the high-risk group had seen a doctor, 12.4% reported weight loss, 14.2% of them quit smoking, and 15.4% had signed up for health coaching online. These suggest positive outcomes with early preventive lifestyle management for healthy living. A total of 42.6% of the high-risk group had made one or more health behavioral changes against 33.5% people at low/average risk. Higher baseline risk predicted a favorable change with early intervention (P = .001), with both high clinical risk (P = .001) and genomic risk (P = .003) contributing independently. 33
In a study-level meta-analysis across the WOSCOPS, ASCOT, and JUPITER primary prevention, relative risk reduction in those at high genetic risk was 46% versus 26% in all others (P = .05). Across all three studies, the absolute risk reduction with statin therapy was 3.6% (95% CI 2.0-5.1) among those in the high genetic risk group and 1.3% (95% CI 0.6-1.9) in all others. For every 1-SD increase in the PRS, there is a 1.32-fold greater likelihood of having coronary artery calcification and a 9.7% higher (95% CI 2.2-17.8) carotid plaque burden. Those at high genetic risk have a greater burden of subclinical atherosclerosis; this high-risk group gets greater relative and absolute benefit from statin therapy to prevent coronary heart disease events.34, 35
There was greater benefit from PCSK9 monoclonal antibodies among those with high PRS risk score versus low CAD PRS (37% vs. 13%; P = .04) in the ODYSSEY OUTCOMES trial in patients with established ASCVD on statins. 27 The preventive benefits of healthy lifestyle habits have been shown to reduce disease risk across all groups of PRS risk, although the greatest reductions are seen with the highest PRS risk. 36 Asymptomatic middle-aged adults at borderline/intermediate risk by conventional clinical risk factors, who were reclassified to high risk with a high CAD PRS, have been shown to benefit with statin therapy. 26 Among asymptomatic younger adults, a high CAD PRS may prompt more intensive earlier efforts for preventive lifestyle modification and potentially earlier lipid-lowering therapies initiation to reduce the high lifetime risk for CAD. 37
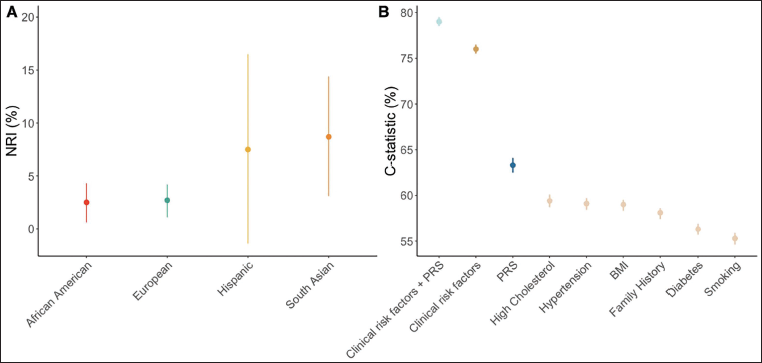
The integration of PRS for CAD into clinical practice is likely to improve current cardiovascular risk prediction tools. Currently, the AHA, ACC, and other international organizations recommend 10-year cardiovascular risk determination for all adult patients aged 40-75 years with the AHA/ACC ASCVD risk calculator. 38 The addition of PRS to the calculator significantly improves prediction for cardiovascular events (Figure 3).17, 23, 24, 26, 31 This enhanced prediction is independent of the conventional clinical risk factors (Figure 1). Risk is detectable before the emergence of clinical risk factors, and is appreciable across a spectrum of ages, sexes, and, increasingly, ancestries and ethnicities.22, 39–41 As the conventional risk factor tools are missing participants at the high PRS risk, it is cost-effective to include PRS in the AHA/ACC ASCVD risk calculator, which significantly improves prediction, to suggest early targeted measures. 42
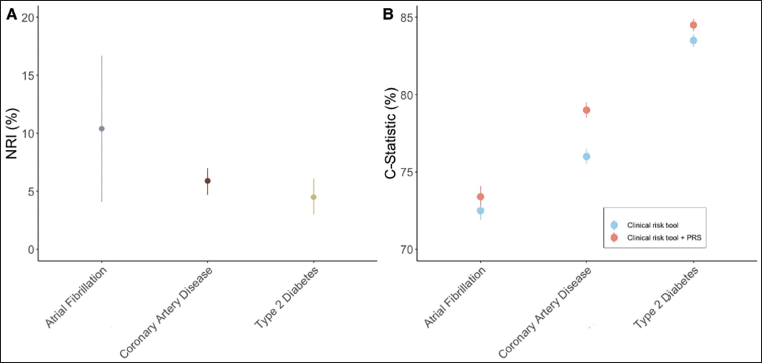
Predictive Accuracy of Polygenic Risk Score (PRS) Combined With Other Clinical Risk Tools and Compared to Traditional Risk Factors. (A) Net Reclassification Index (NRI). Comparison of Clinical Risk Tools With and Without the Integration of PRS.17, 24 The Clinical Risk Tool Used for Atrial Fibrillation was CHARGE-AF (Cohorts for Heart and Aging Research in Genomic Epidemiology Model for Atrial Fibrillation) with a Risk Threshold >5% Over 5 Years. Variables Included in CHARGE-AF were Age, Height, Weight, Systolic Blood Pressure, Diastolic Blood Pressure, Smoking Status, Blood Pressure-lowering Medication, Diabetes, Heart Failure, and History of Myocardial Infarction. The Clinical Tool for Coronary Artery Disease was the American Heart Association/American College of Cardiology Pooled Cohort Equation with a 7.5% Risk Threshold Over 10 Years and Included the Following Variables: Age, Diabetes, Sex, Race, Smoking, Total Cholesterol, High-density Lipoprotein (HDL), Systolic Blood Pressure, and Treatment for Hypertension. The Clinical Tool for Type 2 Diabetes was the American Diabetes Association Risk Score, Which Had a 33% Risk Threshold Over 10 Years and Included the Following Variables: Age, Sex, Body Mass Index, History of Stroke or Coronary Heart Disease, Parental History of Diabetes, Systolic Blood Pressure, Diastolic Blood Pressure, HDL, and Triglycerides. All Differences are Statistically Significant. (B). Comparison of C Statistics Between Clinical Risk Scores and a Risk Tool With a PRS Integrated into the Clinical Risk Tool. All Differences are Statistically Significant.17, 24
A new GPSCAD reference distribution was built using whole-genome sequencing from 1,522 Indian individuals. The GPSCAD, containing 6,630,150 common DNA variants, had an odds ratio (OR) per standard deviation of 1.58 in South Asian UK Biobank participants and 1.60 in the Bangladeshi study (P < .001 for each). Compared to the middle quartile, risk for CAD was more pronounced for those in the top 5th percentile of the GPSCAD distribution—ORs of 4.16, 2.46, and 3.22 in the South Asian UK Biobank, Bangladeshi, and Indian studies, respectively (P < .05 for each). 43
Interpretation of Polygenic Risk Score
Genetic research over the past decade has realized that our risk for many common conditions, such as heart disease and diabetes, is not influenced by just one gene but by many. Multiple genes interplay with the proteins secreted by them in tandem to influence the risk for developing CAD. Many small-effect genetic variations contribute to a person’s susceptibility to CAD. PRS prediction quantifies the contributing effects into a score and estimates whether the tested individual is at a high or moderate risk of developing atherosclerotic disease. It is a screening test that helps estimate the genetic predisposition of the individual. The risk is calculated from more than 6 million genetic markers 28 implicated in the disease and is given as a validated PRS. The usual turnaround time is 2 weeks for these results. The score indicates if the individual is at a high or moderate genetic risk. It is reported as AVERAGE RISK—You are at a not high genetic risk toward coronary events, MODERATE RISK—You are at a moderate genetic risk (1.5 times) toward CAD than an average-risk counterpart, HIGH RISK PRS—You are at a higher genetic risk (2 times) of getting CAD than an average-risk counterpart (Figure 4). 26
The PRS is also developed for the risk of type 2 diabetes mellitus, AF, venous thromboembolism, hypercholesterolemia, and pharmacogenomics.
Take Home Message
What is PRS? PRS is a single score reflecting the cumulative weighted risk of individual genetic variations for a set of traits that are prone to develop atherosclerotic disease. These individual genetic variants confer an incrementally small disease risk, but summated, they are predictive of many CVDs.
Polygenic versus monogenic risk variants: Monogenic risk variants are typically single, protein-truncating variants conferring a relatively large risk of disease. Examples of monogenic risk variants for CVD include LDL-R for familial hypercholesterolemia (FH), GCK for diabetes, 13 KCNQ1 for AF, 14 and F5 for venous thromboembolic disease. 15
Coronary artery disease: Among middle-aged adults, a CAD PRS adds more value to conventional risk factors and provides additional prognostic information for CAD. The clinical significance of this improvement is contentious.17, 23, 24, 31 Observational evidence suggests that CAD PRS will have utility in guiding early interventions like pharmacological management (particularly for low-density lipoprotein cholesterol (LDL-C) lowering), attributable to increased estimated disease risk for better, healthier living. 27
There is evidence of predictive models for type II diabetes, AF, hypercholesterolemia, venous thromboembolism, and pharmacogenomics to guide gene-based therapies in the future.
Criteria for implementing PRS in cardiovascular clinical practice: Estimates of incremental efficacy and harm and logistical challenges are key aspects for healthcare systems to consider when evaluating PRS. There needs to be a better understanding by the clinicians and public awareness of the new technology, with its limitations.
PRS risk score to be an integral part of the investigation to risk-stratify and predict sudden cardiac deaths in the middle-aged population, which is of concern post-COVID pandemic. It can be ordered from genetic labs doing genome sequencing, order for PRS looking for specific nucleotide of significance as established by validated data.
Challenges and future directions: The addition of PRS to clinical risk tools consistently enhances the predictive ability. The lack of diversity of participant inclusion in biobanks, GWAS, and consequently PRSs is a major current limitation. The financial implication and insurance coverage for testing are going to decide the quantum of data to be produced in this big population.
Challenges and Future Directions
The new technology has limitations with the inclusion of only a fewer variants in the current state-of-the-art polygenic risk models. 11 The advantages of including rare variants in PRS models have yet to be investigated. The number of discoveries of this type of variant is limited by a lack of power for CVDs. There may be new variants discovered with low-frequency variants that confer a high risk of disease in the future with large datasets. Future studies should prioritize data from whole-genome sequencing to facilitate PRS models incorporating common and rare variants, such as a full allelic spectrum of PRS. In the absence of whole-genome data on patients for whom a PRS is to be calculated, genotyping array data can be imputed to whole-genome sequencing data. There is a difference of variants in different population groups. There is insufficient data generation from the Indian population which is unique for early-onset CAD. There is a need for Biobank-based data of CAD patients like the UK BIOBANK. There is a need for randomized trials with earlier identification of high-risk individuals and their follow-up with early intervention outcomes. The application of PRS in pediatric group is not validated yet and needs more studies. However, the clinical efficacy and cost-effectiveness of PRS in the Indian scenario are yet to be fully explored.
Footnotes
Acknowledgment
The author gratefully acknowledges the inspiration of his teachers and staff for their support in writing the review.
Declaration of Conflicting Interests
The author declared no potential conflicts of interest with respect to the research, authorship, and/or publication of this article.
Ethical Approval and Informed Consent
As the article is a review of published data only, consent from patients and ethics committee is not required.
Funding
The author received no financial support for the research, authorship, and/or publication of this article.