
Abstract
Objectives:
The accurate and precise measurement of low-density lipoprotein-cholesterol (LDL-C) is important in the assessment of atherosclerotic cardiovascular disease risk (ASCVD) in people with diabetes mellitus. This study is aimed at comparing directly measured LDL-C with Friedewald formula (FF)-calculated LDL-C (c-LDL-C) in people with type-2 diabetes.
Methods:
Fasting lipid profiles of 1905 people with type-2 diabetes, whose LDL-C was estimated by direct LDL assay, were chosen for the study. In the same group, LDL-C was calculated with FF. Correlation and agreement between these methods were analyzed at various strata of triglycerides (TGs). The possibility of misclassifying people at various levels of LDL-C targets proposed in literature was calculated.
Results:
The mean LDL-C levels were lower in the c-LDL-C group across various TG strata. A significant correlation was found between c-LDL-C and direct LDL-C for all the study samples (r = 0.948, P < .001) and across all TG strata. Analysis of agreement showed a positive bias for direct LDL-C which increased at higher strata of TGs. c-LDL-C underestimated ASCVD by misclassifying people at various LDL-C target levels.
Conclusion:
There is a difference between direct LDL-C and c-LDL-C values in people with diabetes and this may result in misclassifying ASCVD especially at lower levels of LDL-C and higher levels of TGs.
Keywords
Abbreviations
ASCVD: Atherosclerotic cardiovascular disease
c-LDL-C: Calculated-low-density lipoprotein-cholesterol
d-LDL-C: Direct-low-density lipoprotein-cholesterol
FF: Friedewald formula
HDL-C: High-density lipoprotein cholesterol
LDL-C: Low-density lipoprotein-cholesterol
PCSK9: Proprotein convertase subtilisin/kexin type 9
TC: Total cholesterol
TG: Triglyceride
VLDL: Very-low-density lipoprotein cholesterol
Introduction
Atherosclerotic cardiovascular disease (ASCVD) remains a major cause of morbidity and mortality in people with type-2 diabetes mellitus. 1 Randomized-controlled trials, Mendelian randomization studies, and epidemiological studies have shown a strong relationship between LDL-C levels and the risk of ASCVD.2, 3 The precise and accurate measurement of LDL-C is important for correctly and consistently classifying individuals at risk for ASCVD.
There are various methods for LDL-C estimation.4-6 The gold standard method of measurement is beta-quantification using ultracentrifugation.4, 6 However, this method is expensive, requires special equipment, and time-consuming, making it inconvenient for most routine clinical laboratories. LDL-C calculated (c-LDL-C) with Friedewald’s formula (FF) is commonly used by commercial laboratories for LDL-C estimation. However, this method suffers from several limitations such as the requirement for fasting samples and overestimation of very-low-density lipoprotein cholesterol (VLDL), thereby leading to underestimation of c-LDL-C. 6 FF is recommended only in the calculation of LDL if triglyceride (TG) levels are less than 400 mg/dL and not useful in type-III hyperlipidemia or dysbetalipoproteinemia. 6 Due to these limitations, many laboratories have adopted the estimation of LDL-C by homogeneous direct measurement which is amenable to automation. These assays can be done in non-fasting samples, samples with TG >400 mg/dL, and bypasses the imprecision of 3 measurements (total cholesterol, TGs, and HDL cholesterol) required for calculation. 6 Although a good correlation has been established in earlier studies between direct measurements of LDL-C (d-LDL-C) and c-LDL-C, change in the methodology of the test for a patient can lead to changes in attained LDL-C levels thereby leading to modification in lipid-lowering therapy.2, 7 Further, changes in absolute values of LDL-C can lead to changes in ASCVD risks estimated using risk calculators. 4
As our laboratory shifted from c-LDL-C to d-LDL-C measurements, we have noticed that several previously well-controlled people with type-2 diabetes required a modification of lipid-lowering therapy. In view of this, we conducted a study to assess the performance of a direct homogeneous method for measuring LDL-C and comparing it with the estimation of LDL-C levels using FF in people with type-2 diabetes.
Methods
Objectives
The objectives of the study was to compare the correlation between d-LDL-C in patients with type-2 diabetes against FF c-LDL-C, to calculate the correlation between d-LDL-C and c-LDL-C across various TG strata and to calculate the percentage of subjects who would maintain guideline-recommended targets of LDL-C while using d-LDL-C versus c-LDL-C. For the analysis, LDL-C and TG values were stratified into five levels, that is, LDL (<70; 70-99; 100-130; 131-160; and >160) and TG (<100, 101-150, 151-200, 200-250, 251-400).
Data Collection
We conducted a retrospective chart review on consecutive people with type-2 diabetes who have undergone fasting lipid profile between December 2018 and June 2019. We excluded people <18 years of age, non-fasting lipid profiles, and TG >400 mg/dL. Being a chart review of routine clinical care, ethics committee clearance was not applicable.
Lipoprotein Analysis
The samples were collected after 8 to 10 hours of overnight fast by withdrawing 3 mL of venous blood in a plain vial. The samples were centrifuged at 3000 rpm for 15 min to obtain serum and were analyzed for lipid profile on the same day. TC and TG levels were estimated by an enzymatic, colorimetric method (Roche Diagnostics, GmbH). HDL-C was measured by HDL-Cholesterol Gen 4 based on the homogeneous enzymatic colorimetric assay. All assays were done on the Cobas C111 Analyzer (Roche Diagnostics, GmbH). The d-LDL-C was determined by LDL-Cholesterol Gen 3 based on homogenous enzymatic colorimetric assay using Cobas c111 Analyzers (Roche Diagnostic, GmbH). The d-LDL determination using LDL Gen 3 has been standardized against beta quantification as set forth in the recommendation of LDL-cholesterol method certification protocol. The intermediate precision of the assay was 1.2% to 3.2% and the repeatability was 0.9% to 3%. 8
c-LDL-C was calculated using FF, that is, (TC – [HDL + TG/5]) and is based on two cholesterol determinations (total cholesterol and HDL-cholesterol) and one TG determination.
Statistical Analysis
Discreet data were analyzed and presented as numbers with mean ± standard deviation (SD). The analysis of concordance for the overall groups and at various strata of TG was done using Pearson’s correlation coefficient (r) and Scatter Plot (R software version 3.6.2, [December 12, 2019]). Bland-Altman graphical plots were used to analyze the degree of agreement between d-LDL-C and c-LDL-C. This plot provides a graphical comparison of the level of agreement between the two methods of assessment by plotting the difference between the two methods (d-LDC-C − c-LDL-C) versus the average of both ([d-LDC-C + c-LDL-C]/2). The degree of agreement is indicated by calculating the bias, estimated by the mean and SD of the differences. The paired t test was used to calculate the difference between groups. P values <.05 were considered significant.
Results
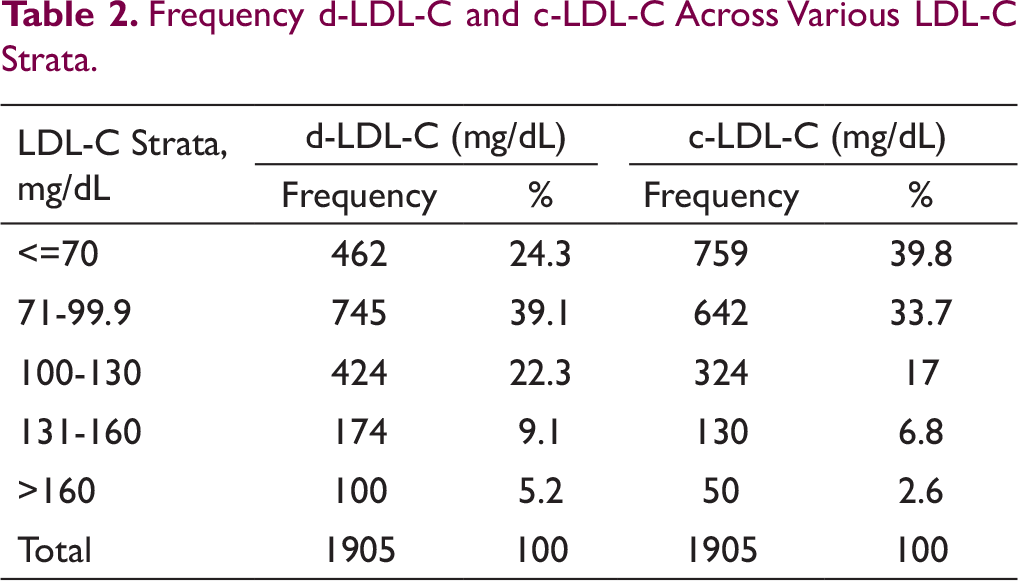
In our study,1905 samples of 1537 subjects were analyzed. The baseline characteristics of the study sample is shown in Table 1. The distribution of TC, TG, HDL-C, c-LDL-C, and d-LDL-C across various TG strata is shown in Supplementary Table 1. A higher frequency of samples had LDL value <70 mg/dL when c-LDL-C was used than when d-LDL-C was used (39.8% vs. 24.25%). In all other strata of LDL, the frequency was higher with d-LDL-C (Table 2).
Baseline Characteristics.
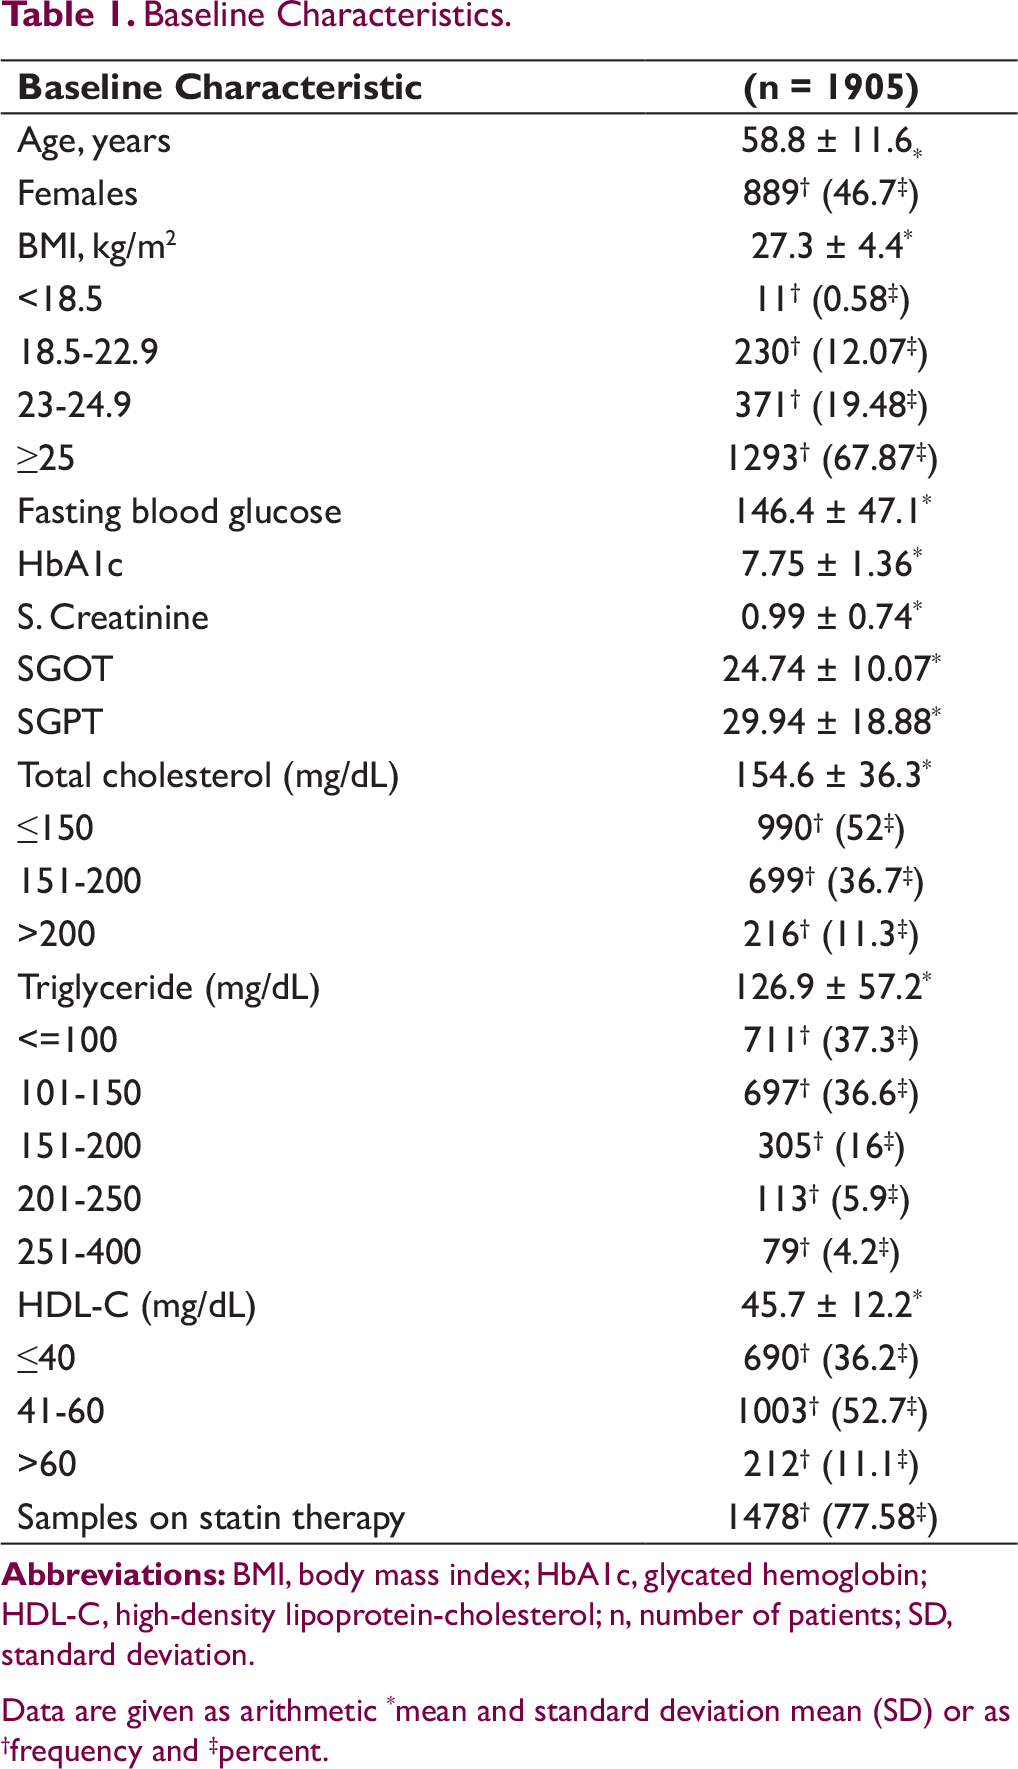
Data are given as arithmetic *mean and standard deviation mean (SD) or as †frequency and ‡percent.
Frequency d-LDL-C and c-LDL-C Across Various LDL-C Strata.
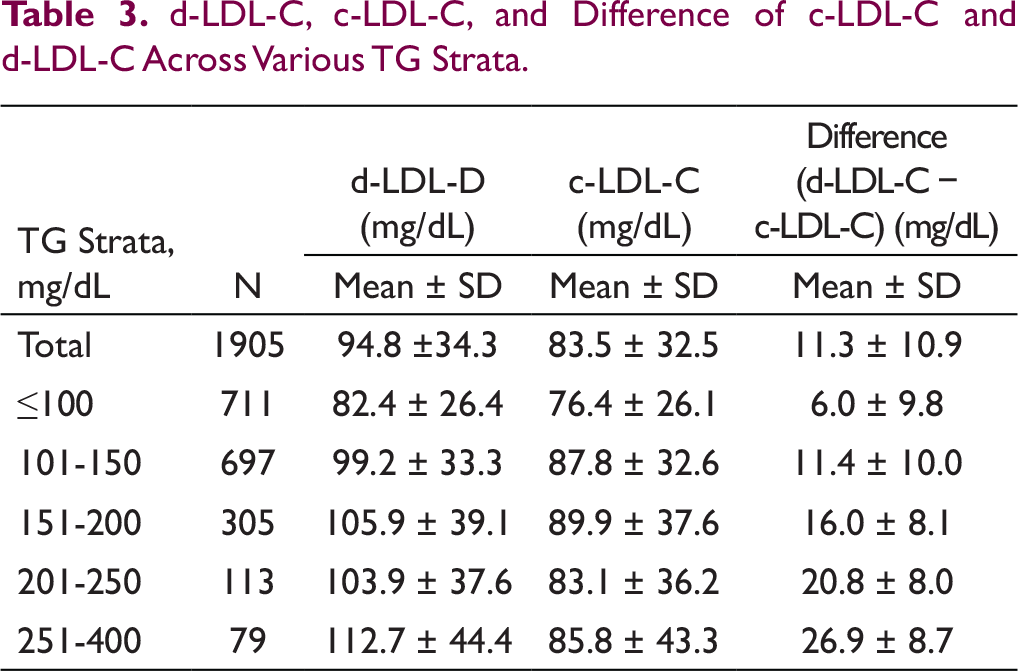
d-LDL-C, c-LDL-C, and Difference of c-LDL-C and d-LDL-C Across Various TG Strata.
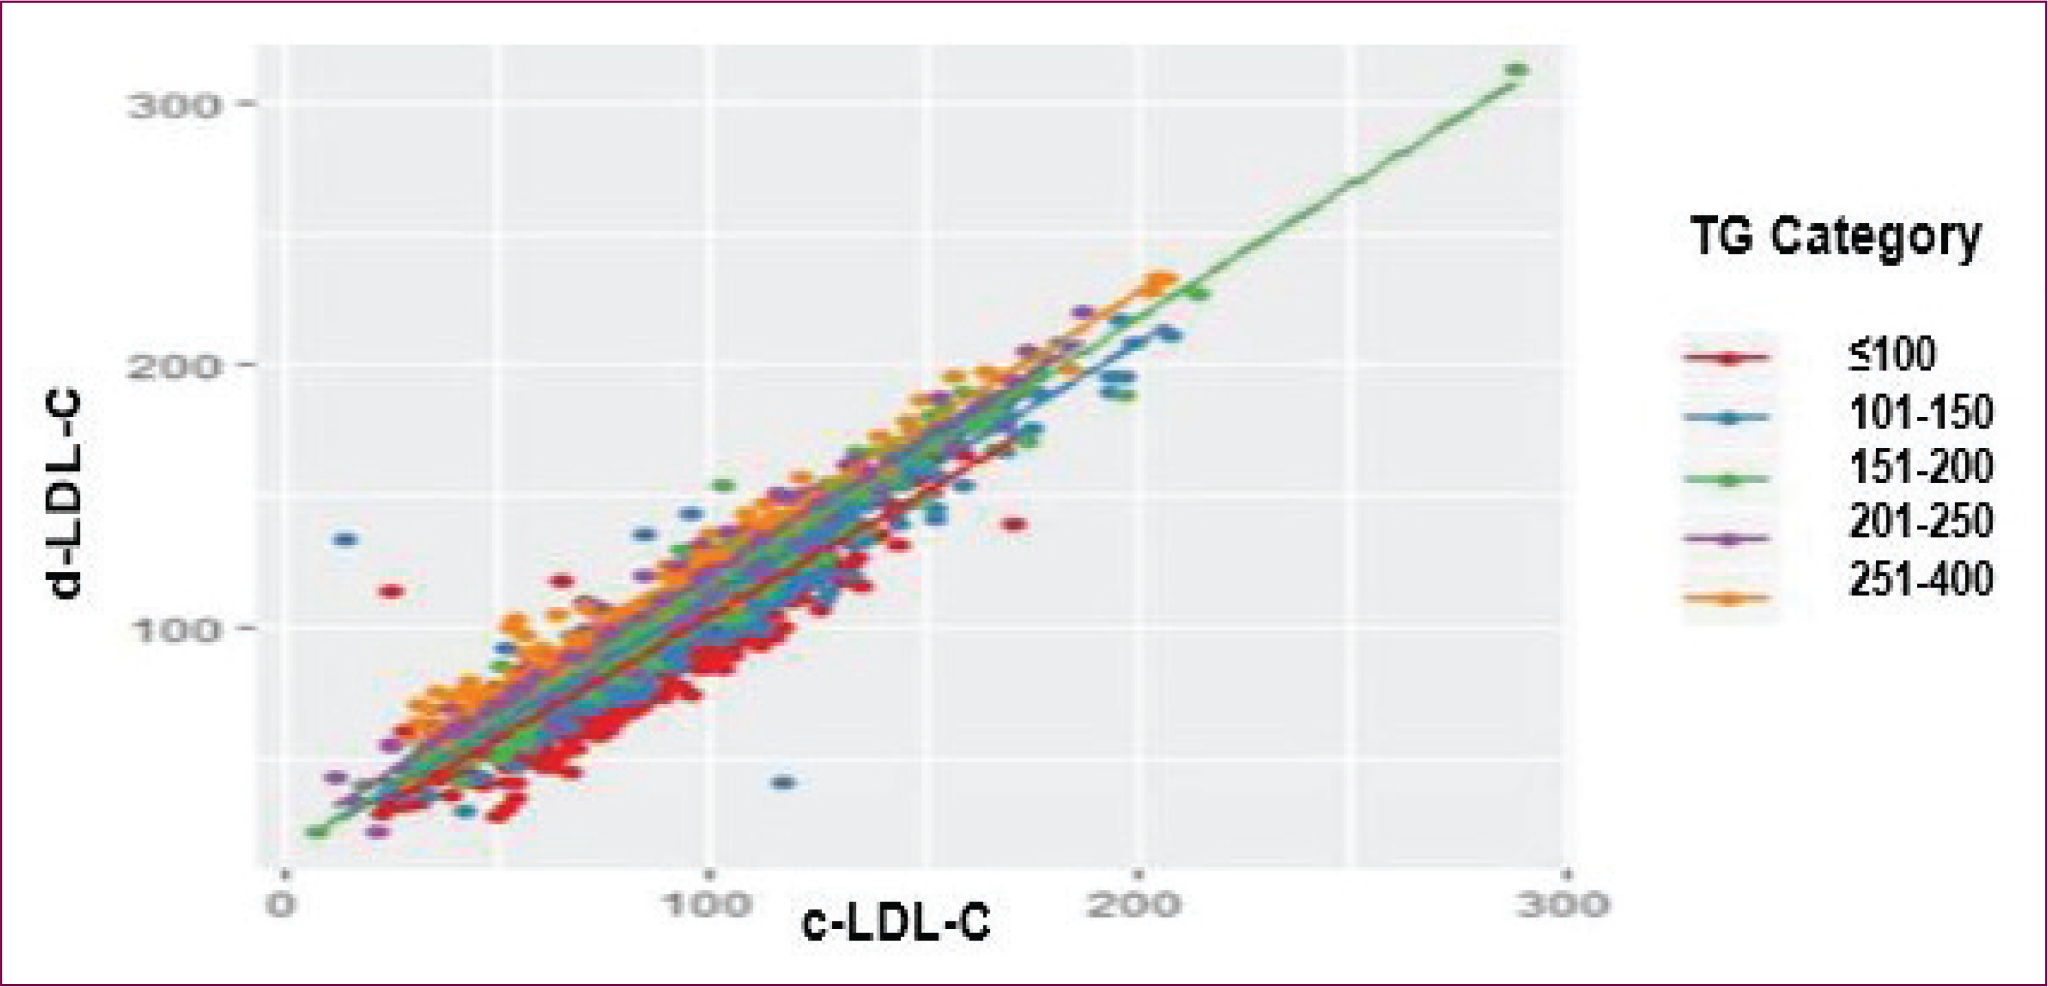
A significant positive linear correlation was found between both d-LDL-C and c-LDL-C with a correlation coefficient of 0.948 (P < .001). A significant correlation between d-LDL-C and c-LDL-C was observed across all TG strata (P < .001) (Figure 1; Supplementary Figures 1-5, Supplementary Table 2).
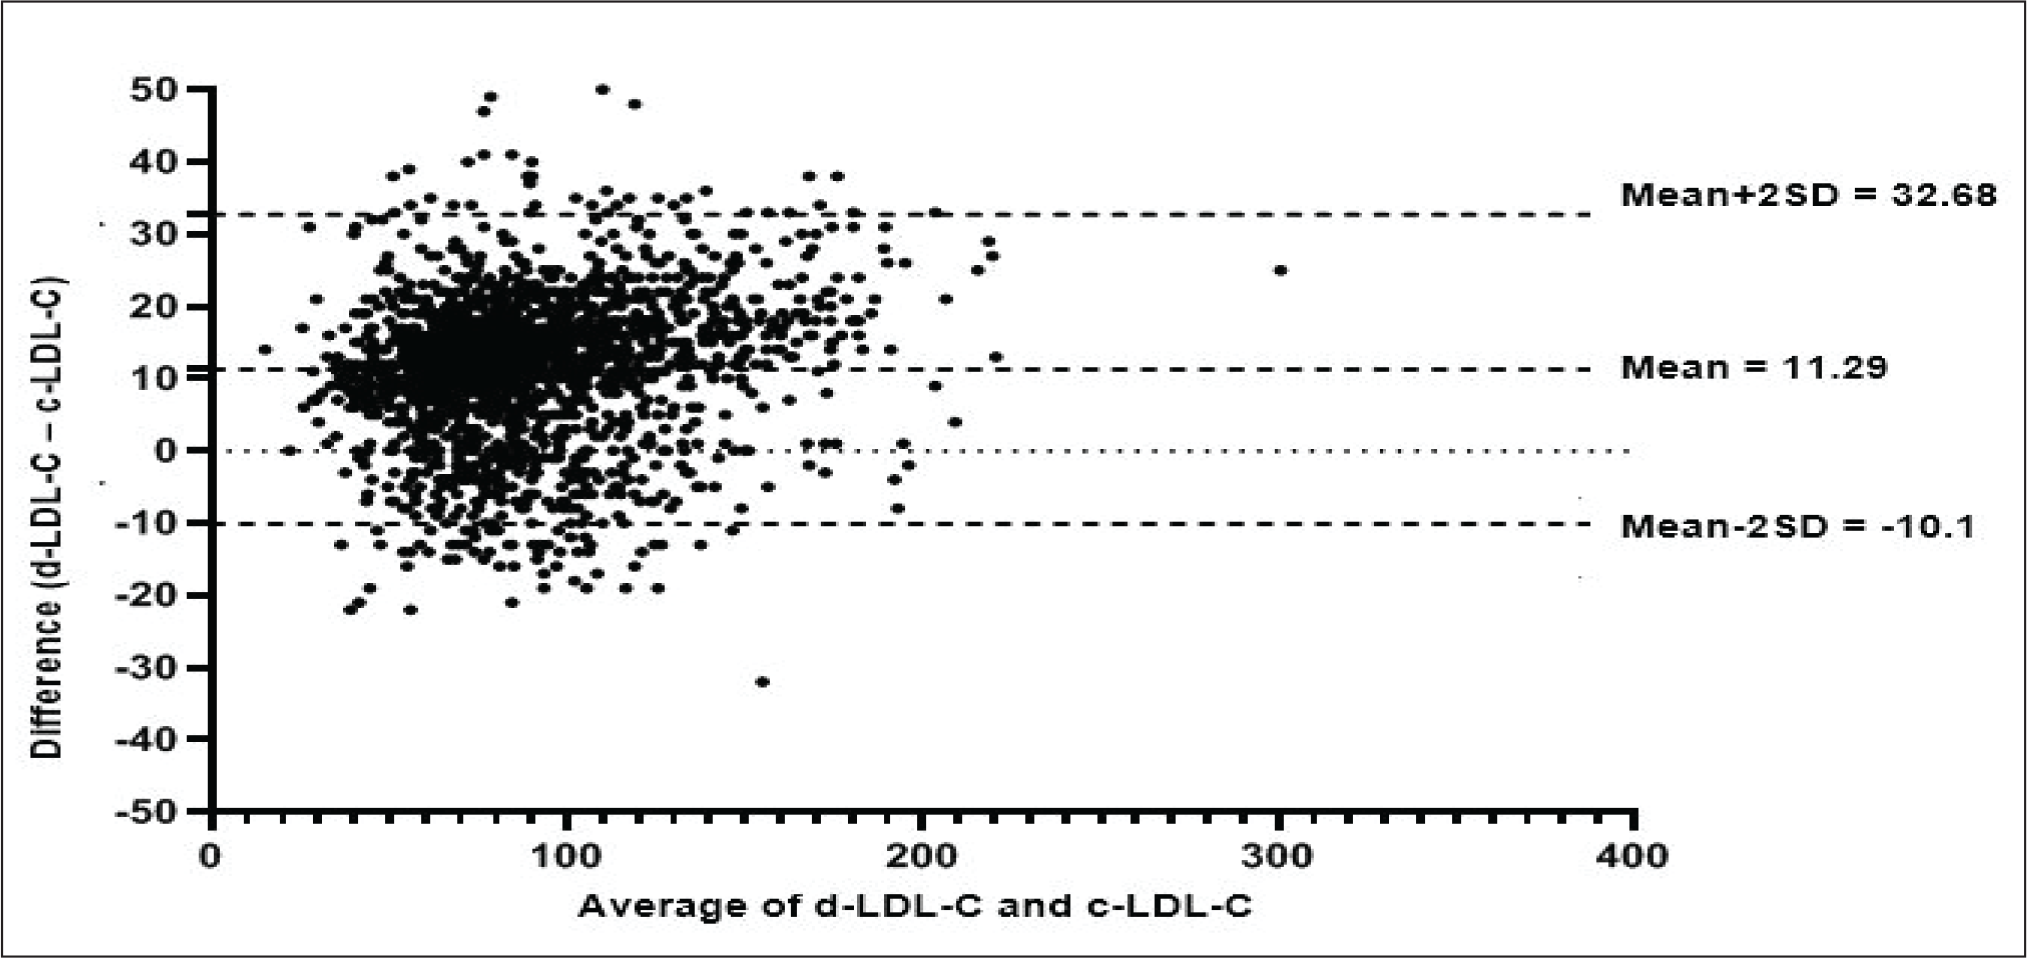
The Bland-Altman plot was used to compare and to find the agreement between d-LDL-C and c-LDL-C. For the overall group, the limits of agreement for d-LDL C and c-LDL C were −10.1 to 32.68 mg/dL (Figure 2). The mean (±SD) bias for strata TG (mg/dL) level ≤100, 101-150, 151-200, 201-250, and >250 was 5.968 ± 9.765; 11.35 ± 10.02; 15.96 ± 8.11; 20.79 ± 7.95, and 26.86 ± 8.67, respectively (Supplementary Figures 6-10). The bias becomes greater with increasing TG strata.
Subjects Achieving the Pre-specified Target by d-LDL-C and C-LDL-C and Misclassification of Lipid Levels When Using c-LDL-C.
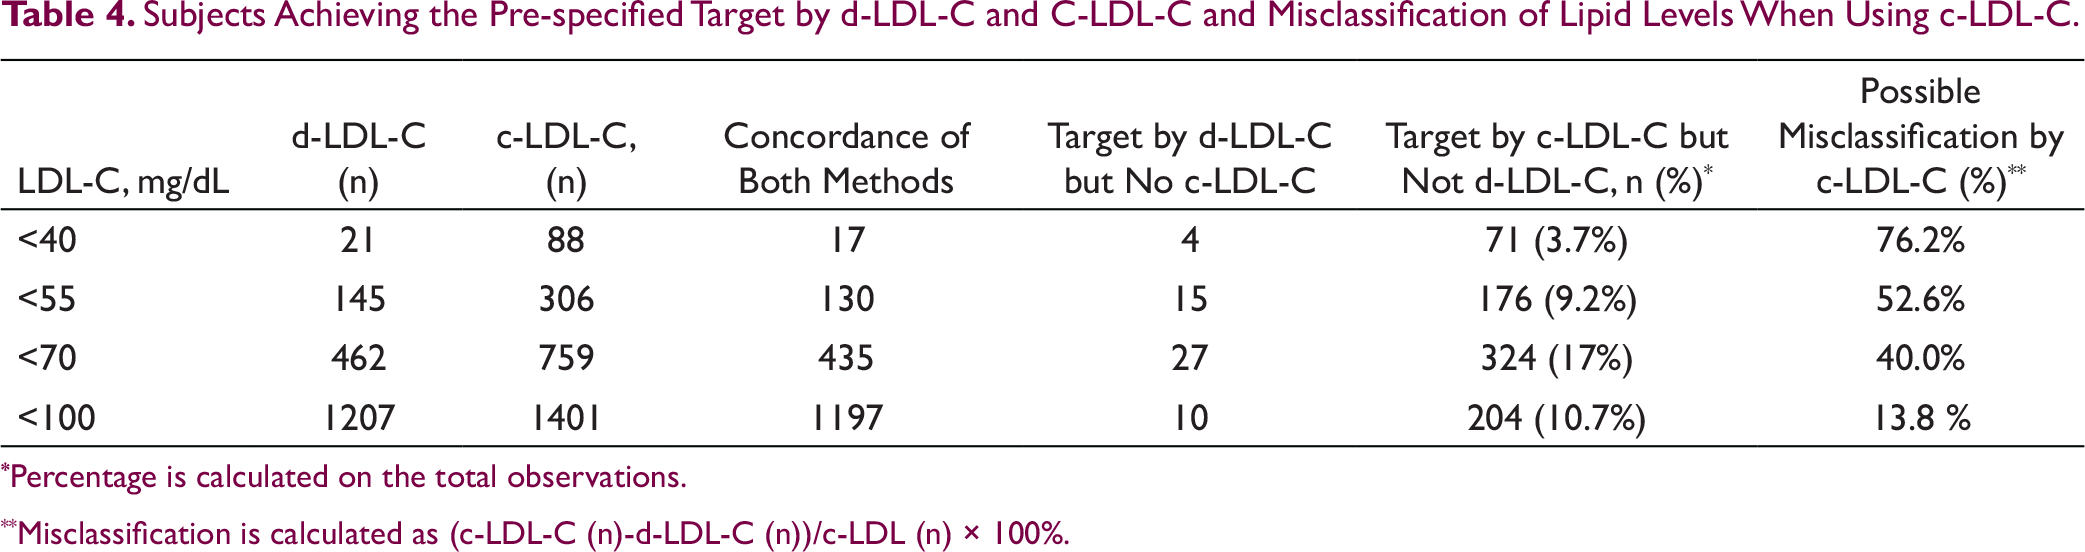
*Percentage is calculated on the total observations.
**Misclassification is calculated as (c-LDL-C (n)-d-LDL-C (n))/c-LDL (n) × 100%.
Concordance between the methods and misclassification at various LDL-C cut-offs are given in Table 4. When an LDL-C cut-off of 70 mg/dL was used, 759 (39.84%) values were less than 70 mg/dL with c-LDL-C and 462 (24.25%) values with d-LDL-C, respectively. At target levels of c-LDL-C ≤70 mg/dL, the mean TG was 123.7 ± 49.95 and 108.8 ± 51.46 for c-LDL-C and d-LDL-C, respectively (P < .0001).
Discussion
Our study showed that a homogeneous method for direct LDL measurement had positive correlation with c-LDL-C with FF in people with type-2 diabetes mellitus. Despite this correlation, a positive bias in favor of d-LDL-C was seen, which increased with increasing TG strata. Using FF-estimated c-LDL-C values misclassified a significant proportion of people at lower LDL-C levels and those with higher TG levels.
Generally, the estimated d-LDL-C values are numerically higher than c-LDL-C values. 9 The difference between d-LDL-C and c-LDL-C increased progressively at higher strata of TG. This increasing difference between d-LDL-C and c-LDL-C is consistent with various other published studies. A similar difference between d-LDL-C and c-LDL-C in the overall group of subjects and the increasing difference at higher levels has been seen in other studies.10-13 Higher TG levels are a sign of insulin resistance and is commonly seen in people with type-2 diabetes and obesity. 14 The lack of accuracy of FF at higher TG levels is related to the use of a fixed ratio of TG/VLDL of 5 in the equation. Equations like Martin Hopkins which uses variable ratio based on an individual’s non-HDL-C and TG values achieve better precision in calculating LDL-C. 15
A significant correlation observed between the c-LDL-C and d-LDL-C in our study is in line with various studies.9, 13, 16 A strong correlation between c-LDL-C and d-LDL-C across various TG strata was also seen in various studies.14, 16
Despite having a positive correlation, the Bland-Altman plots give the actual relation between these methods. The increasing positive bias in the plots increased across TG strata shows an increasing difference in values between d-LDL-C and c-LDL-C at higher TG strata. Similar agreement and bias were seen in other studies for the overall group.17, 18 People with diabetes and obesity tend to have higher TG levels, especially if glucose levels are uncontrolled.16, 17 Our study was limited to people with diabetes and 67.9% had BMI ≥25 kg/m2. In this group of people, c-LDL-C was less reliable in the higher TG strata over d-LDL-C.
Professional cardiology organizations have proposed target levels for LDL-C to minimize the risk of ASCVD.2, 7 In people with various categories of ASCVD, lipid-lowering therapies are intensified to reach LDL-C targets below 100, 70, 55, and 40 mg/dL based on the risk profile. 2 LDL-C values can also be entered into risk equations to derive the 10-year disease risk.2, 7 Underestimating the ASCVD risk can lead to the suboptimal treatment of people, thereby leading to increased risk of cardiovascular events. With therapies like PCSK9 inhibitors, it is common to find exceptionally low LDL-C values. Precision of estimation of LDL at these low values is important to judge the effectiveness of these newer drugs and ensure optimal cardiovascular risk reduction. 5
We assessed how using either method would affect the number of persons classified according to various cut-offs of LDL. c-LDL-C tends to misclassify people and underestimate the risk (Table 4). The difference in TG may account for the difference between the two methods. In a group of 88 subjects with LDL-C <40 mg/dL by calculated method, only 21 (24%) had a similar target of LDL-C by the direct method. Hence, the chance of misclassification and suboptimal therapeutic lipid-lowering therapy is likely to be extremely high with the use of c-LDL-C methods. Risk of misclassification is higher at lesser levels of LDL-C (Table 4).
It is known that change in methodology of LDL-C can change the proportion of people reaching targets. The tendency for FF values of c-LDL-C to misclassify people with various LDL levels, especially at higher levels of TG is seen in the literature.13, 17, 19-21 In a study of 1999 adults with type-2 diabetes, more than 10% of patients were misclassified by the c-LDL-C by the FC method for LDL target of 100 mg/dL compared to a modified equation. 16 This was more pronounced in people with TG >203 mg/dL. 19 In a subset of people in FOURIER trial on PCSK9 inhibitors with LDL <40 mg/dL, FC underestimated LDL levels in 40% of individuals in comparison to beta quantification. 22
However, some studies have also reported no significant difference between c-LDL-C and d-LDL-C methods. In a study to assess the analytical performance of 4 methods of direct LDL-C measurements, there was no advantage of these methods over c-LDL-C. However, the study did not look at LDL levels <130 mg/dL. 23 In a small study involving 150 subjects with metabolic syndrome, there was no significant difference between direct LDL and Friedewald’s LDL at TGs below 150 mg/dL and above 150 mg/dL. 24
The study was done only on one type of direct assay by homogenous enzymatic colorimetric method, LDL Cholesterol Gen 3 (Roche Diagnostics, GmbH). The results of the study cannot be extrapolated to other direct homogenous assays. c-LDL-C by Martin Hopkins equation and novel NIH equation have shown more agreement with d-LDL-C and beta quantification. 4 FF was used in our study since it is the most used method in practice, and we were interested in seeing the changes in classification as we shifted from one method to another. Both d-LDL assays and c-LDL will not factor in particle size. Small LDL particles increase in individuals with diabetes especially those with higher TG levels. Since it is well known that FF lacks reliability in this group, we have excluded people with TG >400 mg/dL from the study. Hence, the benefits of using d-LDL assays in this subgroup of people cannot be deduced from our study.
Conclusion
In this study, both c-LDL-C and d-LDL-C were strongly correlated in the entire sample and across all TG strata. Despite this correlation, there was increasing positive bias at higher TG levels in favor of d-LDL-C. Clinicians should be aware of the methods that their laboratories use for LDL estimation. As people keep changing laboratories for blood sampling, the LDL levels may differ, and this should be accounted for in decision-making. Certain groups like people with diabetes, obesity, ASCVD, those with TG >150 mg/dL, and with LDL-C <100 mg/dL with FF should consider doing LDL-C estimation with direct assays. This will help in correctly stratifying the patients at high ASCVD risk and modifying lipid-lowering therapies appropriately.
Scatter plot showing correlation between d-LDL-C and c-LDL-C across various TG levels. Correlation coefficients for the overall sample, r = 0.948 (P < .001) and at various TG strata, TG ≤100, 101-150, 151-200, 201-250, and 251-400 were as 0.931, 0.954, 0.978, 0.977, and 0.981, respectively.
Bland-Altman measure of agreement between d-LDL-C and c-LDL-C for the overall population. There was a positive bias of 11.29 with a range of −10.1 to 32.68 mg/dL.
Footnotes
Acknowledgments
We acknowledge the contribution of Anjana Chandran for data entry, Mr Jayakumar P. for statistical support, and Dr Ashish Prasad for help with writing.
Author Contributions
Declaration of Conflicting Interests
Funding
The author received no financial support for the research, authorship, and/or publication of this article.