
Abstract
Cardiogenic shock is a highly common clinical entity and is characterized by high mortality. Its prompt recognition, identification of the underlying etiology, and assessment of the severity of hemodynamic dysfunction are crucial for accurate management of this condition. Echocardiography is the most useful diagnostic modality in this setting, due to its ability to provide comprehensive information about cardiac structure and function, promptly, safely, and at the patient’s bedside. This review discusses the role of echocardiography in the evaluation and management of cardiogenic shock.
Keywords
Introduction
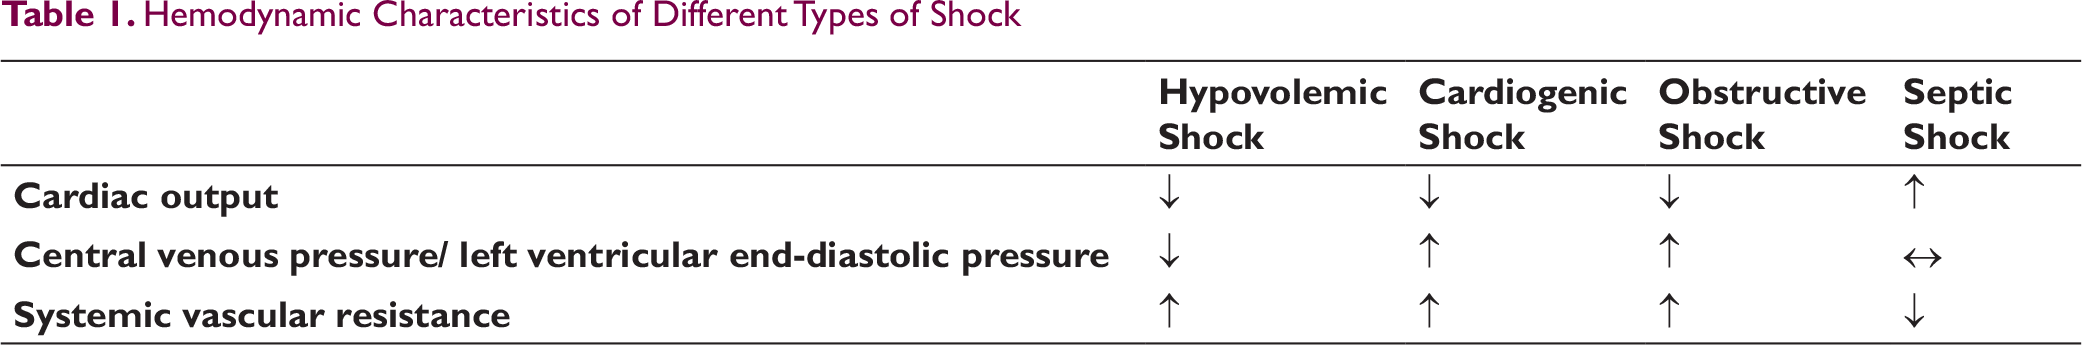
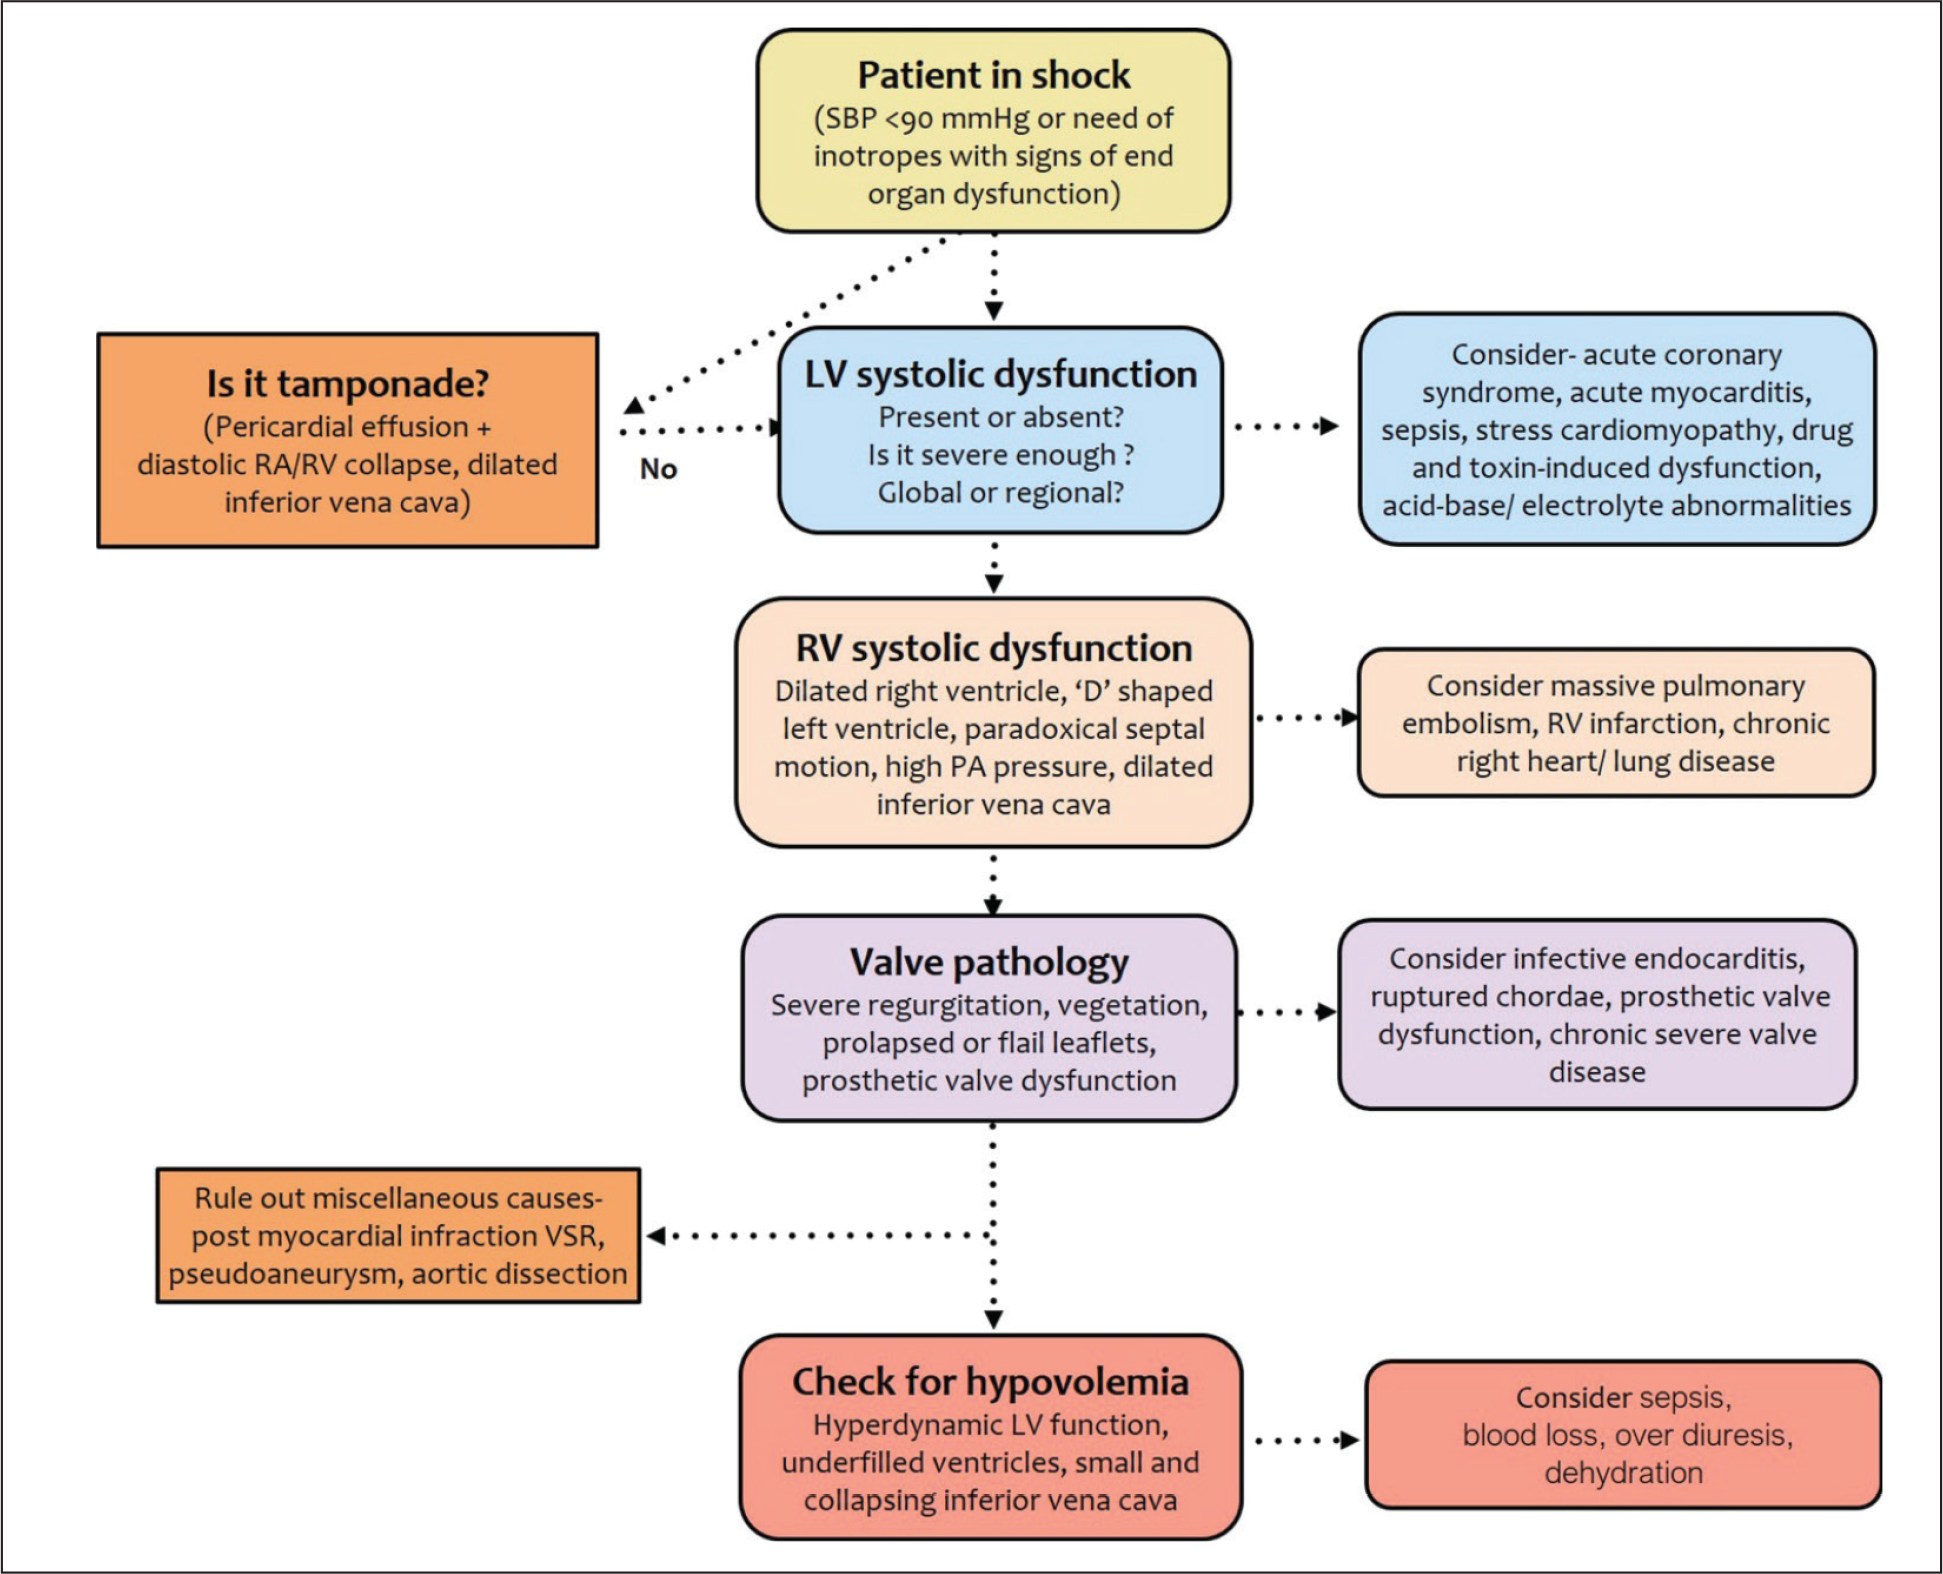
Shock is a life-threatening, generalized form of circulatory failure associated with inadequate oxygen delivery to the cells. According to the underlying pathogenic mechanisms, it is classified broadly into 4 types: cardiogenic shock (failure of pump function), hypovolemic shock (inadequate circulating volume), obstructive shock (obstruction to blood flow), and septic/vasoplegic shock (loss of vascular tone; Table 1). Since shock is associated with high mortality, early recognition of the type of shock and the underlying etiology are crucial for its optimum management. Clinically, accurate identification of the type of shock may be challenging as all forms are characterized by hypotension, impaired peripheral perfusion, decreased urine output, and altered mental status. Echocardiography serves as a very useful tool in this setting, as it can easily differentiate among various subsets of shock, identify dominating pathology in cases of multifactorial shock, and confirm the etiology in most patients with cardiogenic and obstructive shock (Figure 1). Additionally, it also provides a noninvasive means for hemodynamic monitoring of the patients, which is helpful in guiding therapy. 1
Cardiogenic Shock
Cardiogenic shock is caused by gross impairment of myocardial function that results in diminished cardiac output, end-organ hypoperfusion, and hypoxia. The SHOCK (Should We Emergently Revascularize Occluded Coronaries for Cardiogenic Shock) 2 and Intra-Aortic Balloon Pump (IABP)-SHOCK II 3 trials defined shock as systolic blood pressure of < 90 mm Hg for ≥ 30 minutes or use of pharmacological and/or mechanical support to maintain a systolic blood pressure ≥ 90 mm Hg along with clinical and laboratory evidence of end-organ dysfunction in the setting of suspected cardiac dysfunction.
Hemodynamic Characteristics of Different Types of Shock
Role of Echocardiography in Cardiogenic Shock
Echocardiography is a noninvasive, safe, portable, and relatively inexpensive diagnostic modality which can be rapidly performed and interpreted in acute settings. These features make echocardiography an ideally suited tool for application in the setting of shock. Even a basic 2-dimensional (2D) echocardiographic assessment can promptly provide an idea about the etiology of shock and the prospective line of treatment. A normal looking biventricular systolic function, normal cardiac chamber sizes, absence of any gross valvular pathology, and absence of any pericardial effusion virtually rule out any cardiac cause for the shock. A follow-up advanced study using color and spectral Doppler, tissue Doppler imaging, etc. can then be performed later to yield a more comprehensive diagnosis and an in-depth hemodynamic assessment. Transesophageal echocardiography (TEE) may be required if the transthoracic acoustic window is not adequate.
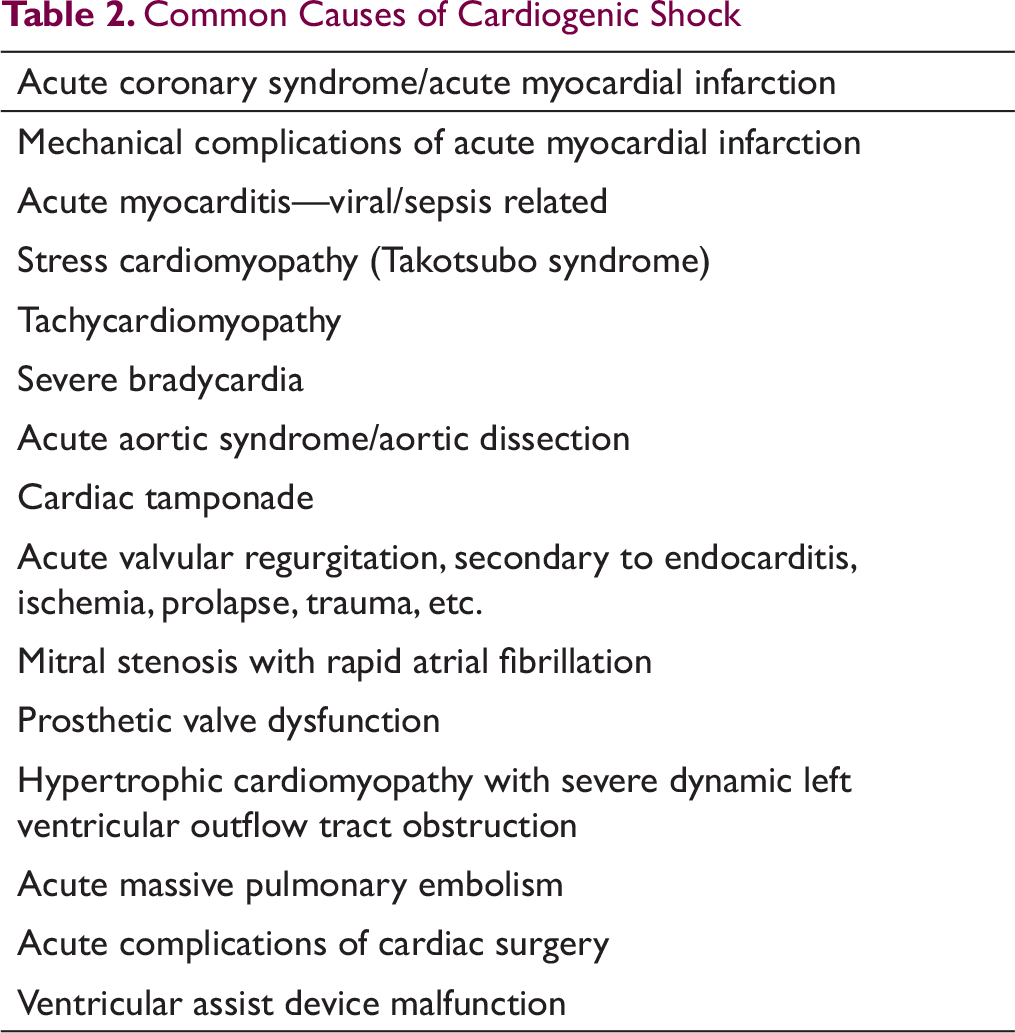
Common Causes of Cardiogenic Shock
Acute Coronary Syndrome
Acute coronary syndrome (ACS) is the commonest cause of cardiogenic shock. Cardiogenic shock usually occurs as a result of an extensive MI causing an acute loss of a large amount of functioning myocardium or a smaller insult leading to acute decompensation in a patient with preexisting severe left ventricular (LV) systolic dysfunction. Right ventricular (RV) MI (RVMI) and mechanical complications of MI are other reasons that can lead to cardiogenic shock.
Left Ventricular Systolic Dysfunction
In a patient presenting with ST-segment elevation MI (STEMI), a 12-lead electrocardiogram (ECG) itself is enough to clinch the diagnosis. However, in the remaining patients, ECG changes are usually subtle or nonspecific. In such situations, demonstration of LV systolic dysfunction by echocardiography provides a very important clue to the cardiogenic origin of shock.
Cardiogenic shock is invariably accompanied by frank LV systolic dysfunction, which is easy to recognize during echocardiography. A qualitative impression about whether LV systolic function is normal or impaired can be made almost as soon as the transducer is placed on the patient’s chest wall. With more detailed examination, LV ejection fraction (LVEF) can be estimated to provide a quantitative assessment of LV systolic function. In case of expert echocardiographers, visual “eyeballing” is fairly accurate for the estimation of LVEF and is sufficient for most practical purposes. 7 However, for less experienced readers and when LVEF is close to thresholds for various key therapeutic decisions (eg, LVEF 30% in a patient who might require an implantable cardioverter defibrillator), a more formal estimation of LVEF using the biplane Simpson’s method is recommended. 8 When available, 3-dimensional (3D) echocardiography provides the most accurate estimation of LVEF, though it is limited by the need for good image quality and expertise.9-11
Besides diagnosing LV systolic dysfunction, echocardiography also helps ascertain whether the impairment is regional or global. This information is crucial as the presence of regional wall motion abnormality (RWMA) in an acute setting is virtually pathognomonic of underlying coronary artery disease and almost confirms the diagnosis of ACS. However, the absence of RWMA does not necessarily rule out coronary artery disease because chronic severe ischemic LV systolic dysfunction may sometimes be present as global impairment. The distribution of RWMA is also important as it helps in localizing the site of obstruction in the coronary arteries. Additionally, the severity of segmental myocardial dysfunction (ie, hypokinesia or akinesia, scarring, aneurysm formation, etc.) provides a clue to the likelihood of functional recovery of the affected myocardial segments, which too influences management decision in these patients.
Strain imaging using speckle-tracking echocardiography (STE) has been shown to be useful in predicting functional recovery and overall prognosis in patients presenting with ACS. 12 However, the incremental value of this information in the setting of cardiogenic shock is only limited. Moreover, the accuracy of STE for segmental analysis is suboptimal at present.13, 14
Mechanical Complications of Myocardial Infarction
Mechanical complications of MI almost invariably present with cardiogenic shock and are associated with very high mortality rates. The common mechanical complications include acute mitral regurgitation (MR) due to chordal/papillary muscle rupture, ventricular septal rupture (VSR), and free wall rupture with or without pseudoaneurysm formation.15, 16 All these complications typically have a bimodal timing with peak incidence either on day 1 itself or between 3 and 5 days after MI.
Chordal/Papillary Muscle Rupture with Acute Mitral Regurgitation
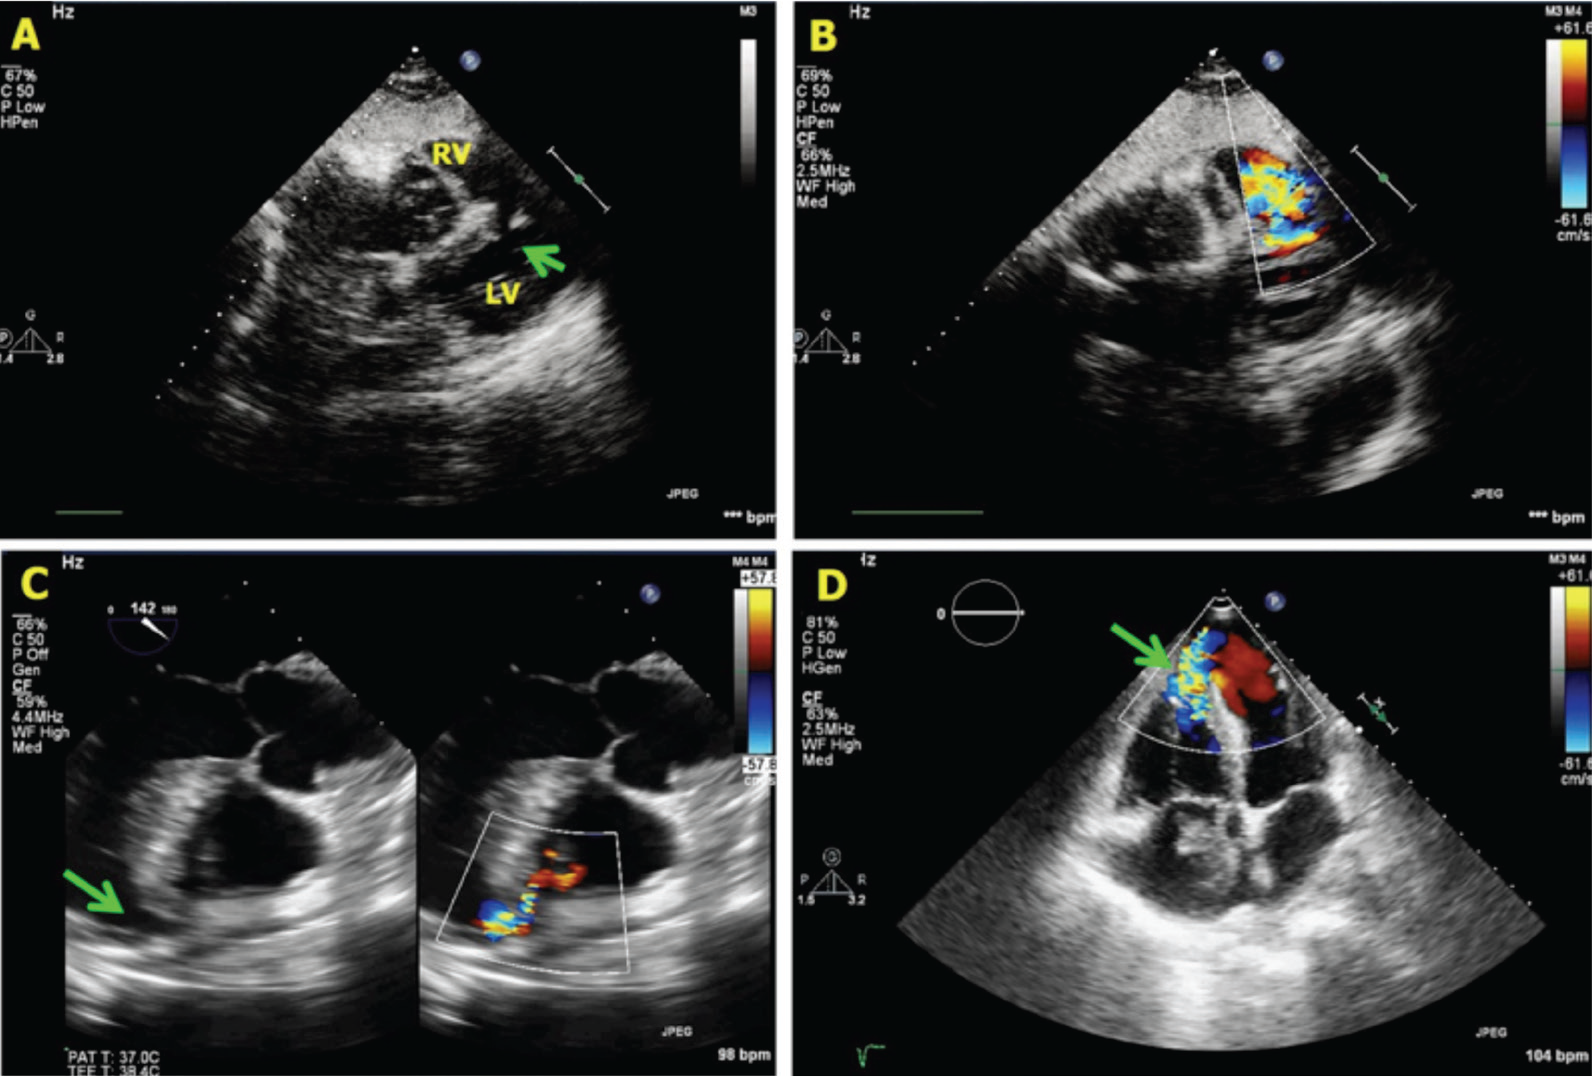
Rupture of chordae tendinae or partial or complete rupture of a papillary muscle occurs in roughly 1% of all cases of STEMI.15, 16 It is more common after inferior wall MI and even a modest size infarct can cause chordal/papillary muscle rupture. Posteromedial papillary muscle is involved more often because of its single blood supply as compared to the dual blood supply of anterolateral papillary muscle. Echocardiography is the most useful modality for diagnosing this condition (Figure 2). It confirms the diagnosis by demonstrating the actual pathology in the form of flail mitral leaflet secondary to chordal/papillary muscle rupture leading to severe MR. 3D TEE permits comprehensive assessment of mitral valve pathology, which is very helpful in planning the surgery.
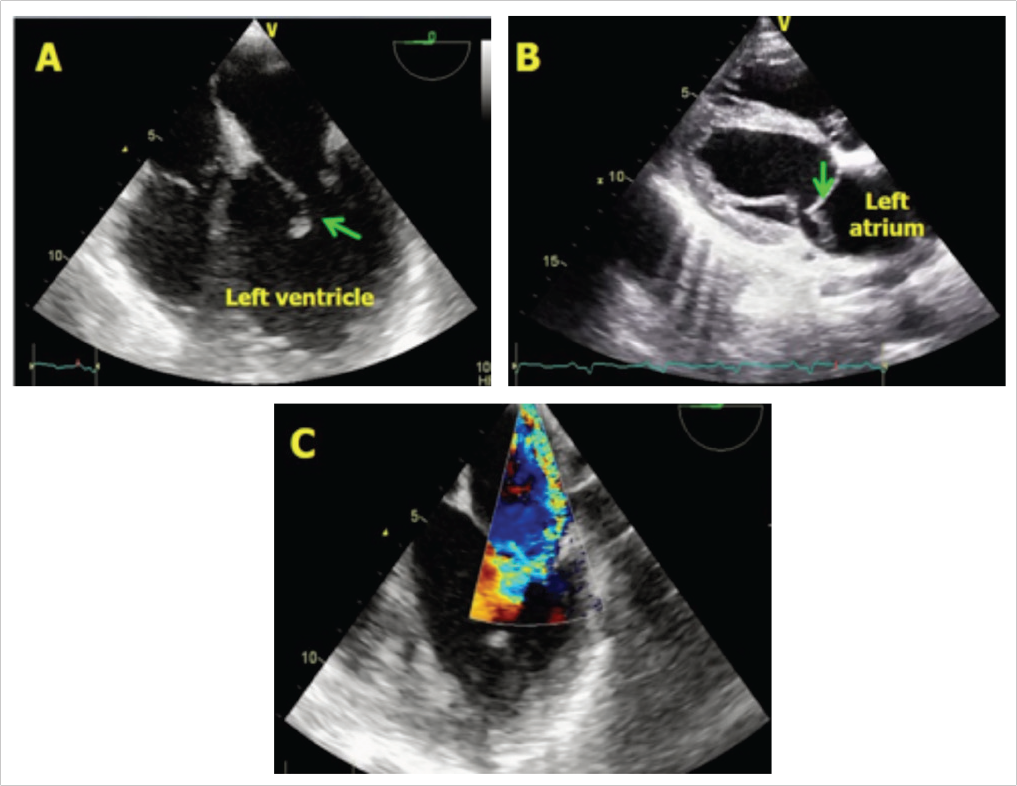
A, B, The torn papillary muscle is seen attached to the mitral leaflet and prolapsing in to left atrium (arrow). C, Posteriorly directed severe mitral regurgitation.
Postmyocardial Infarction Ventricular Septal Rupture
Post-MI VSR occurs in roughly 1% to 3% of all STEMI.15, 16 The incidence has now decreased due to early institution of reperfusion strategy. The site of defect varies according to the location of MI, as the necrosed myocardium ruptures due to high pressure within the left ventricle.
High index of suspicion with careful echocardiographic assessment is needed to detect post-MI VSR, which may not be readily recognized, especially the apical VSRs (Figure 3). However, once diagnosed, echocardiography permits complete delineation of the defect and its hemodynamic significance. It also provides additional information required for planning the repair such as the proximity of the defect to mitral valve, space available for deploying a device in case of apical repair, condition of the myocardial tissue around the defect, etc.
Left Ventricular Free Wall Rupture
LV free wall rupture is a lethal complication of STEMI with an overall incidence of 0.85% to 6.2%.15, 16 Greater use of primary percutaneous intervention has lately reduced the incidence of LV free wall rupture.17, 18 It occurs more commonly with large infarcts and usually involves the anterolateral wall.
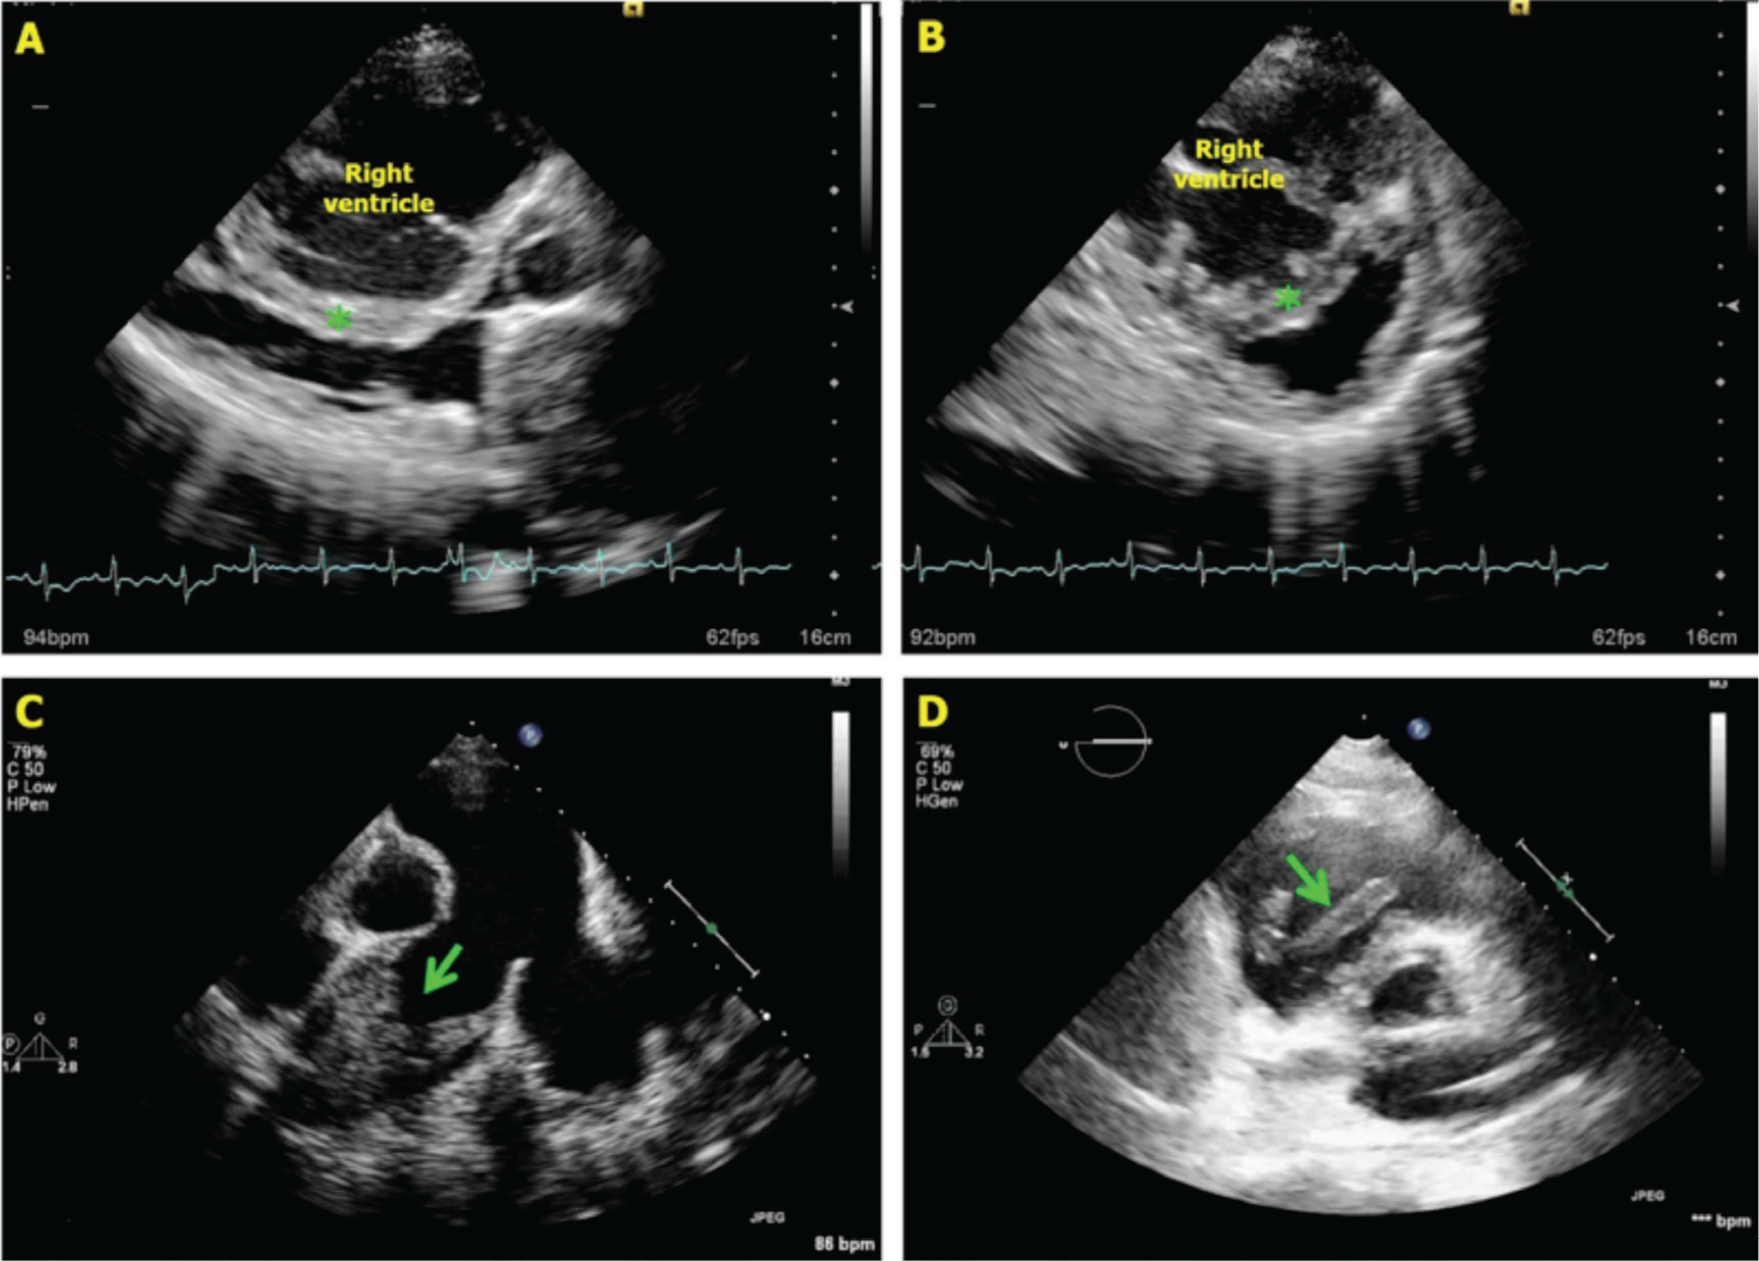
The complete free wall rupture results in immediate cardiac tamponade and/or sudden death and therefore, does not get recognized in most cases. However, when the defect is small and ruptures into the pericardial space, it may get contained due to rise in intrapericardial pressure which prevents further leakage of blood (Figure 4). In such cases, the presence of echogenic fluid collection in the pericardial space with features of cardiac tamponade provides a clue to the diagnosis. Rarely, the actual leak may also be visualized, especially if contrast is used.
A, B, Subcostal four-chamber view showing a defect (arrow) in the mid portion of interventricular septum with blood flow across the defect. C, An apical defect seen on transesophageal echocardiography. D, Another example of apical ventricular septal rupture.
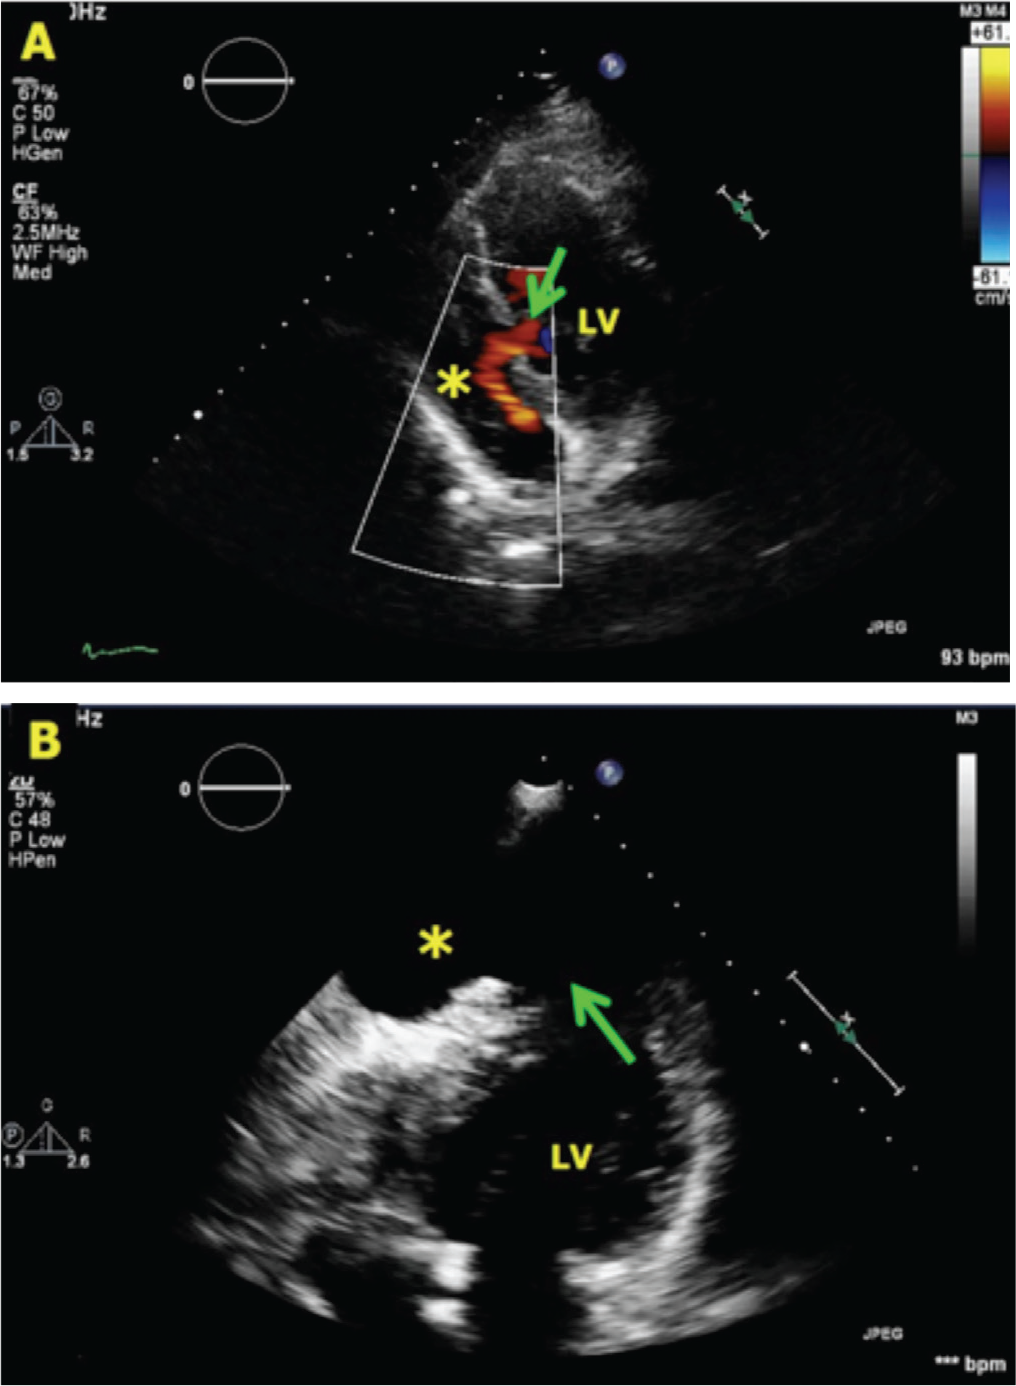
A, Posterior wall rupture (arrow) into the pericardial space (asterisk). B, An apical free wall rupture resulting in formation of a pseudoaneurysm.
In some cases, the free wall rupture is not transmural and gets contained by some part of the LV wall itself (some myocardial tissue along with visceral pericardium), resulting in formation of a pseudoaneurysm (Figure 4). Echocardiography in these cases reveals an out-pouching of LV wall with to and fro movement of blood between the LV cavity and the aneurysm. Thrombi are commonly found in such pseudoaneurysms.
Right Ventricular Myocardial Infarction
RVMI is common in patients with inferior wall MI and is an adverse prognostic marker.19-21 When present, RVMI usually manifests as cardiogenic shock which is often refractory to conventional management of inferior wall MI.15, 19, 21 Therefore, prompt recognition of RVMI is important. Echocardiographically, RVMI can be recognized by the presence of RV dilatation and dysfunction. Visual recognition of RV contractile dysfunction, which may be global or regional, is usually sufficient for diagnosis. Multiple echocardiographic windows need to be used, especially if the abnormality is localized. Quantification of RV systolic function is challenging as RVEF cannot be estimated using 2D echocardiography. RV fractional area change, tricuspid annular systolic velocity (measured using tissue Doppler imaging), and tricuspid annular plane systolic excursion are used as surrogates for global RV systolic function. 22 More recently, RV strain measured using STE has emerged as a useful measure of RV systolic function.
Other Forms of Acute Myocardial Dysfunction
There are several other conditions such as stress cardiomyopathy, acute myocarditis, sepsis-related cardiomyopathy, tachycardiomyopathy, etc. that can result in acute severe LV systolic dysfunction and can present as cardiogenic shock. In all these cases, echocardiography will demonstrate impairment of LV systolic function which would suggest cardiogenic origin of shock. The LV systolic dysfunction is usually global, but in stress cardiomyopathy, also known as takotsubo cardiomyopathy, regional involvement is characteristic.23-25 Apical segments are most commonly involved resulting in apical ballooning, but other patterns are also known. Echocardiographically, this condition is often indistinguishable from acute MI. Clinical presentation, ECG changes, serum cardiac enzyme levels, and cardiac magnetic resonance imaging are helpful in differentiating takotsubo cardiomyopathy from acute MI. The diagnosis of takotsubo cardiomyopathy is finally confirmed by the demonstration of normal coronaries during angiography and spontaneous recovery of LV function with time.24, 25
Cardiac Tamponade
Cardiac tamponade is another common cause of cardiogenic shock. Echocardiography is the most useful modality for diagnosis of tamponade (Figure 5). It reveals pericardial effusion of varying magnitude accompanied by hemodynamic features of tamponade such as early diastolic RV collapse, late diastolic right atrial (RA) collapse, significant respiratory variation in mitral and tricuspid inflow velocities, and a dilated, noncollapsing inferior vena cava (IVC). Besides establishing the diagnosis, echocardiography is also useful in guiding pericardiocentesis.
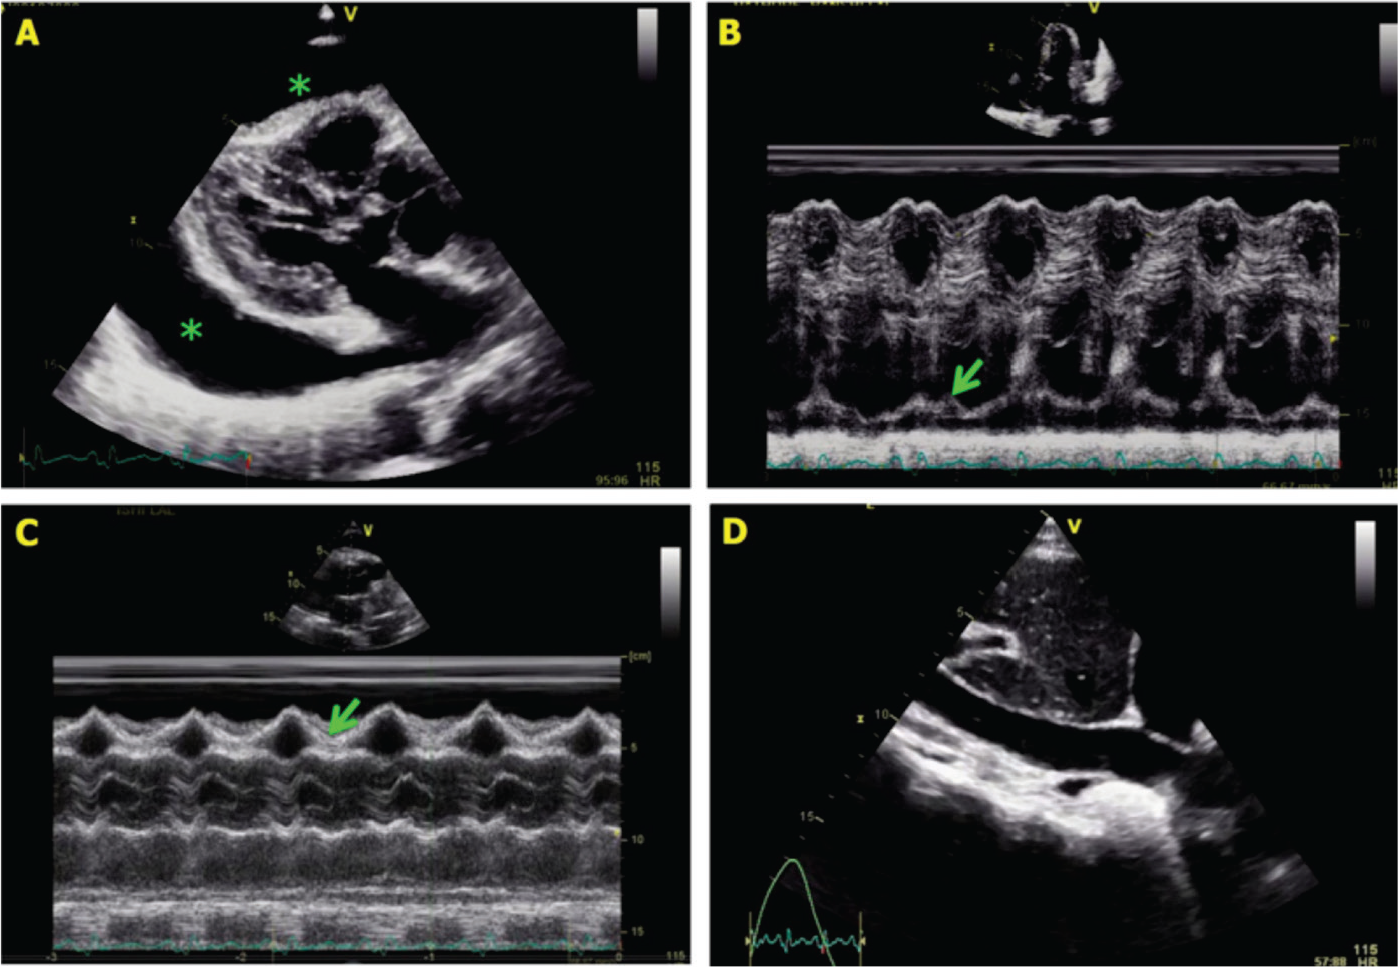
A, Large, circumferential pericardial effusion (asterisks). B, M-mode tracing in apical four-chamber view showing late diastolic right atrial collapse (arrow). C, M-mode tracing in parasternal long-axis view showing early diastolic right ventricular collapse (arrow). D, Dilated inferior vena cava.
Valve Diseases
Several valvular diseases can present with cardiogenic shock. Rapid atrial fibrillation in a patient with severe mitral stenosis; acute MR due to disruption of mitral valve apparatus secondary to acute MI, infective endocarditis, degenerative disease or trauma; and acute severe aortic regurgitation secondary to aortic dissection, trauma or infective endocarditis can all result in cardiogenic shock. Severe aortic stenosis may also present with cardiogenic shock, but this is usually secondary to acute decompensation in the setting of underlying severe chronic LV systolic dysfunction.
For any valve lesion, echocardiography is the most useful diagnostic modality, especially in the acute setting. It allows comprehensive assessment of the valve lesion(s) as well as its impact on ventricular function and cardiac hemodynamics. It also provides additional anatomic and functional information which is helpful in planning the management strategy.
Aortic Dissection
Aortic dissection per se does not lead to cardiogenic shock, but it may cause acute severe aortic regurgitation, cardiac tamponade or acute MI (secondary to involvement of coronary ostia), which may result in cardiogenic shock (Figure 6). Prompt recognition of dissection is crucial to avoid mistreating these patients as acute MI (with potentially catastrophic complications) and also to facilitate immediate surgical repair. Careful echocardiographic evaluation of aortic root and ascending aorta should easily lead to the diagnosis because all these complications occur only when the dissection involves the aortic root.
Acute Pulmonary Embolism
Acute, massive pulmonary embolism results in shock by causing acute obstruction to RV outflow. It is actually an obstructive form of shock, and not really a cardiogenic shock.
Acute pulmonary embolism should be suspected in all patients who present with rapidly worsening breathing difficulty or hemodynamic compromise with underlying predisposing clinical setting. Echocardiographic demonstration of elevated pulmonary artery (PA) pressure with or without RV dilatation and dysfunction provides strong corroborative evidence for pulmonary embolism (Figure 7). In some cases, thrombi may also be seen in the right atrium, right ventricle or PA.
Hemodynamic Assessment by Echocardiography
Shock is often multifactorial. Septic shock is a classic example in which circulatory compromise is variably contributed to by peripheral vasodilatation, sepsis-related myocardial dysfunction, and hypovolemia (due to poor oral intake/vomiting, etc.). In such cases, accurate determination of the hemodynamic mechanism responsible for shock is essential for selection of appropriate management strategy. Additionally, frequent hemodynamic monitoring at regular intervals is required for further dose modification and for guiding the ongoing therapy. Invasive hemodynamic monitoring has traditionally been preferred in this setting due to its ability to provide comprehensive and accurate hemodynamic data; however, it is expensive and is associated with an appreciable risk of complications.26-28 In contrast, echocardiography offers a reliable and much safer alternative for this purpose. Several different hemodynamic measurements can be obtained using echocardiography, which together help in characterizing the type of shock and guiding management.
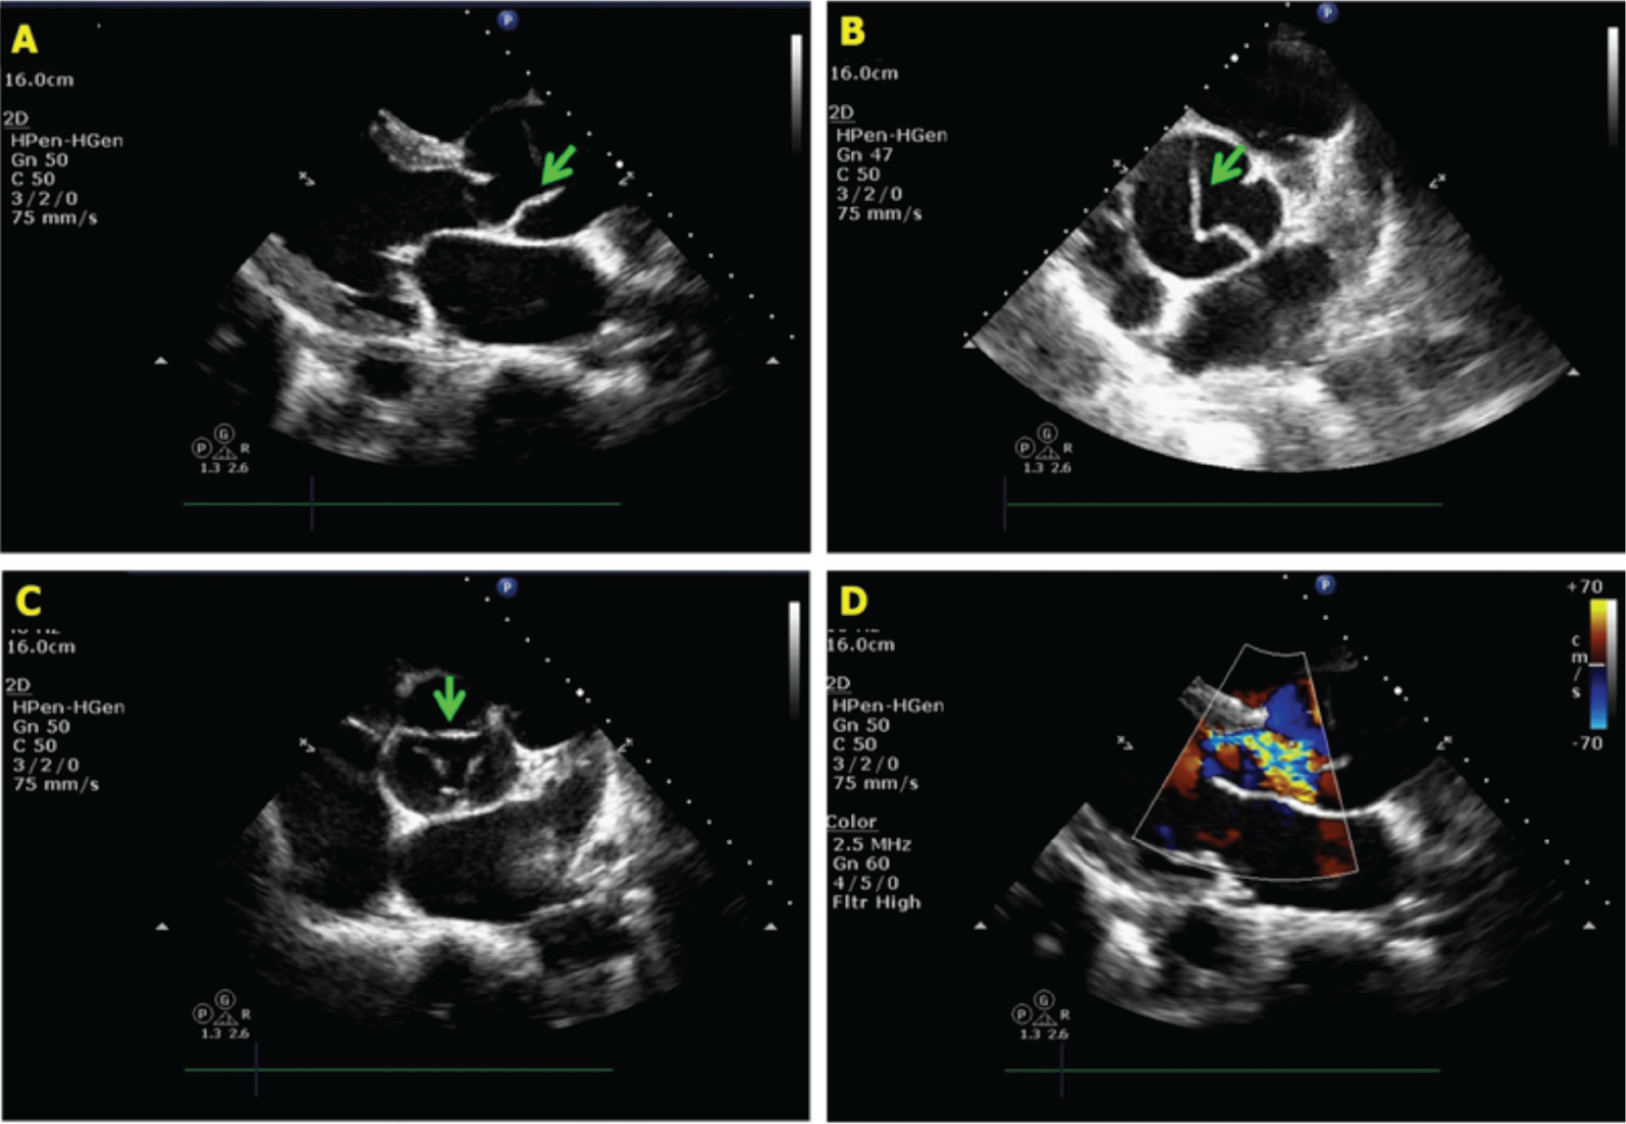
A, B, Parasternal long- and short-axis views showing dissection flap (arrow) just distal to the aortic valve. C, Noncoaptation of aortic valve leaflets (arrow) due to acute aortic root dilatation. D, Severe aortic regurgitation.
A, B, Significantly dilated right ventricle with interventricular septum (asterisk) completely bulging into the left ventricle. C, In the same patient, main pulmonary artery is grossly dilated with complete occlusion of right pulmonary artery with thrombus (arrow). D, Another patient with pulmonary embolism with a free-floating large thrombus in the right ventricle.
Cardiac Output and Vascular Resistance
The estimation of systemic vascular resistance (SVR) along with intracardiac filling pressures allows differentiation between different forms of shock. SVR is estimated by applying the Ohm’s law which states that the resistance across any vascular circuit is equal to the pressure gradient across the circuit divided by the flow. Therefore,
SVR (wood units) = [mean aortic pressure (mmHg) – mean RA pressure (mmHg)]/systemic blood flow (L/min)
In the above equation, mean systemic blood pressure is used as a surrogate for mean aortic pressure, whereas mean RA pressure and systemic blood flow are obtained by echocardiography as described below.
For systemic blood flow, stroke volume and cardiac output are measured at the LV outflow tract (LVOT), unless there is significant aortic regurgitation. LVOT is preferred because it is easily visualized, is nearly circular in shape, and its size remains relatively constant during the cardiac cycle. In addition, the blood flow through LVOT is mostly laminar, which minimizes the chances of inadvertently sampling velocities that are not truly representative of the actual blood flow at that point. The stroke volume and cardiac output are calculated using the following equations:
Stroke volume at LVOT (mL) = LVOT area (cm2) × LVOT velocity–time integral (cm)
Cardiac output (L/min) = Stroke volume (mL) × heart rate (beats/min)
Parasternal long-axis view is used for measuring LVOT diameter and area, whereas apical 5-chamber view is used for measuring LVOT velocity–time integral.
Right Heart Filling Pressures
The assessment of IVC size and collapsibility can provide a fair idea of RA pressure, even though it has its own fallacies. Guidelines recommend that in the spontaneously breathing patients, an IVC diameter < 21 mm that collapses with a sniff indicates a normal RA pressure of 3 mmHg, whereas an IVC diameter > 21 mm that collapses < 50% with a sniff indicates RA pressure of > 15 mmHg. When only 1 of these 2 criteria is met, it is suggestive of an RA pressure of approximately 8 mmHg. 22 This can be further refined by incorporating other measures of right heart overload. However, this algorithm is not applicable in patients on mechanical ventilation, in whom additional indices of RA pressure need to be obtained by examining RV inflow pattern, tricuspid annular early diastolic velocity, hepatic vein flow pattern, etc. 22 In general, if the IVC is less than < 12 mm in size in mechanically ventilated patients, it indicates normal RA pressure. 29
Left Heart Filling Pressures
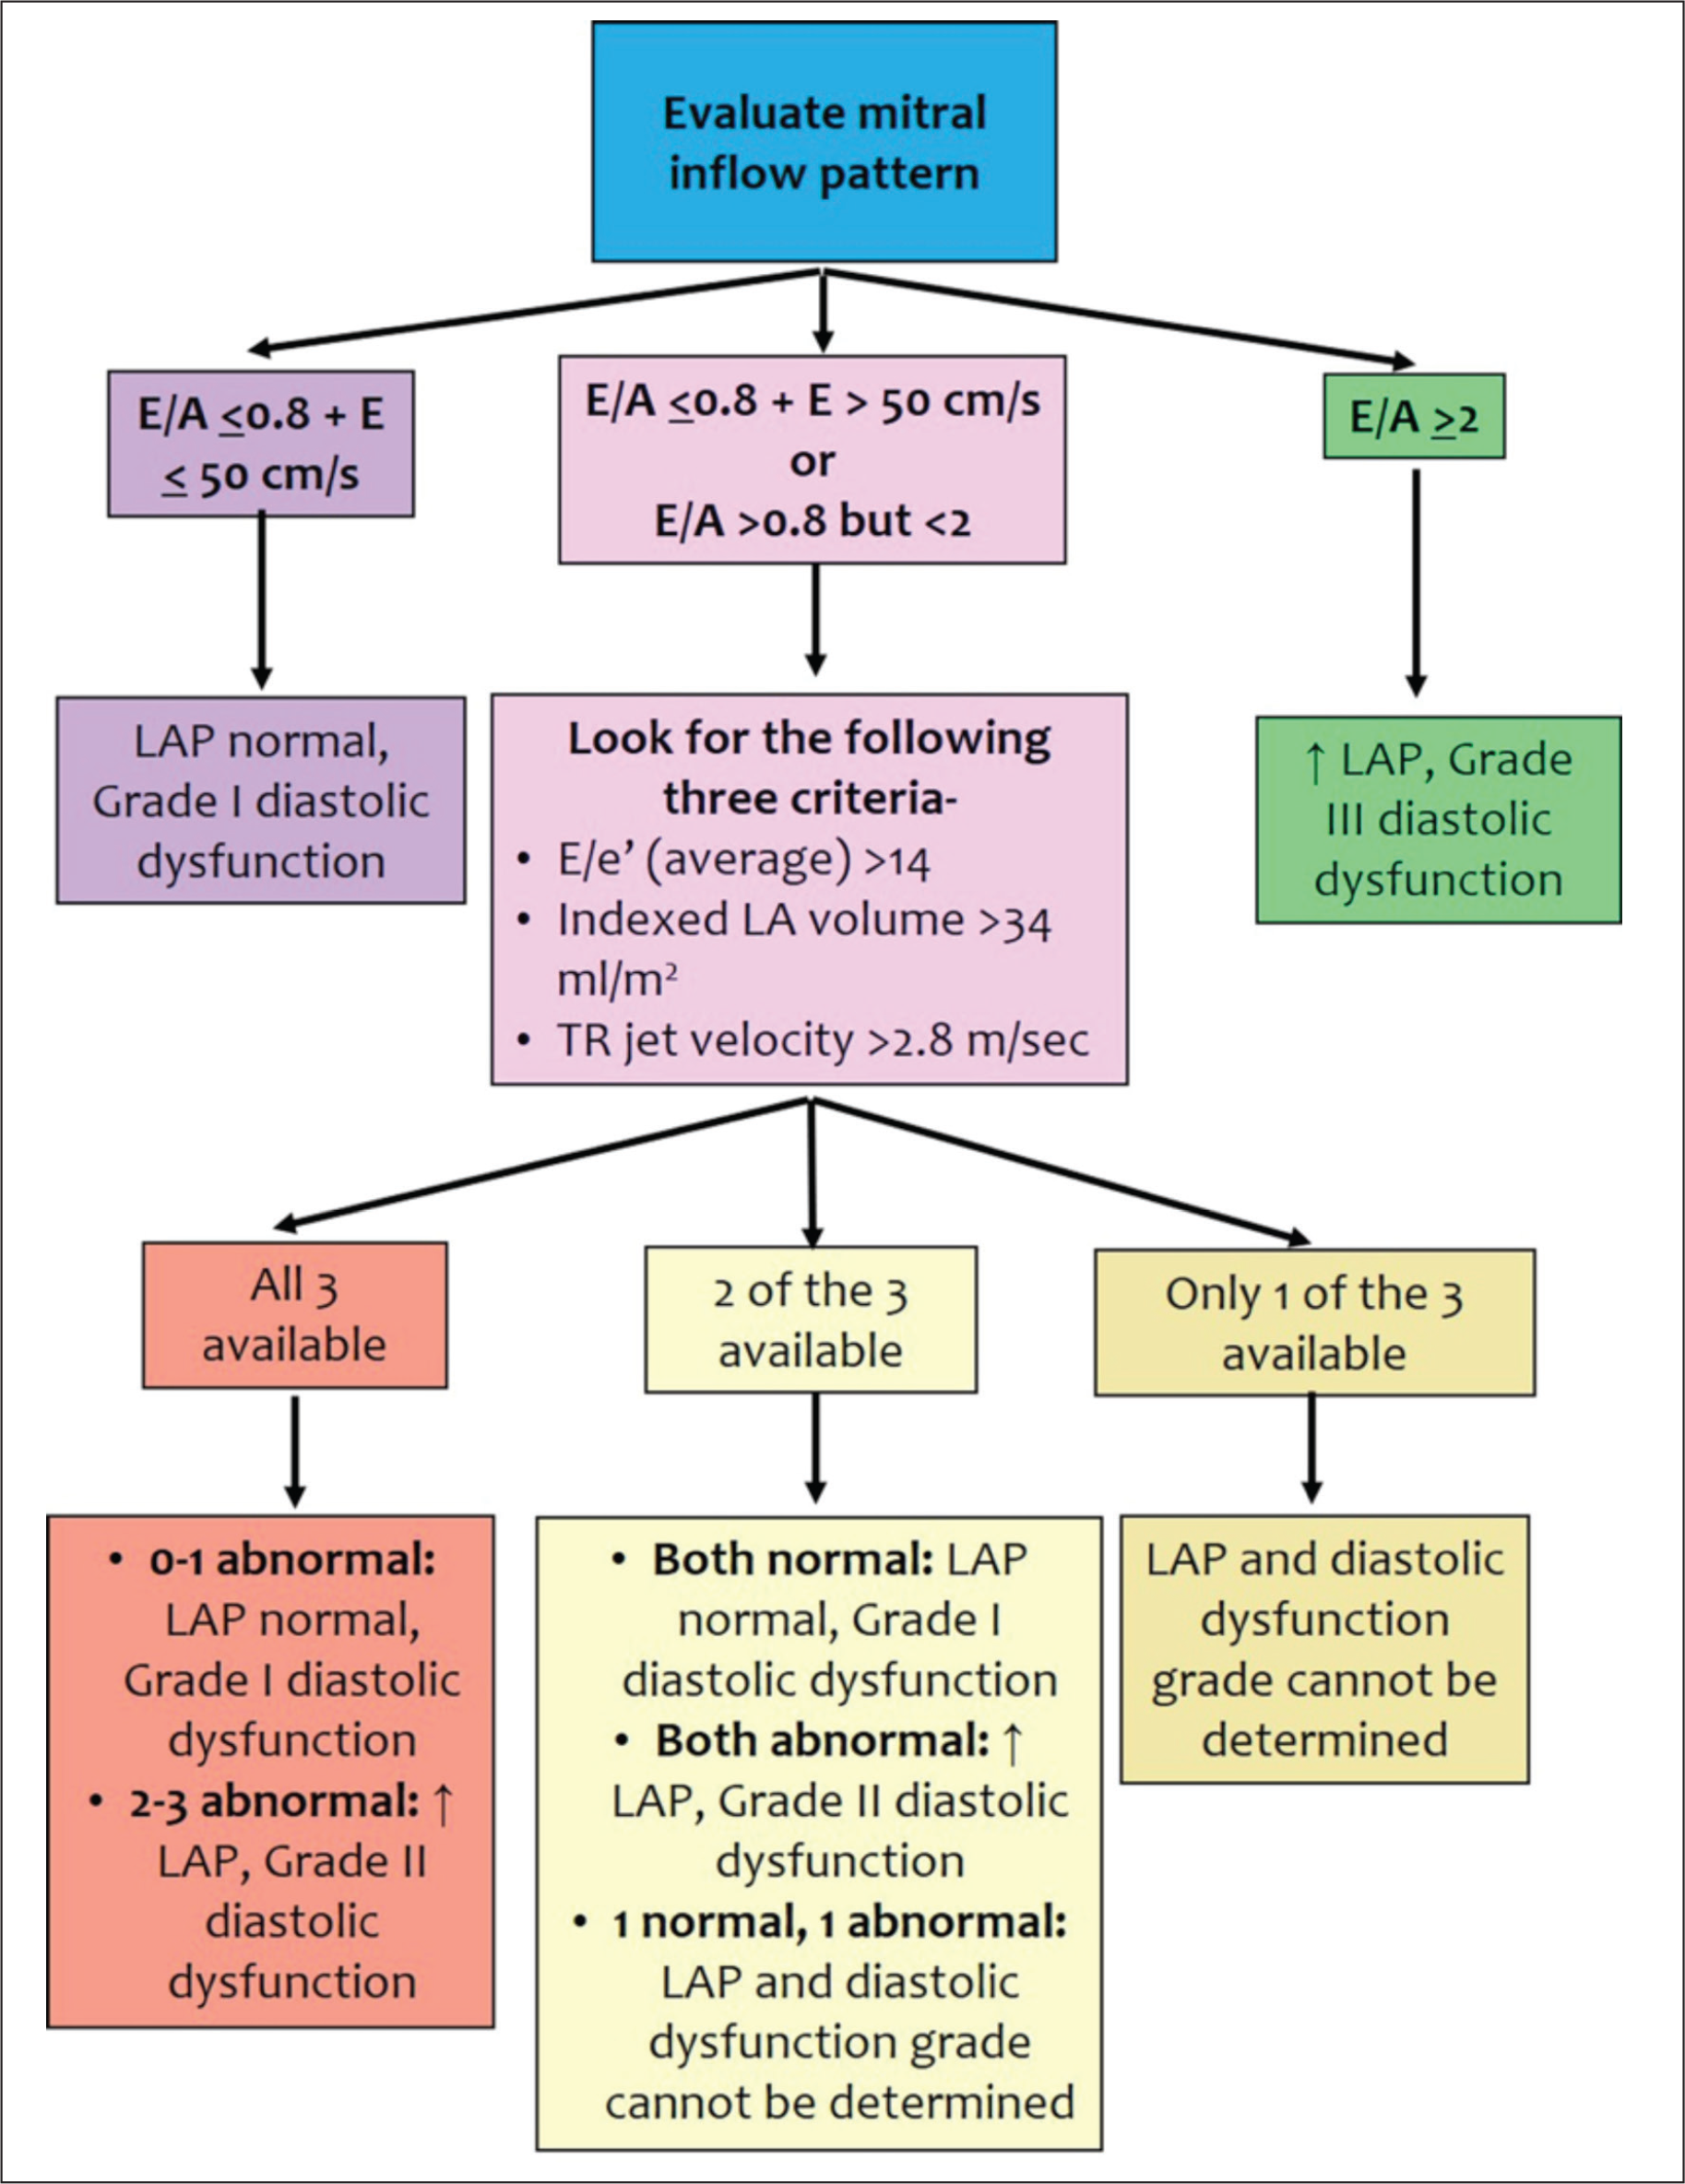
Evaluation of mitral inflow pattern, mitral annular early diastolic velocity, left atrial volume, and peak tricuspid regurgitation velocity can be used to estimate LV filling pressure in most patients with myocardial dysfunction. The American Society of Echocardiography has recommended an algorithm for this purpose (Figure 8). The LV filling pressure can also be estimated directly using the following equation, 30 which has been shown to have fair accuracy in patients with reduced LVEF. 31
Mean LA pressure = 1.24 × [E/e’] + 1.9,
where E is early diastolic mitral inflow velocity and e’ is mitral annular early diastolic velocity (average of septal and lateral values).
Pulmonary Artery Pressures
PA systolic pressure (PASP) is the most commonly estimated intracardiac pressure during echocardiography. It is derived from tricuspid regurgitation (TR) jet using the simplified Bernoulli equation as:
PASP (mmHg) = RV systolic pressure (mmHg) = 4 × [Peak TR velocity (m/sec)2] + mean RA pressure (mmHg)
However, interpretable TR waveforms are available only in approximately 80% of cases. 32 The use of saline contrast is often helpful in increasing the yield.22, 33 Underestimation of TR velocities by nonparallel ultrasound interrogation or incomplete flow profiles are common errors. Conversely, overestimation of PASP may also occur because of overestimation of RA pressure or inherent inaccuracies in the simplified Bernoulli equation due to pressure recovery phenomenon or changes in blood viscosity from anemia or hypoxemia. 34 For these reasons, several investigators prefer reporting only peak TR gradient, instead of deriving PASP from it.
PA diastolic pressure can be estimated from pulmonary regurgitation (PR) jet, if present. The end-diastolic PR gradient reflects pressure difference between pulmonary artery and the right ventricle. Since end-diastolic RV pressure is similar to RA pressure (in the absence of tricuspid stenosis), adding RA pressure to PR end-diastolic gradient yields the PA end-diastolic pressure.
Estimation of mean PA pressure by echocardiography is difficult as there is no direct method available for this purpose. Several indirect methods have been proposed but each has its own fallacies. 35 Following are the commonly used methods:
From TR jet
Mean PA pressure (mmHg) = TR mean gradient (mmHg) + RA pressure (mmHg) Mean PA pressure (mmHg) = 0.61 × PASP + 2 (several different versions of this equation have been recommended by different investigators)
35
From PR jet
Mean PA pressure (mmHg) = 4 × [peak PR velocity (m/sec)
2
] The addition of RA pressure has been shown to increase the accuracy of this method from a mean of -8 mm Hg to within +1 mm Hg of catheterization-derived measurements
36
Mean PA pressure (mmHg) = 4 × [peak PR velocity (m/sec)
2
] + RA pressure
From RV outflow tract (RVOT) acceleration time:
Role of Transesophageal Echocardiography
TEE is required in patients in whom transthoracic echocardiography is unable to provide adequate images, as in situations like pneumothorax, mechanically ventilated patients, immediate postoperative state, severe chest wall deformation/injury, or emphysematous lungs, etc. Also, TEE can be the first-choice modality in specific clinical scenarios (eg, acute aortic syndrome, acute valvular regurgitation, acute prosthetic valve dysfunction, acute massive pulmonary embolism, hemodynamically unstable atrial fibrillation/flutter requiring cardioversion, etc.) that require visualization of cardiac structures which are much better seen on TEE.
Conclusion
Cardiogenic shock is a highly common clinical entity and is characterized by high mortality. Prompt assessment and management are crucial for improving outcomes of the patients presenting with cardiogenic shock. Echocardiography is perhaps the most useful diagnostic modality in this setting, due to its ability to provide comprehensive information about cardiac structure and function, promptly, safely, and at the patient’s bedside.
Footnotes
Declaration of Conflicting Interests
The authors declared no potential conflicts of interest with respect to the research, authorship, and/or publication of this article.
Funding
The authors received no financial support for the research, authorship, and/or publication of this article.