
Abstract
Background
To evaluate whether machine learning (ML) methods (Elastic Net (EN), eXtreme Gradient Boosting (XGBoost), Feed Forward Neural Net (FNN)) can improve claims-based inpatient quality measurement by Logistic Regression.
Methods
This retrospective cohort study used German claims data from the years 2015-2021. The study population encompassed inpatient cases of acute myocardial infarction (n = 165,130) and proximal humerus fracture (n = 34,912), for which quality related outcomes were assessed. The performances of risk adjustment models based on machine learning methods (EN, XGBoost, FNN) were compared to stepwise backwards Logistic Regression by Receiver Operating Characteristics-Area under the Curve (ROC-AUC), Precision Recall-Area under the Curve (PR-AUC), Brier Score (BS). The institution-specific quality was measured by Standardised Mortality Ratios (SMR) which were used to visualise the impact of the tested methods on quality assessment.
Results
For most of the outcomes none or only marginal gains were found for the machine learning methods. Highest gain in model performance showed the FNN in comparison to Logistic Regression with a gain in ROC-AUC of 2.4%, in PR-AUC of 4.5%, and slightly in the BS with a loss of 0.007. The FNN was followed by XGBoost with a gain in ROC-AUC of 2.3%, anyhow this improvement was not reflected in a lower BS.
Conclusions
None of the machine learning methods tested is generally superior for creating quality indicators. Marginal gain in model performance should not be the main basis for choosing an adequate method; instead, interpretability should be emphasised, especially when dealing with new datasets with little knowledge of important risk factors.
Keywords
Introduction
Claims-based quality assessment in healthcare is fundamental for evaluating and improving the effectiveness of medical treatments and services.1–5 The longitudinal structure of claims data allows a retrospective analysis of treatment courses, risk factors and outcomes. Since the risk profiles of patients can differ profoundly between hospitals an appropriate risk adjustment is essential when it comes to comparative hospital quality assessment. Such appropriate risk adjustment takes into account the initial health situation of patients at the start of treatment and thus enables a comparison of hospitals that treat patients with different degrees of illness. To date, the widely used gold standard for modelling and risk adjustment of quality indicators has been multivariable Logistic Regression using stepwise backwards selection because of their ease of use and interpretability of the regression coefficients.1–8
ML methods hold the potential to improve model performance and risk adjustment for a comprehensive quality assessment and analysis in big data sets compared to the current standard of Logistic Regression and by that might make quality indicators more precise. But a rigorous evaluation of the model’s performances with the task of risk adjustment is necessary because of its significant impact on spending, resource allocation and performance measurement. Therefore, this study aimed at comparing the model performance of the ML methods EN, XGBoost and FNN to the model performance of a Logistic Regression and assesses their impact on hospital rankings.
In this retrospective cohort study German claims data from the years 2015–2021 were used to develop and evaluate quality indicators for the two inpatient treatment causes of acute myocardial infarction (AMI), and endoprosthetic and osteosynthetic treatment of proximal humerus fractures (PHF).
Methods
Data pool
German statutory health insurance data (claims data, SHI) (2015–2021) were supplied by the AOK Research Institute (WIdO); the data were derived from 11 local health care funds (AOK – Die Gesundheitskasse) covering data of 27 million German patients in total. Diagnoses of the claims data follow the 10th International Classification of Diseases German Modification (ICD-10-GM), procedures are coded according to the German version of the International Classification of Procedures in Medicine, known as operation and procedure code (OPS) and pharmacotherapy is coded by the German modification of the Anatomical Therapeutic Chemical (ATC) classification system. These codes are compliant with reimbursement guidelines and were reviewed by the Medical Review Board of the Health Insurance Funds.
The retrospective claims data encompassed demographic, medical, cost, pharmacotherapy and physiotherapy details for both inpatient and outpatient treatments. The years 2015–2016 were considered as pre-observation period for the index hospitalisation (index stay) which was required to have occurred between 2017 and 2020. The year 2021 was defined as the follow-up period subsequent to the index stay.
An ethics vote from the Ethics Committee at the Technical University of Dresden (BO-EK-175042022) was obtained. The study complies with the Declaration of Helsinki and the recommendations of Good Practice Secondary Data Analysis (GPS) and Good Epidemiological Practice (GEP).9–11
Inclusion criteria, risk factors and outcomes
Quality models for assessing quality outcomes, incorporating relevant timeframes and risk factors, were developed by medical expert panels based on clinical expertise for both inpatient treatment causes. This procedure based on medical expert knowledge for creating specific risk factors for each treatment cause instead of using all available variables as input for the ML methods was chosen, because in the case of quality assessment it is crucial to differentiate between variables, which describe the initial condition of the patients and conditions which could be influenced by the medical treatment or other care site-specific procedures. Only variables which describe the initial condition of the patient are valid risk factors for comparative quality assessment.
Patient risk profiles were evaluated by claims data including ICD-10-GM, OPS codes and ATC codes (only outpatient stays) from both inpatient and outpatient stays to identify risk factors during the pre-observation period and the index stay. The definition of outcomes was based on ICD-10-GM and OPS codes recorded during the index stay and any subsequent inpatient stays within the 365-day follow-up period after admission. The timeframe of each outcome was selected to ensure that the outcome can be linked to the index stay, making them suitable for quality measurement.
Inclusion and exclusion criteria for both treatment causes.
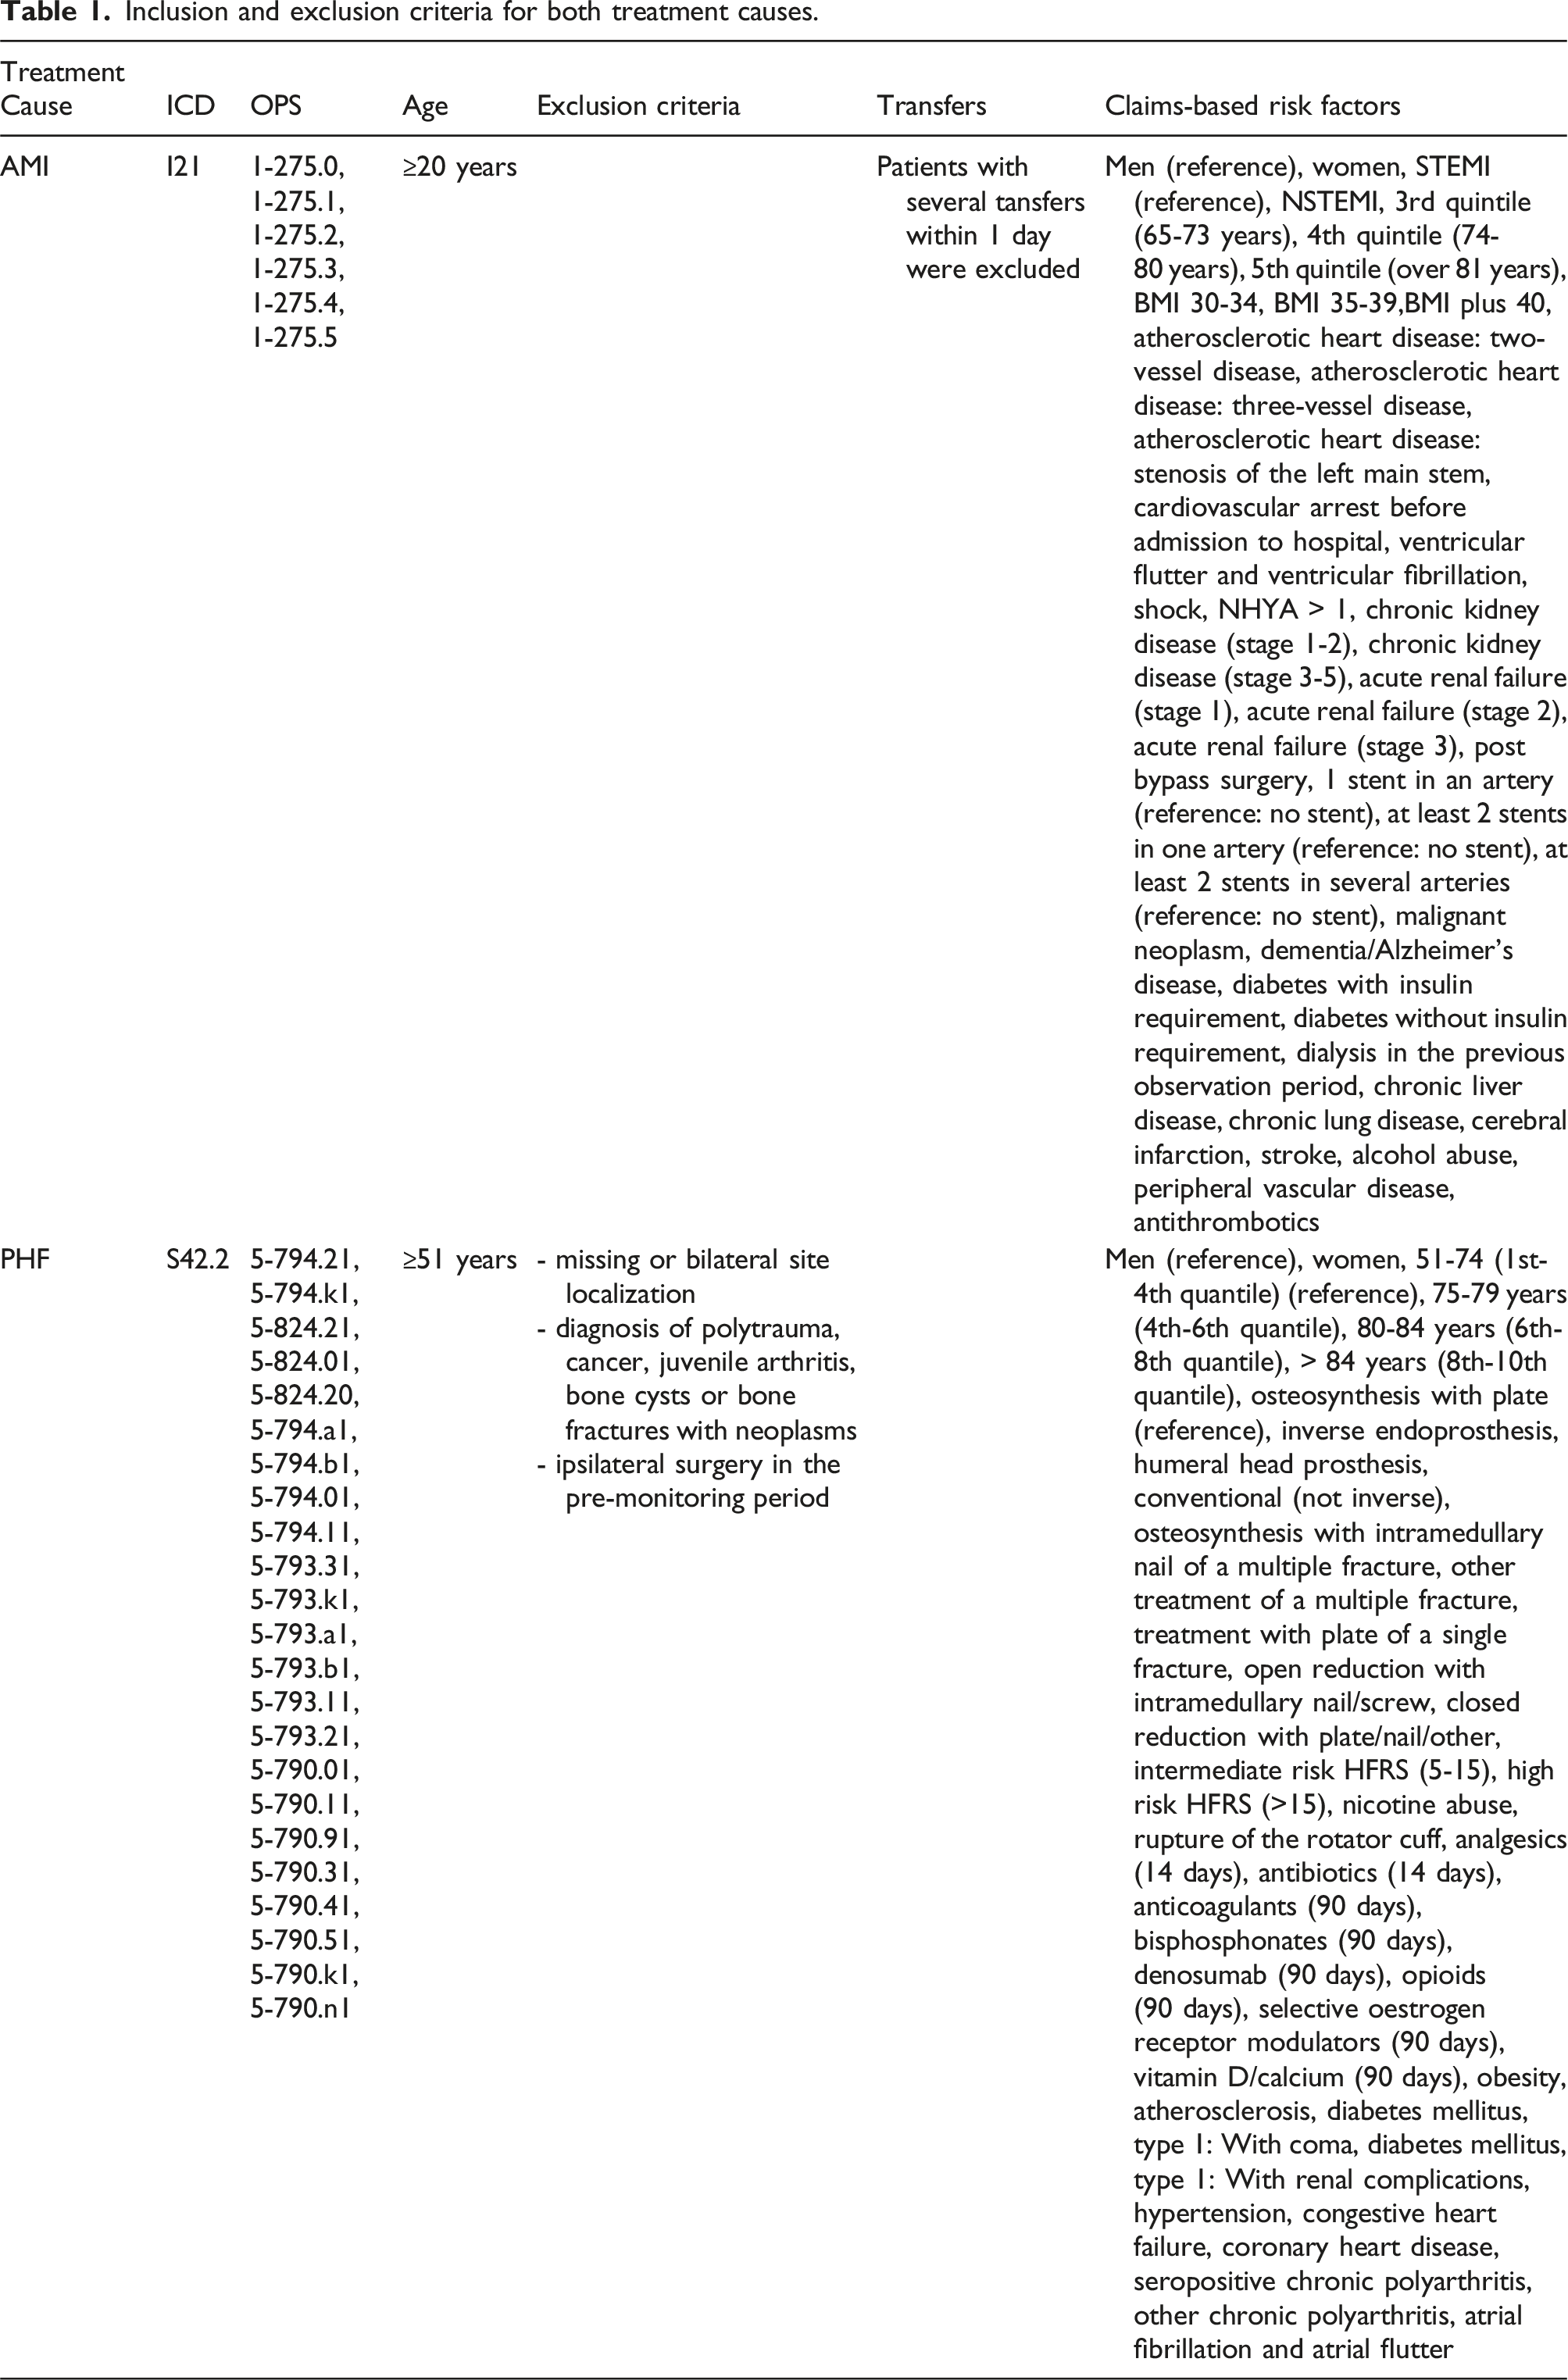
The assessed risk factors incorporated among others age, gender, body mass index (BMI), STEMI/NSTEMI classification, coronary diagnostics & interventional procedures, cardiovascular history, clinical representation, extent of coronary artery disease, risk factors, comorbidities and antithrombotic use (Table 1).
For PHF, all inpatient cases with a primary diagnosis of PHF (ICD-10-GM S42.2) and a procedure code for arthroplasty or osteosynthetic treatment were included and categorised into eight different types of treatment. The assessed risk factors incorporated among others age, gender, type of treatment, comorbidities in the pre-monitoring period (outpatient & inpatient), pharmacotherapy in the pre-monitoring period (90/14 days before index), Elixhauser comorbidities and the Hospital Frailty Risk Score (HFRS; German modification) 12 in the index stay (Table 1).
The following outcome definitions were based on ICD-10-GM codes and OPS codes recorded during the index stay and subsequent inpatient stays within the 365-day follow-up period after admission: • AMI: Death within 30 days, major adverse cardiac and cerebrovascular events (MACCE) within 30 days, MACCE plus cardiac insufficiency within 30 days, MACCE within 365 days, MACCE plus cardiac insufficiency within 365 days • PHF: Death during the index stay, death within 90 days, early surgical complications & revisions within 90 days, surgical complications & revisions within 365 days, general complications during the index stay, general complications within 90 days, other complications during the index stay, any secondary surgery within 365 days
Data analysis
Raw data was aggregated on patient level. Risk factors and outcomes were encoded as distinct dichotomous categorical variables using dummy coding (0/1). Patient age was divided into quantiles. During data preparation, variables with near-zero variance (variance<0.005) were excluded and remaining variables were assessed for high variation inflation factors (>3.5) and correlations exceeding 0.7 between risk factors. In the case of correlations above 0.7, the most frequent variable was always retained.
Quality indicators were built by the gold standard of clustered multivariable Logistic Regression using stepwise backwards selection (p < .04). As the internal variance within a care site tends to be lower than between care sites, a cluster effect and robust sandwich estimators from Huber and White were incorporated. 13
The model performance of the Logistic Regression was compared to an EN, XGBoost and simple FNN. For these ML methods, the hyperparameter were tuned via grid search. Model training was performed for all models on a randomly selected training dataset of 80% stratified by the respective outcome and model testing on the remaining 20%.
Model performances were compared using ROC-AUC (Receiver Operating Characteristic-Area Under the Curve), PR-AUC (Precision Recall-Area Under the Curve), and Brier Score (BS). To explore the impact of the model on quality assessment, standardised mortality/morbidity ratios (SMR) with 95% confidence intervals were calculated on care site level. The SMR value for a care site represents the ratio of observed events to expected events. Values between 0 and 1 indicate that fewer events occurred than expected, while values above 1 indicate a higher number of observed events than anticipated. 14 The SMRs were compared using the Spearman rank correlation coefficient to establish care site-specific rankings. Care sites with fewer than 30 cases were excluded from the analyses.
All statistical analyses for AMI and PHF were performed using Python 3.10.4 alongside respective packages.
Results
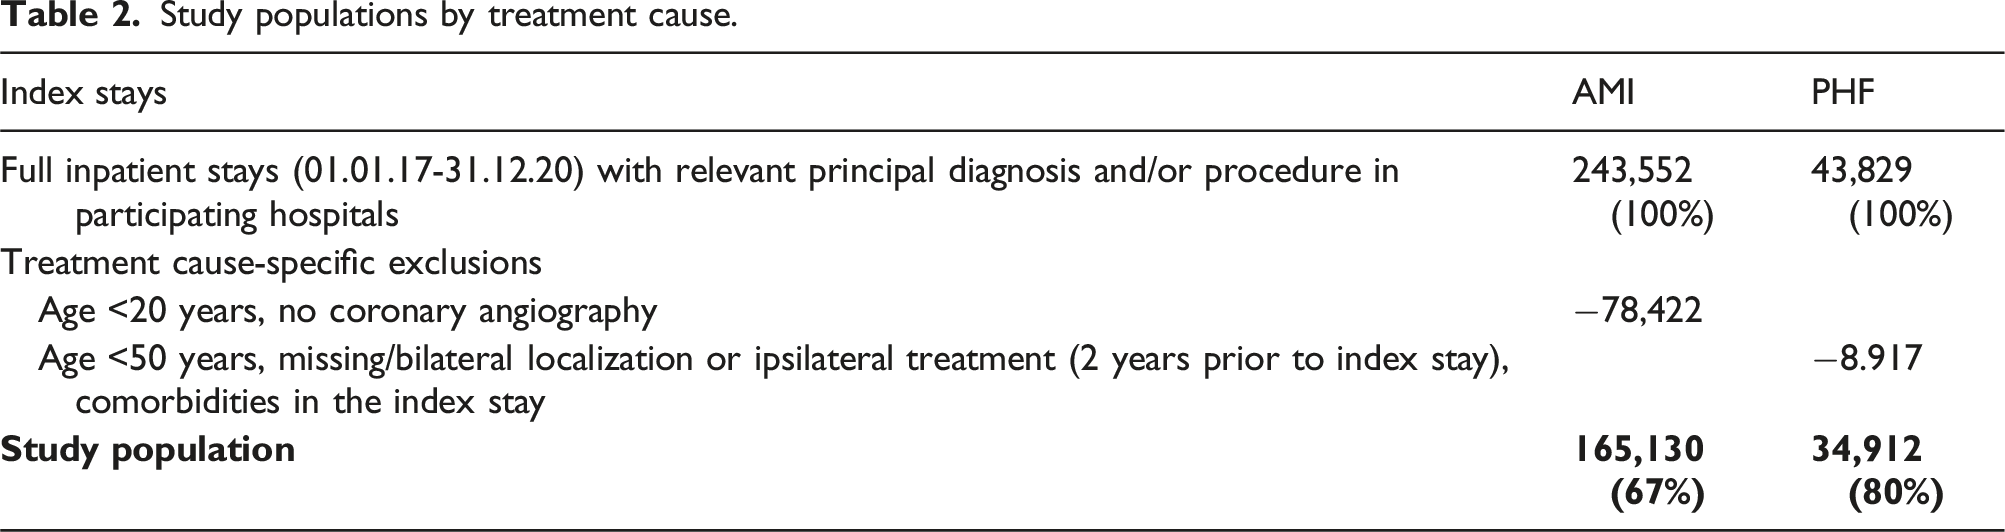
Study population
Study populations by treatment cause.
Model performance of the methods
Comparison of model performance of Logistic Regression, Elastic Net, XGBoost and Neural Net for both treatment causes.
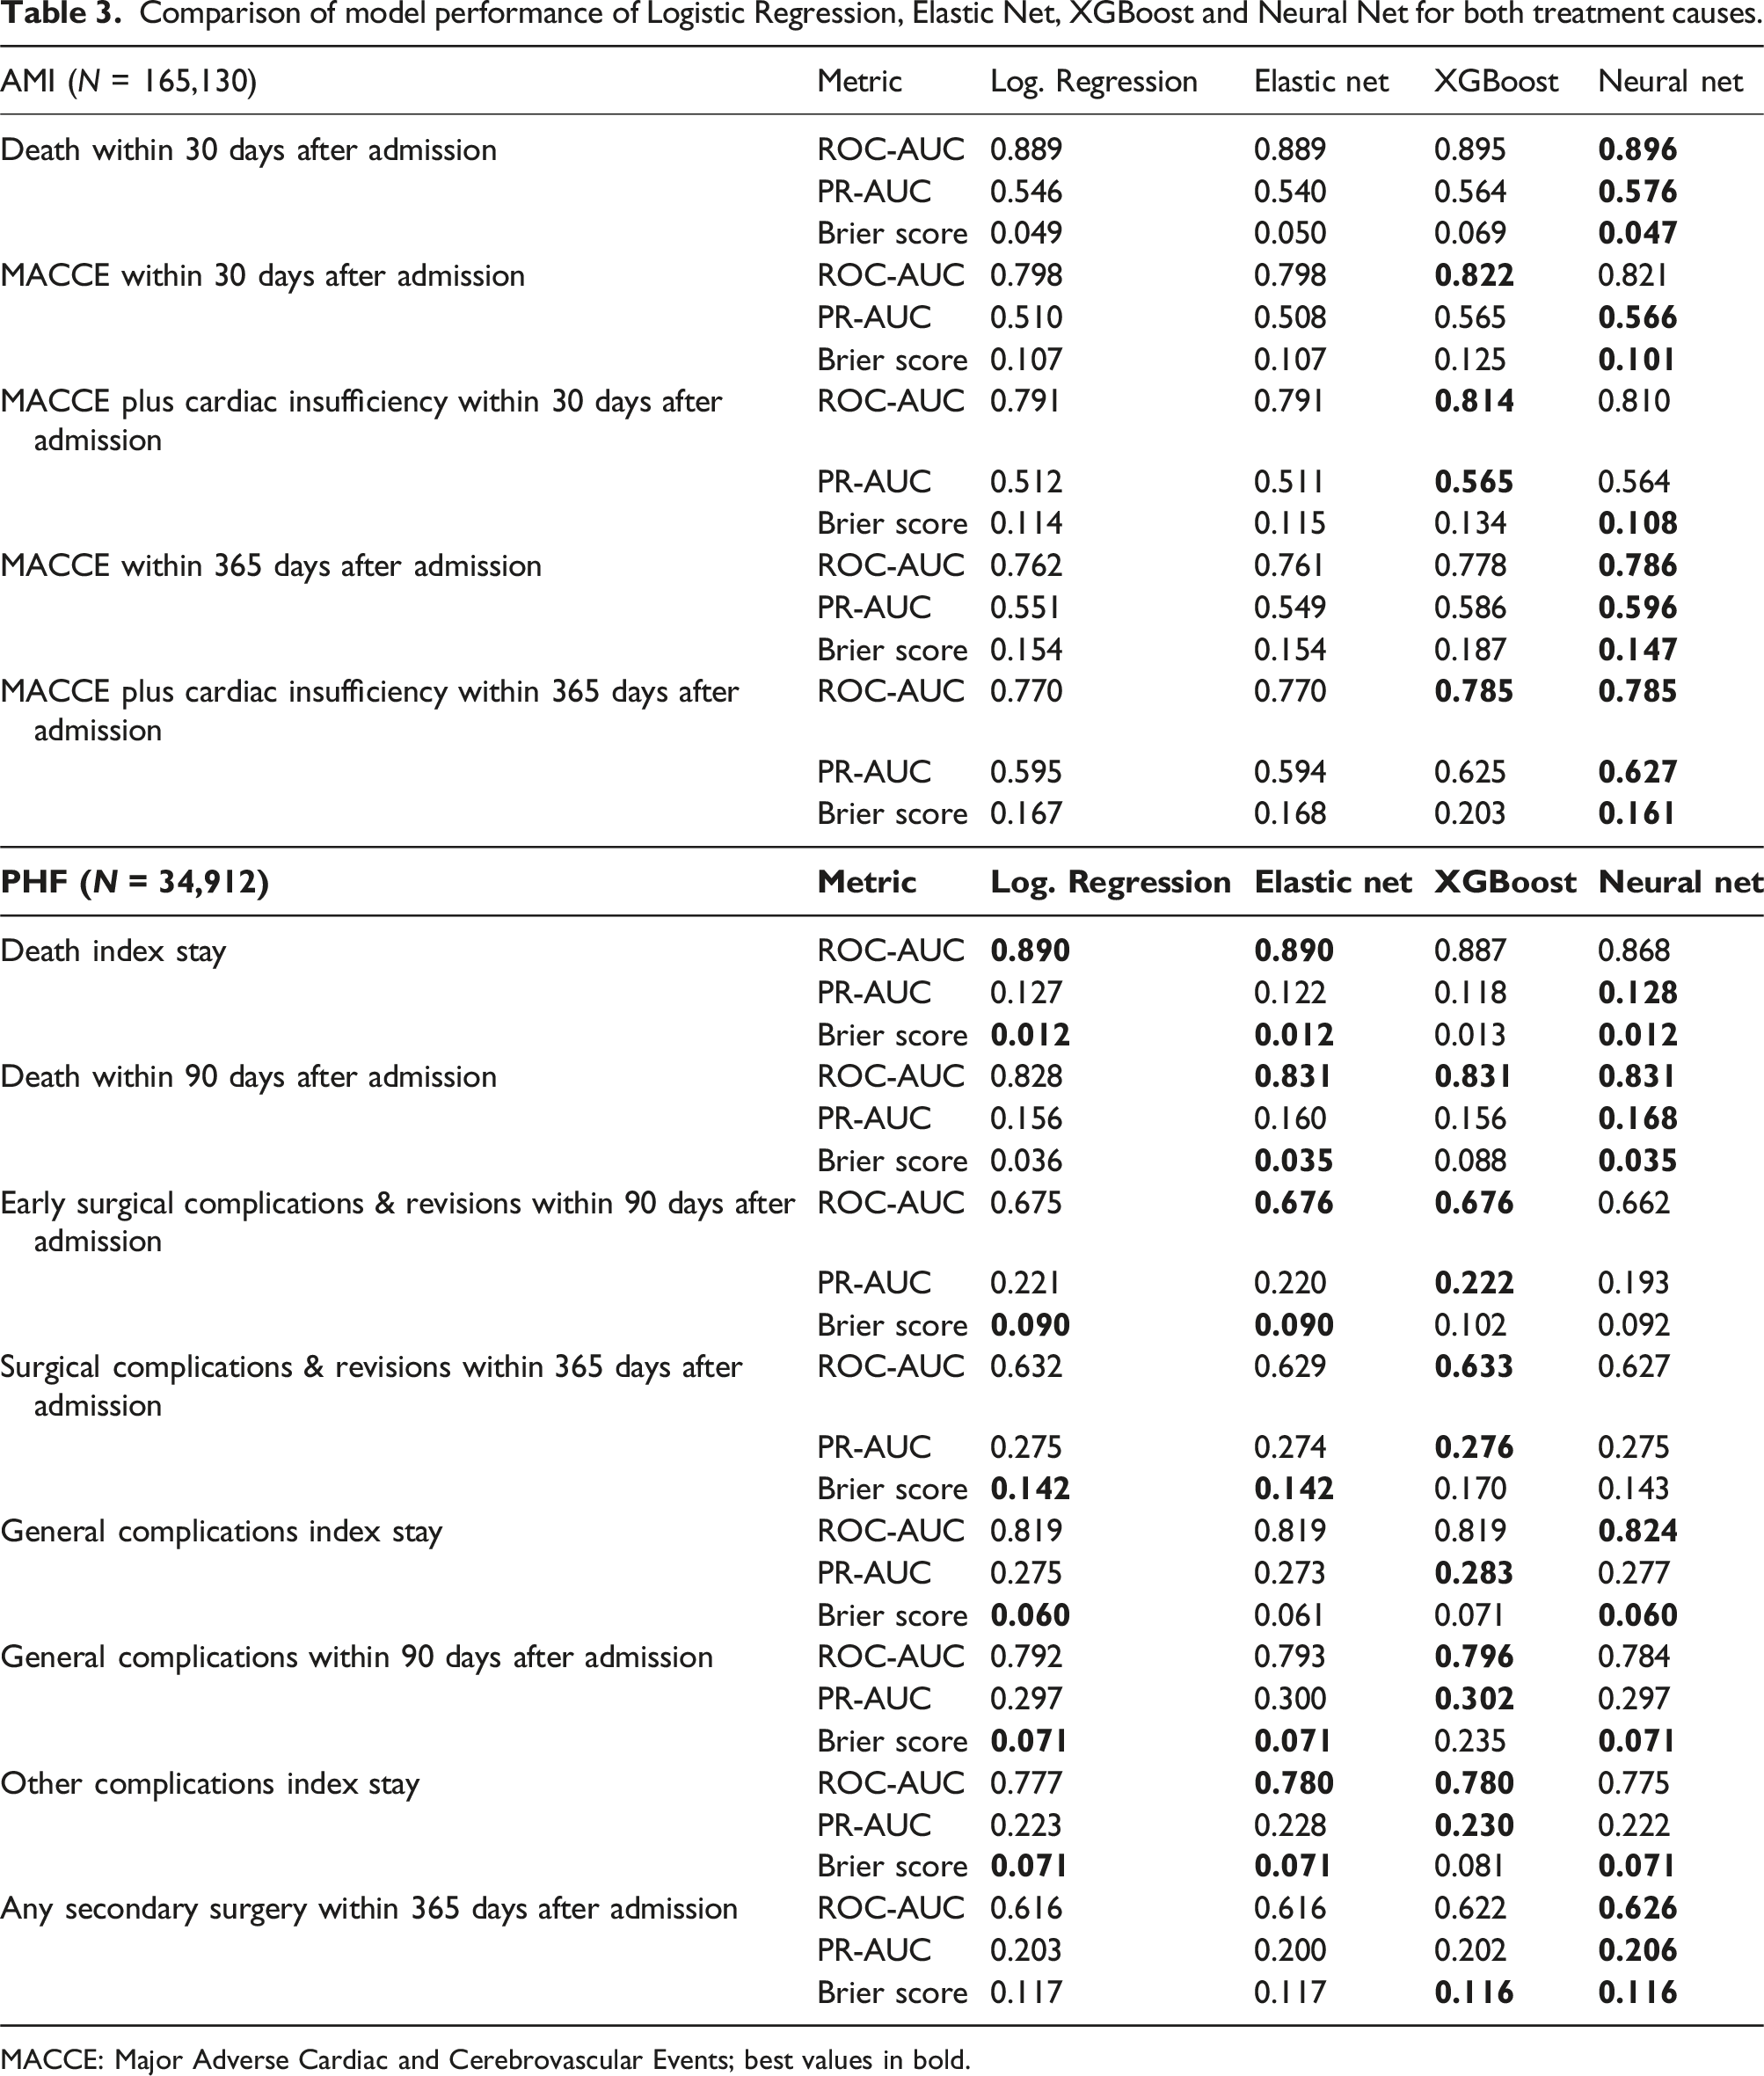
MACCE: Major Adverse Cardiac and Cerebrovascular Events; best values in bold.
For PHF (n = 34,912), the model performances were even more homogenous over all outcomes, with the highest improvement in ROC-AUC of 1.0% (FNN) for the outcome “any secondary surgery 365 days”. The FNN also performed best for the outcome “general complications index stay” plus 0.5% and for “death 90 days” plus 0.3%. For “surgical complications & revisions 365 days”, “general complications 90 days” and “other complications index stay” the best model performance was seen in XGBoost with plus 0.1%, 0.4% and 0.3% in ROC-AUC, respectively. Anyways, when comparing the BS for those outcomes the superior model was the EN. Moreover, the EN resulted in the best model performance with a 0.1% higher ROC-AUC value than the Logistic Regression for “early surgical complications & revisions 90 days”. For “death index stay”, none of the ML methods showed a superior model performance compared to the Logistic Regression (ROC-AUC 0.890).
Method impact on SMR-based hospital ranking
For AMI, the ranked SMR correlated strongly between the Logistic Regression and the respective best ML method with Spearman R from 0.97 (p < .001) for “MACCE within 365 days” and 0.98 (p < .001) for all other outcomes (Figure 1). Correlation of Standardised Mortality Ratios (SMR) and SMR ranking for treatment of acute myocardial infarction derived from the Logistic Regression versus the best outcome-specific machine learning method (ML).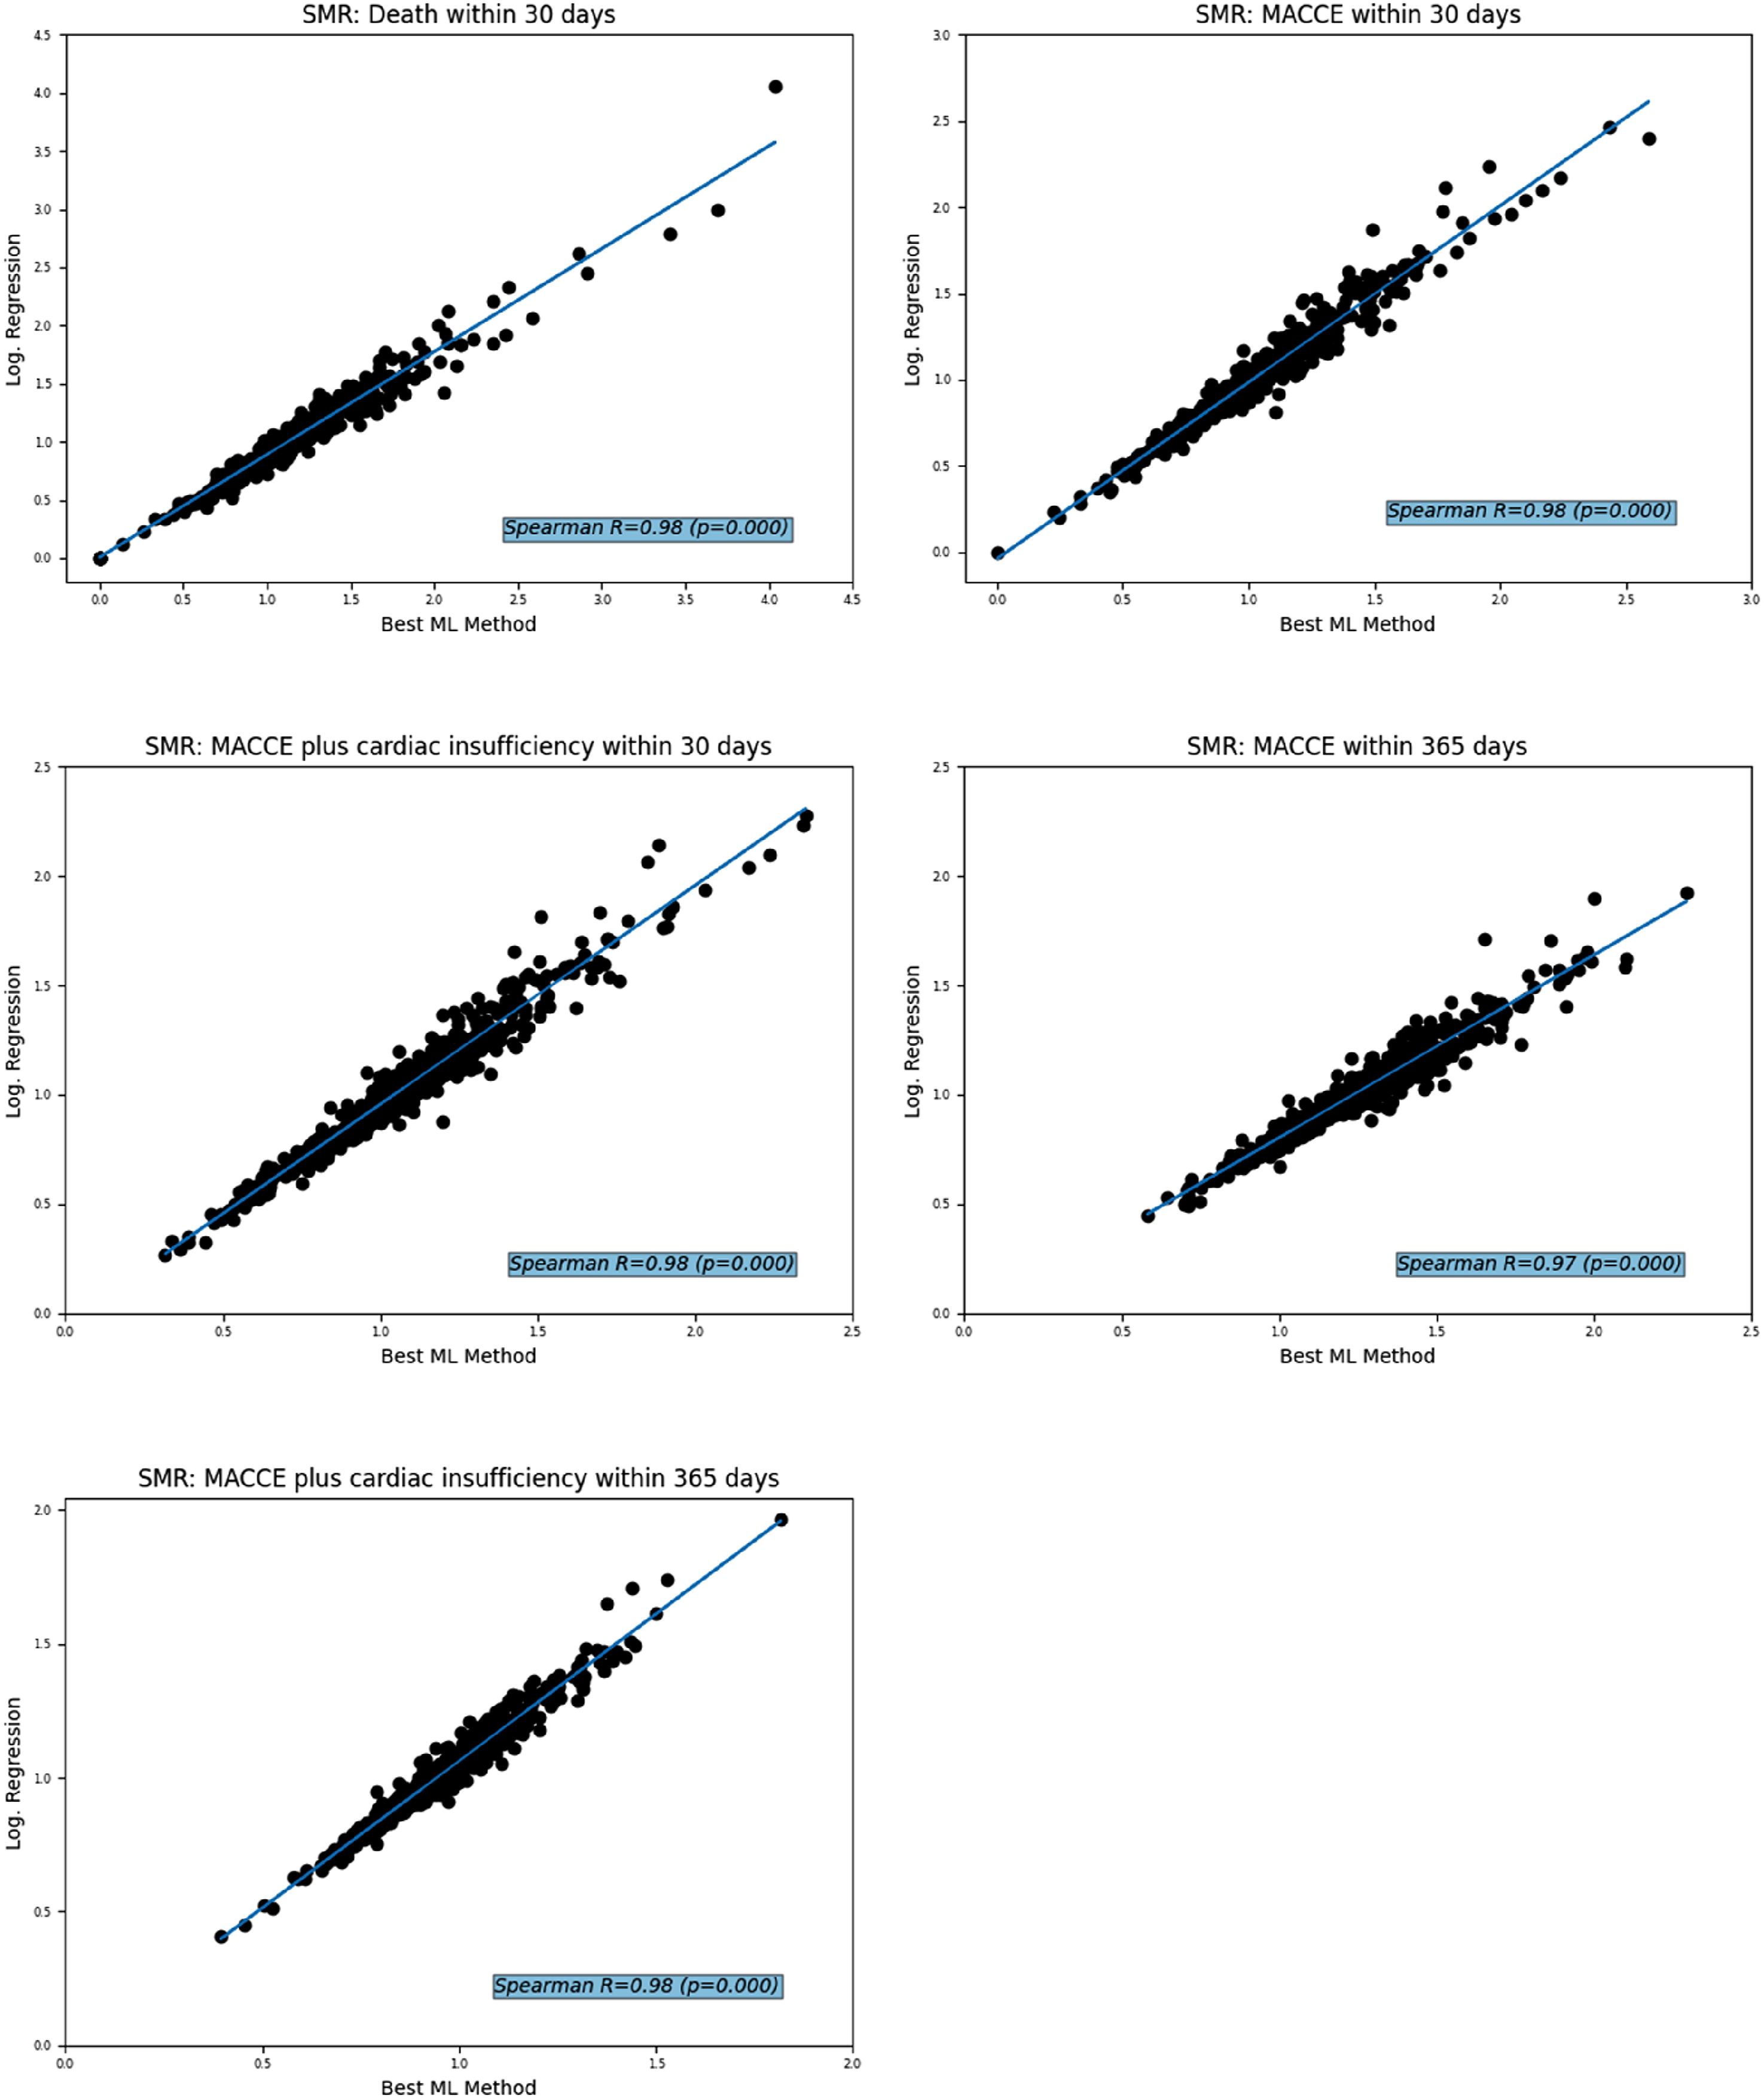
The same was observed in the PHF study population: the ranked SMR correlated strongly between the Logistic Regression and the respective best ML method, resulting in a Correlation of Standardised Mortality Ratios (SMR) and SMR ranking for treatment of proximal humerus fractures derived from the Logistic Regression versus the best outcome-specific machine learning method (ML).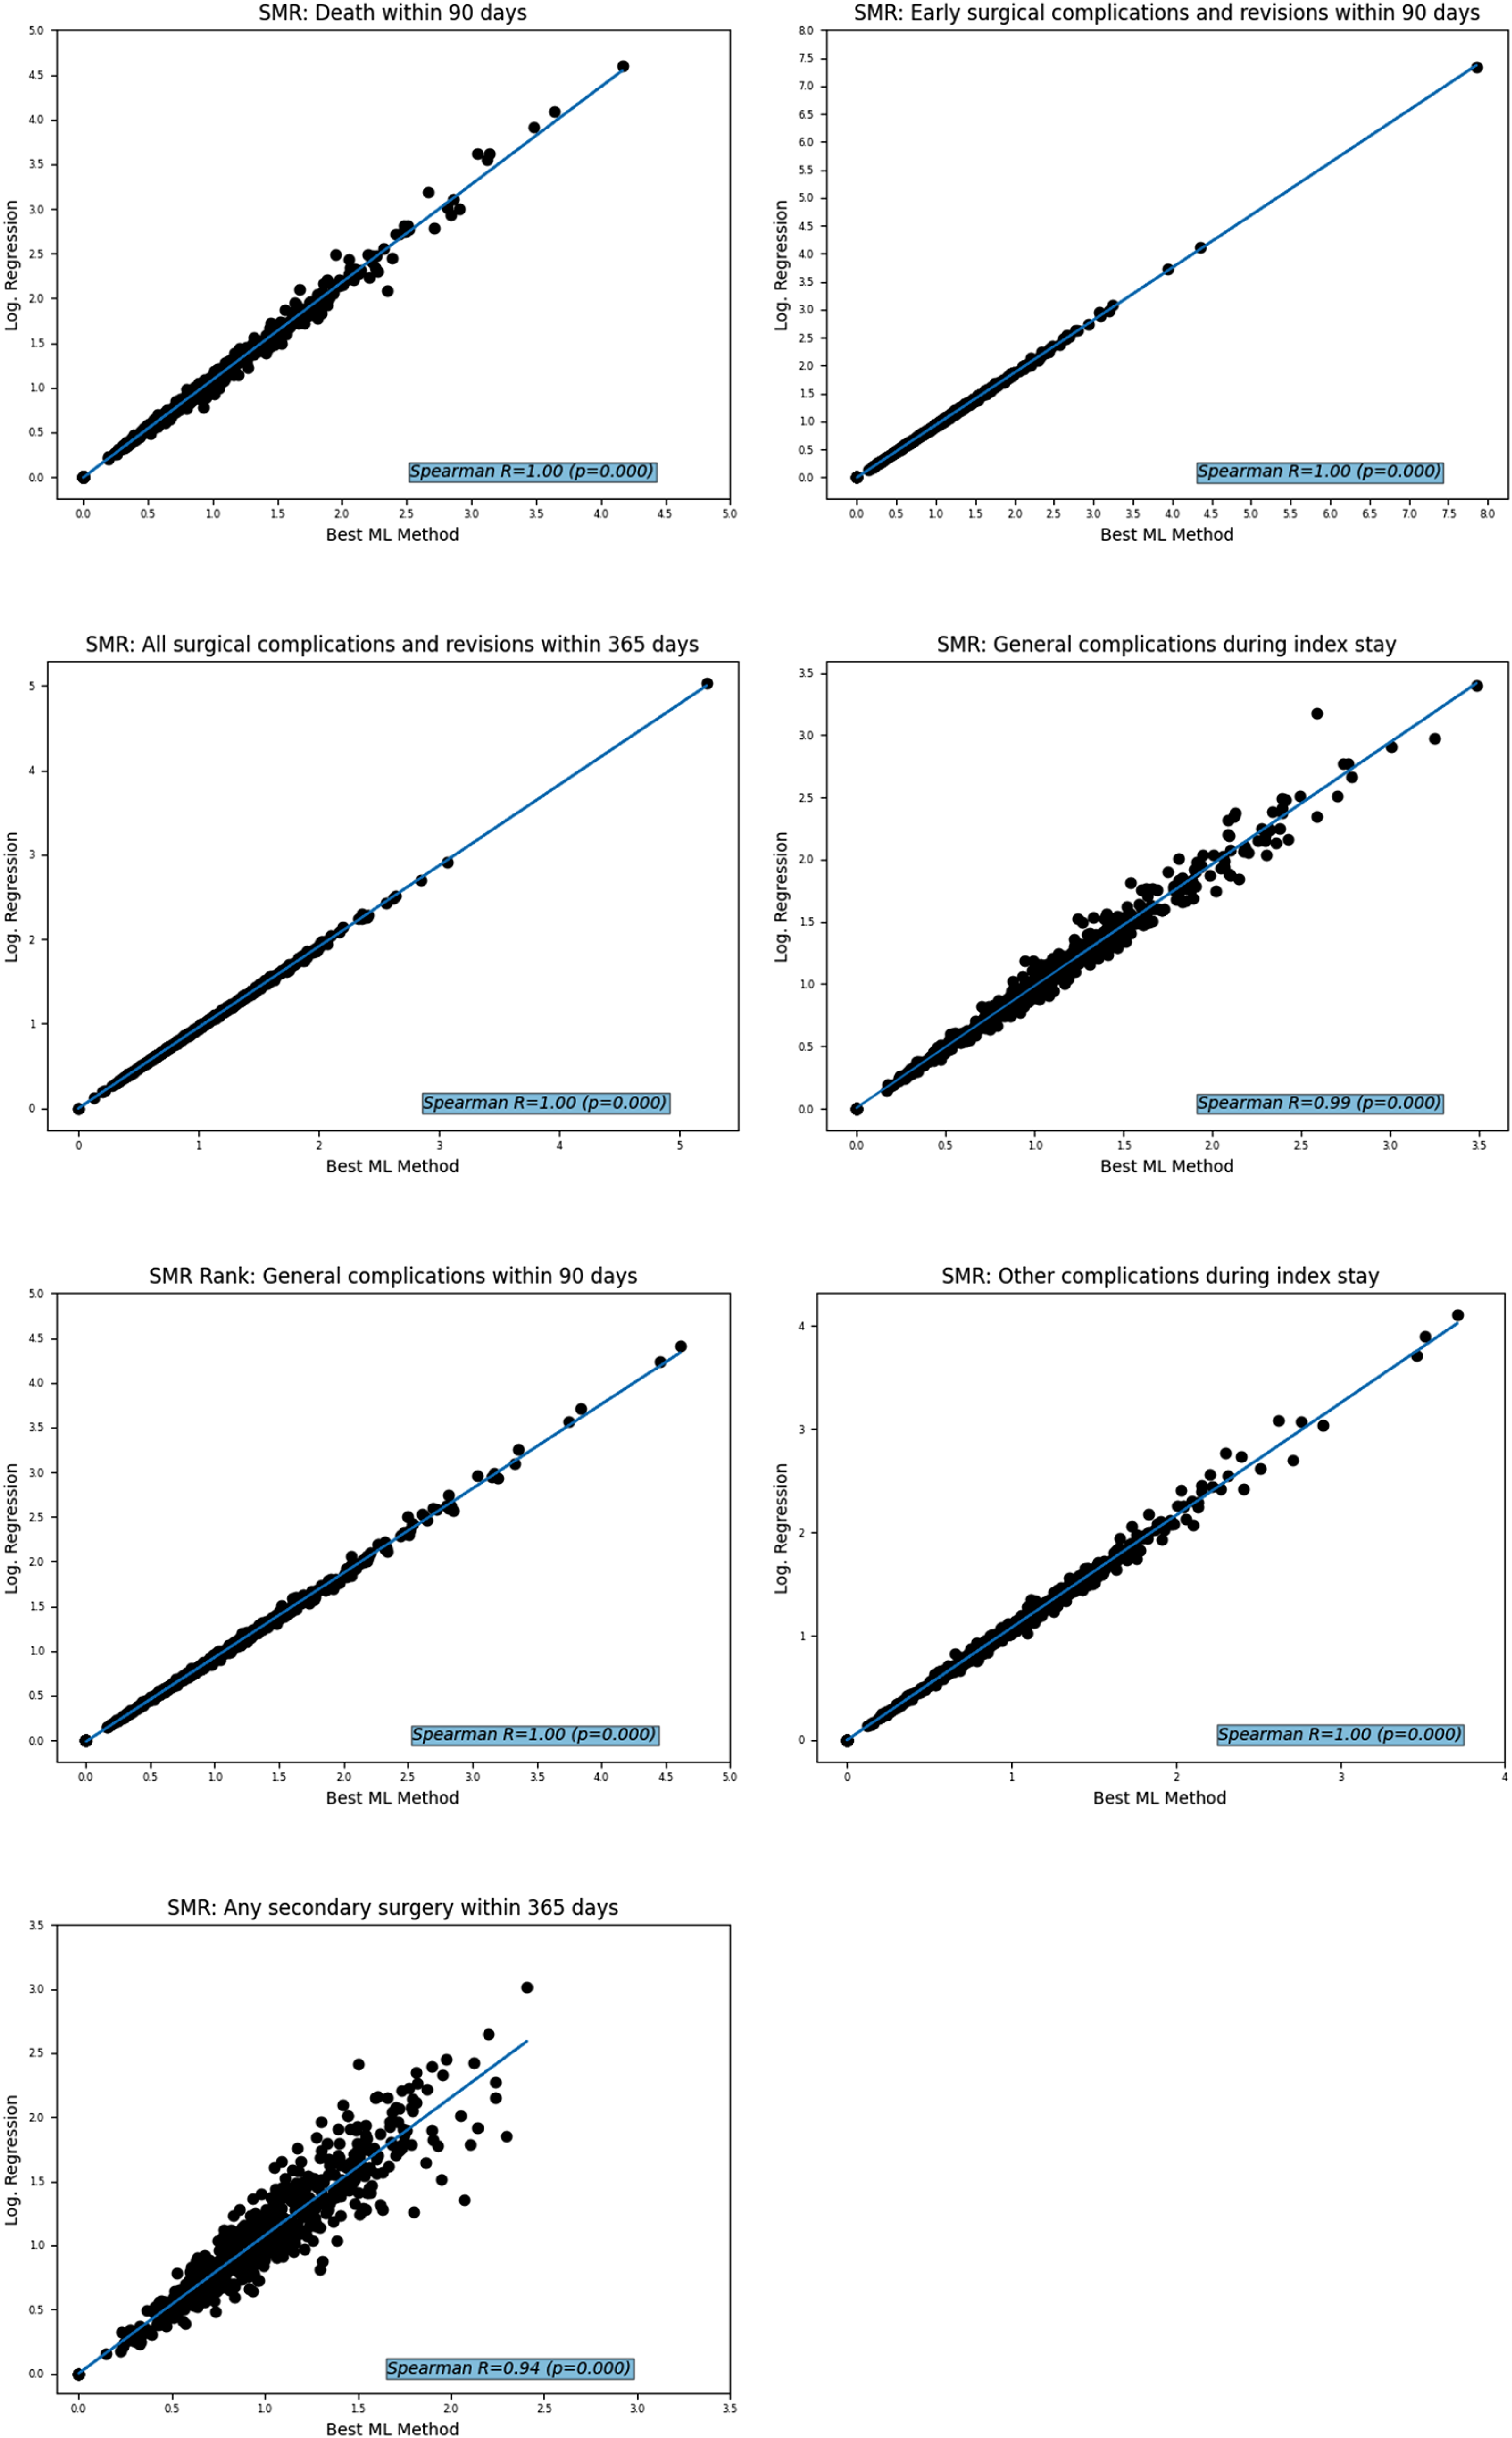
Discussion
In our analyses, the linked claims data were used to analyse whether ML learning methods can improve model performance compared to the gold standard of the Logistic Regression method. Care site-specific quality was assessed by Standardised Mortality Ratios (SMR) which were used to visualise the impact of the tested methods on quality measurement. The results show a heterogeneous pattern between the treatment causes and outcomes with regard to the choice of method. None of the AMI outcomes showed an improvement in ROC-AUC of more than 3% and for PHF more than 1% with any of the ML methods tested. Furthermore, the respective best method does not always show the best results in all compared metrics.
These results are in accordance with previous studies showing that the model with the best fit varies between datasets and selected outcomes.15–22 Therefore, selecting a specific model a priori could lead to poor model fits. While ML offers considerable advantages, especially when processing complex and high-dimensional data, traditional statistical models such as Logistic Regression are characterised by their clarity, simplicity and good interpretability, especially with well-defined smaller datasets. In the field of quality measurement with claims data, the good interpretability of the Logistic Regression as the main advantage over ML methods can provide deeper insights into the plausibility and effect size of risk factors. This advantage in interpretability combined with the low requirements for computational power led to the conclusion that the Logistic Regression seems to be the most appropriate method for quality measurement with claims data.
However, the choice of an appropriate model may be critical depending on the dataset and outcome. To the best of our knowledge, this is the first study to attempt to improve claims-based inpatient quality measurement using the ML methods described here and from linked routine data using logistic regression. We therefore encourage all researchers in this field to conduct comparative modelling analyses when developing quality indicators.
Strengths and limitations
A strength is that the claims data used came from 11 legally independent AOK health insurance funds, covering around one third of the German population. Furthermore, although this analysis is based on nationwide claims data from the AOK, which represents more than a quarter of the population covered by SHI in Germany, there may be differences in age, gender, social status and morbidity to the German population. The indirect standardisation of the SMR helps to compensate for this effect. 23
Conclusion
None of the ML methods tested is generally superior to Logistic Regression for creating quality indicators on the given datasets. Marginal gains in model performance should not be the main basis for choosing a method; model interpretability should also be considered, especially for new datasets with little knowledge of important risk factors. In this respect, Logistic Regression still seems favourable for risk adjustment in health care.
Footnotes
Declaration of conflicting interests
The author(s) declared the following potential conflicts of interest with respect to the research, authorship, and/or publication of this article: Jochen Schmitt reports institutional grants for investigator-initiated research from the German Federal Joint Committee (Gemeinsamer Bundesausschuss, GBA), Federal Ministry of Health (Bundesministerium für Gesundheit, BMG), Federal Ministry of Education and Research (Bundesministerium für Bildung und Forschung, BMBF), European Union (EU), Federal State of Saxony (SN), Novartis, Sanofi, ALK, and Pfizer. He also participated in advisory board meetings as a paid consultant for Sanofi, Lilly, and ALK. JS is a member of the Expert Council on Health and Care at the Federal Ministry of Health and a member of the government commission for modern and needs-based hospital care of the current German Coalition. All other authors report no conflicts of interest regarding the submitted work.
Funding
The author(s) disclosed receipt of the following financial support for the research, authorship, and/or publication of this article: The work was supported by the Innovation Fund of the Federal Joint Committee (Gemeinsamer Bundesausschuss, 01VSF20013)
Ethical statement
ORCID iDs
Data Availability Statement
The authors note that the data supporting the study results cannot be provided due to restrictions on the protection of personal data. External access to the data can be granted under the circumstances defined in German social law (SGB V § 287). For information and assistance in these cases, please contact