
Abstract
Background
The Health Technology Assessment agencies typically require an economic evaluation considering a lifetime horizon for interventions affecting survival. However, survival data are often censored and are typically analyzed assuming the censoring mechanism independent of the event process. This assumption may lead to biased results when the censoring mechanism is informative.
Methods
We propose a flexible approach to jointly model the participants experiencing an event and censored participants by incorporating the pattern-mixture (PM) model in the fractional polynomial (FP) model within the network meta-analysis (NMA) framework. We introduce the informative censoring hazard ratio parameter that quantifies the departure from the censored at random assumption. The FP-PM model is exemplified in an NMA of the overall survival from non-small cell lung carcinoma studies using Bayesian methods.
Results
The results on hazard ratio and survival from the FP-PM model are similar to those from the FP model. However, the posterior standard deviation of the hazard ratio is slightly greater when censored data are modeled because the uncertainty induced by censoring is naturally accounted for in the FP-PM model. The between-study standard deviation is almost identical in both models due to the low censoring rate across the studies. At the end of the corresponding studies, the informative censoring hazard ratio demonstrated a possible departure from the censored at random assumption for gefitinib and best supportive care.
Conclusions
The proposed method offers a comprehensive sensitivity analysis framework to examine the robustness of the NMA results to clinically plausible censoring scenarios.
Background
The Health Technology Assessment agencies typically require an economic evaluation considering a lifetime horizon for interventions affecting survival. Decision-making additionally requires comparisons of all relevant competing interventions. When multiple studies form a network of evidence comparing different treatments, directly and indirectly, the available evidence can be synthesized employing network meta-analysis (NMA). 1 Network meta-analysis provides an internally coherent set of relative treatment effects for all possible pairwise comparisons, assisting the interested stakeholders in deciding which intervention(s) should be considered for a specific disease. 2 However, accurately estimating the survival benefit associated with the new intervention compared to all relevant competing interventions becomes problematic when censoring occurs.
In the absence of individual participant data (IPD), the authors of systematic reviews resort to the reported hazard ratios (HR) and standard errors. These are usually estimated using either the Cox proportional hazards (PH) model, an approximation of the HR using log-rank analysis, or reconstructed data from published Kaplan-Meier (KM) curves.3,4 Cox PH regression is the most widely used model for time-to-event data for the simplicity of its assumptions: the HR is assumed to be constant over time (the PH assumption), and the relationship between the response variable in the logarithmic scale and the predictors is linear. 5 However, these assumptions are difficult to defend in practice, and the lack of their validity may lead to biased results.
Several methods have been proposed in the literature to synthesize time-to-event data as an alternative to the PH assumption, which provides one HR per pairwise comparison in the network. Initially, the use of parametric models was proposed, 6 which then was extended to the family of fractional polynomial (FP) models offering a multi-dimensional treatment effect approach.5,7 Saramago et al. 8 extended the NMA model to allow simultaneous synthesis of IPD and aggregate survival data, assuming that event times are Weibull distributed. However, the distribution assumption can only be assessed in IPD studies. A recent article proposed using restricted cubic splines without making distributional assumptions. 9 All the models proposed are applied in the Bayesian framework.
In the present study, we focus on the FP model of Jansen 7 as probably the most commonly used flexible survival model in the NMA framework. 10 The FP approach of Jansen 7 relies on aggregate data from digitized survival curves divided into multiple consecutive time intervals over the follow-up period. 7 The observed number of event times in each interval is then modeled as a function of the number of participants alive at time t, assuming all censoring occurs before death in the consecutive follow-up intervals. Censoring is a form of the missing participant outcome data (MOD) problem and is typically handled assuming the censoring mechanism independent of the event process, namely, non-informative censoring. 11 This is the censored at random (CAR) assumption. 11 Censored at random is an untestable assumption. It may result in imprecise absolute survival estimates, especially when the amount of censoring is substantial. 12 In practice, censoring is usually informative, introducing bias to the results when not addressed appropriately in the analysis. 13 For instance, exclusion and imputation of the censored participants are popular approaches for their simplicity. However, they are conceptually and statistically suboptimal for taking exclusion and imputation at face value and discounting the uncertainty induced by censoring, increasing the risk of biased conclusions. Therefore, it is imperative to investigate the robustness of the conclusions to different yet clinically plausible scenarios about the censoring mechanism while accounting for the uncertainty and maintaining the randomized sample size.
Statistical modeling of MOD has received attention in the last years for aggregate binary and continuous outcomes as an elegant framework that acknowledges the uncertainty about the assumed missingness scenarios (e.g., Mavridis et al., 14 Spineli et al., 15 and Turner et al. 16 ). This can be achieved under a model that reflects the distribution of the outcome in completers and missing participants, known as the pattern-mixture (PM) model. 17 Modeling MOD via the PM model provides biased-adjusted results and a thorough investigation of the underlying missingness mechanisms across different studies and interventions.15,16 The PM model incorporates an informative missingness parameter that quantifies the departure from the missing at random assumption, indicating whether the missingness mechanism may be informative.14–16 To our knowledge, the PM model has not been implemented in aggregate time-to-event data.
The present study aims to fill the methodological gap on properly addressing censoring in aggregate time-to-event data when access to IPD is not granted to allow for more sophisticated analyses. Specifically, we extend the FP modeling framework proposed by Jansen 7 for NMA to allow for the joint synthesis of observed and censored time-to-event data via the PM model, referred to as the FP-PM model. This extension designates a sensitivity framework that allows 'learning' about the censoring mechanisms in the network and provides bias-adjusted NMA results while accounting for the uncertainty induced by censoring. 10 The article is organized as follows. First, we introduce the motivating example, and present the FP and Bayesian random-effects NMA models for a time-to-event outcome without censored participants (as described in Jansen 7 ). Then, we expand the model to incorporate censoring through the PM model (the FP-PM model). We illustrate the FP model after excluding the censored participants and the FP-PM model under the ‘on average' CAR assumption. We discuss the findings and limitations of the study and conclude with recommendations.
Motivating example
As a motivating example, we revisit the example considered in Jansen.
7
The author compared four therapies (best supportive care (BSC), gefitinib, pemetrexed, and docetaxel) in participants with non-small cell lung cancer (Figure 1). The example included seven two-arm studies18–24 with 3,288 participants (median: 342, interquartile range (IQR): 156−530). The median follow-up time was 11 months, with IQR from 9 to 18. The censoring in the network was relatively low across the studies (median %: 6, IQR: 5.6 − 7.0) and balanced in the compared arms (median difference in %: 0.1, IQR: −3.5 − 4.4). An HR<1 (and equivalently, logHR<0) indicated a beneficial effect of the first intervention in the comparison for increasing the overall (and progression-free) survival. We considered the random-effects NMA for naturally encompassing the statistical heterogeneity expected in the included studies.
25
The network of randomized controlled studies. The thickness of lines and the size of nodes are proportional to the number of studies in the corresponding comparisons and treatments, respectively. BSC, Best Supportive Care.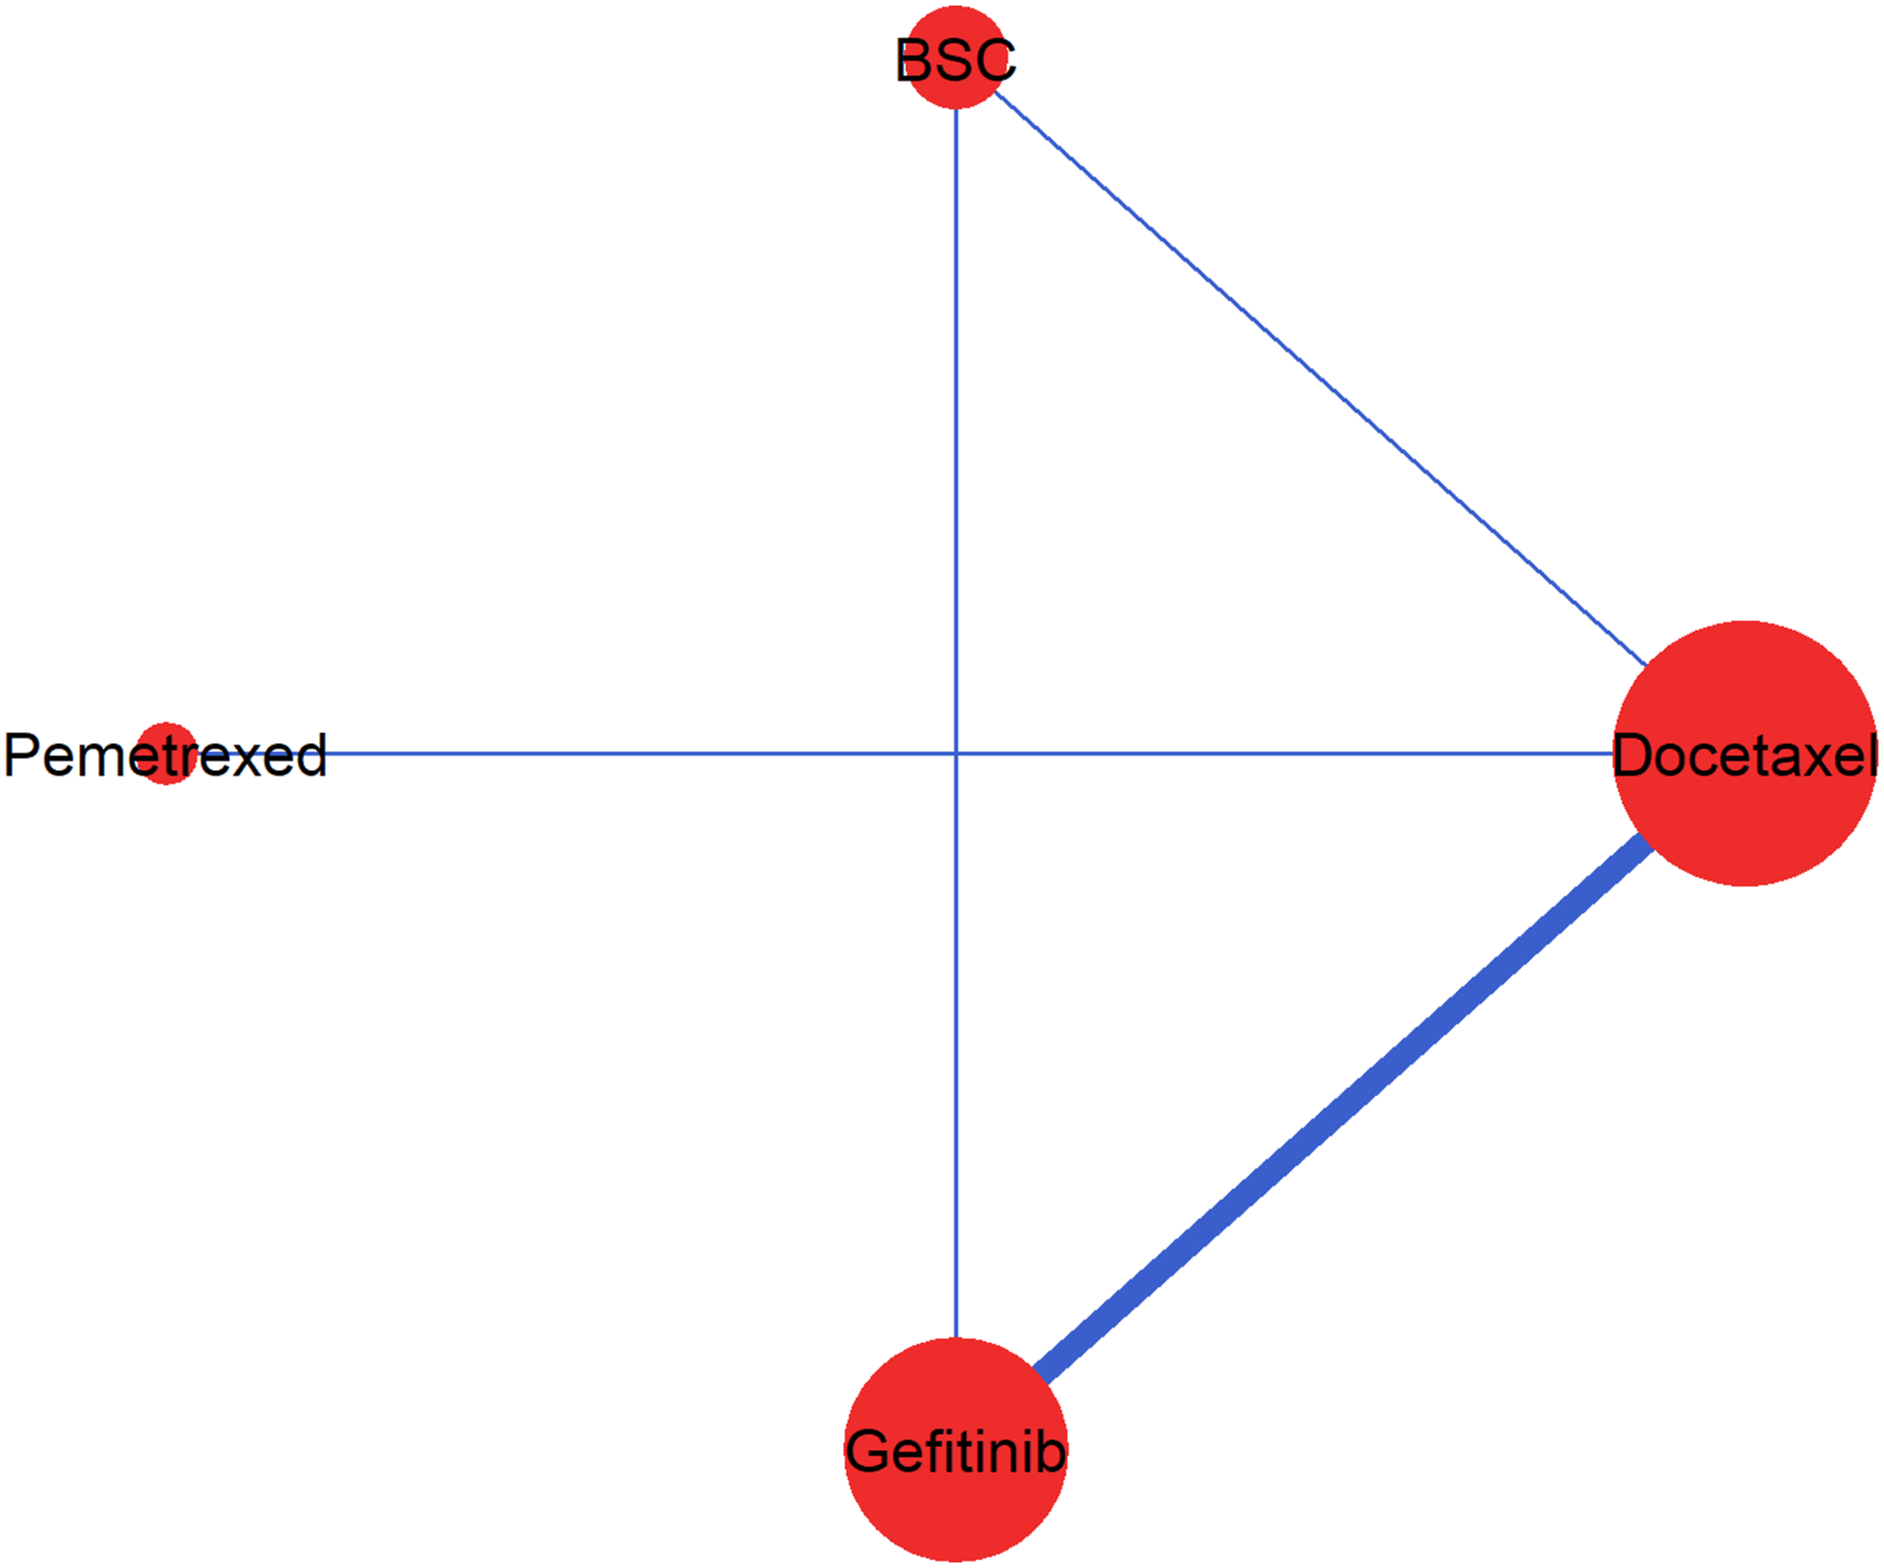
For each included study, we used the method developed by Guyot et al. 26 to derive the reconstructed IPD: the number of randomized and censored participants and the number of observed events in intervals of 2 months (dt=2). The method uses iterative numerical methods to solve inverted KM equations. We digitized the KM curves using DigitizeIt v2.3. 27 It should be noted that the dataset in Jansen 7 provides incorrect numbers for the study comparing docetaxel with BSC. 24 This study 24 enrolled 100 participants in the BSC arm and 104 in the docetaxel arm (49 at 100 mg/m2, 55 at 75 mg/m2) rather than 222 and 441 participants, respectively, as provided in Jansen. 7
Methods
Fractional polynomial models
Royston and Altman
28
introduced the concept of FP models as a flexible alternative to the standard parametric models for time-to-event data to capture a wide range of shapes of the survival curve.
10
Specifically, the hazard of an intervention is modeled as a function of the PH model and power transformations of time to reflect the change in the hazard over time. A first-order FP model to estimate the natural logarithm of the hazard in arm k of a two-arm randomized controlled study at time t is defined as
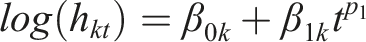

The power of p1 and p2 can be chosen from a set within {−2, −1, −0.5, 0, 0.5, 1, 2, 3} where different choices correspond to different hazard functions, thus allowing a range of different shapes (e.g., a monotone increasing or decreasing and constant) that can fit the data more closely than the simpler PH model.7,28 The researchers should bear in mind two considerations when selecting the pair of powers (p1, p2): (i) the clinical relevance of the model in terms of the investigated health condition and interventions (namely, the shape of the hazard function over time), and (ii) and the data availability in association with the number of model parameters that need to be estimated to prevent overfitting. We elaborate on our perspectives on selecting the values for p1 and p2 in the Discussion section in the context of our motivating example.
The log hazard in arm k is a function of the log hazard in the baseline arm of the study and the log HR,
Bayesian random-effects NMA model without censoring
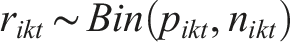
Consider a network of N studies investigating different sets of T interventions for a time-to-event outcome. The KM curve of the outcome of interest in arm k=1, 2, …,a
i
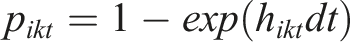
of study i= 1, 2,…,N, divided into consecutive time intervals [t,t+dt] illustrates the cumulative proportion of participants without the outcome at each time interval. Then the number of events in arm k of study i in the interval [t,t+dt] is assumed to follow a binomial distribution,
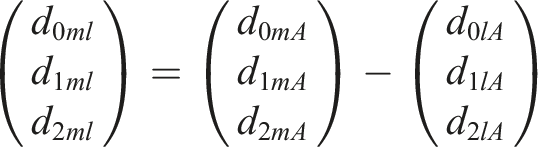
Under the consistency assumption (i.e., the agreement between direct and more than one indirect route of evidence), the summary effect of intervention m against l can be estimated indirectly through the reference treatment A as follows
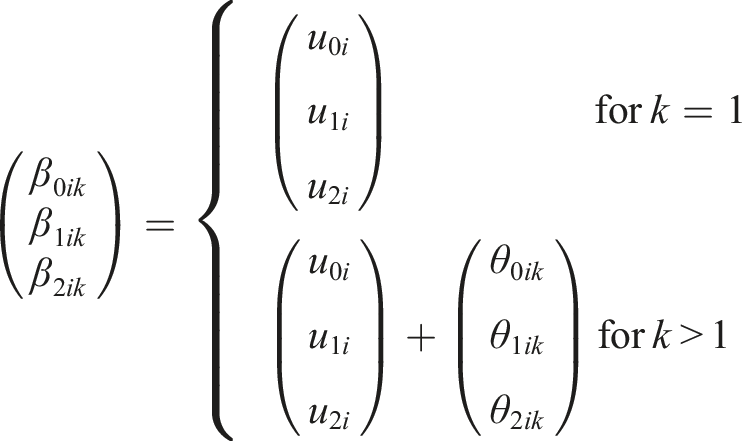
Assuming random effects only for the PH model implies that the between-study variance does not change over time; therefore, equation (1) is replaced by
Pattern-mixture model
Consider that in the interval [t,t+dt], m
ikt
participants were censored (lost to follow-up for reasons related or not to the design and conduct of the study) in arm k of study i with a risk of censoring, q
ikt
. Among those

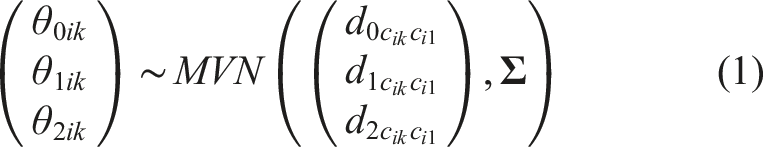
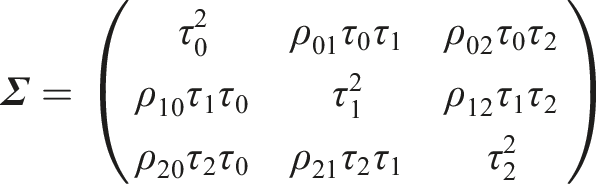
Under the PM model, the underlying hazard in arm k of study i at timepoint t is decomposed to the hazard rate among the completers and the hazard rate among the censored participant as follows:

The informative censoring hazard ratio parameter
Alternatively,

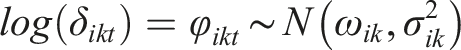
After replacing

The ICHR parameter expresses the relationship between (i) The hazard rate given the censored participants equals the hazard rate given the completers at timepoint t (i.e., (ii) The hazard rate given the censored participants is greater or lower than the hazard rate given the completers at timepoint t (i.e.,
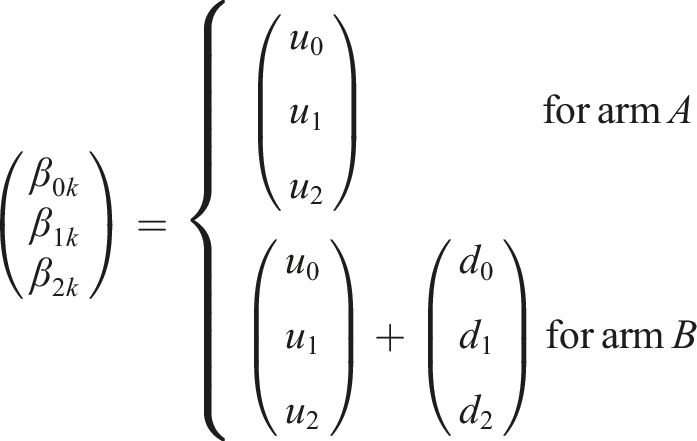
The ICHR parameter can be further structured to be common or independent across the study-arms, as well as study-specific or intervention-specific, and additional assumptions may concern the specification of the prior distribution for φ
ikt
being fixed, exchangeable, or unrelated (Table S1 in the Supplementary material). Note that we have assumed the censoring mechanism to change over time which aligns with the concept of the FP model. In the present work, we have considered independent, unrelated φ
ikt
∼N(0, 1) that indicates that CAR holds ‘on average' (ω
ik
=0) with variance
Model implementation
Goodness-of-fit measures for random-effects fractional polynomial (FP) models and random-effects fractional polynomial models with pattern-mixture (FP-PM) for different powers p1 and p2.
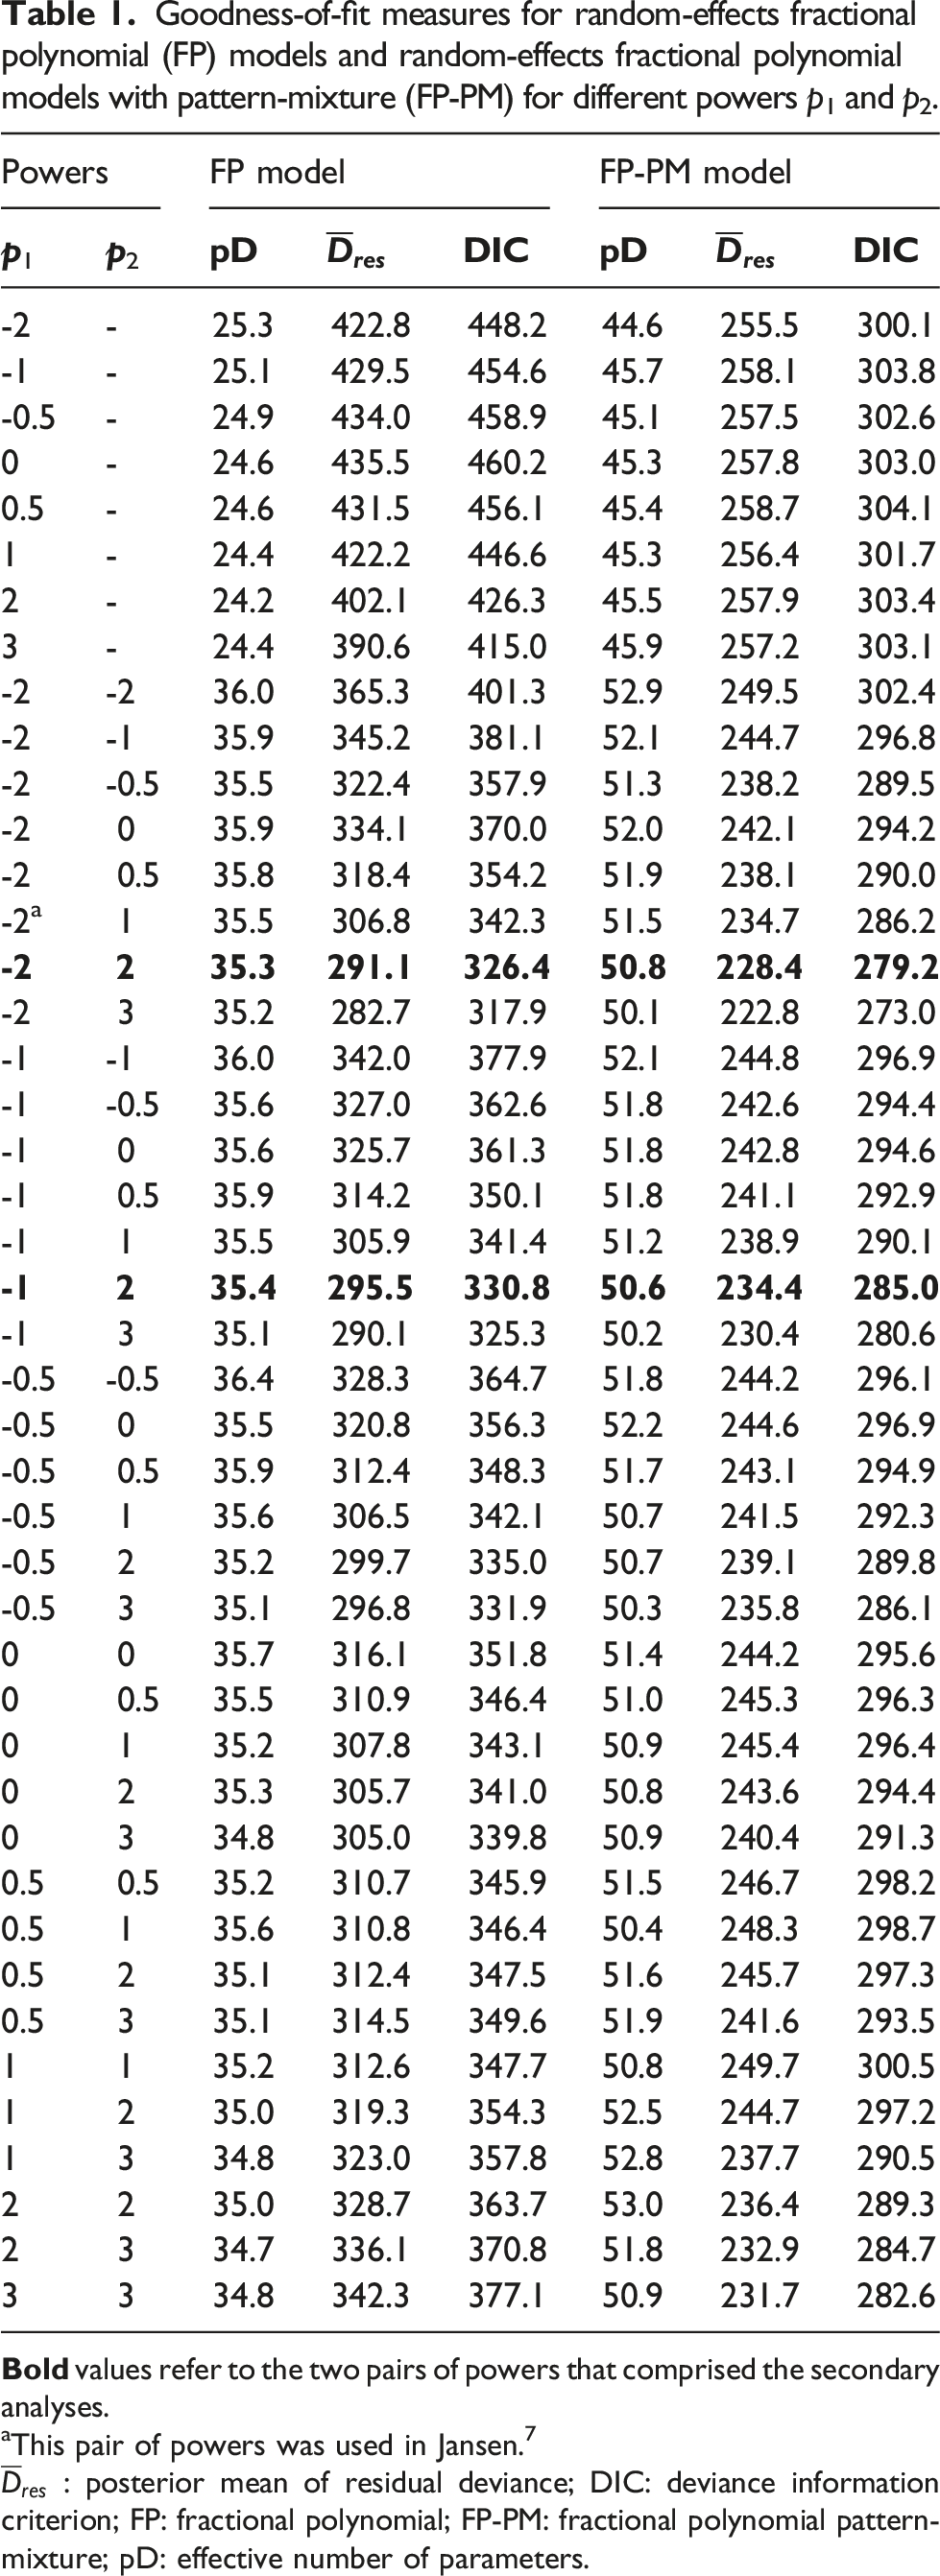
aThis pair of powers was used in Jansen. 7
We assigned a non-informative normal prior distribution for the location parameters, with a mean of 0 and a variance of 10 000. We assigned a half-normal prior distribution with a scale parameter equal to 1.0 (median: 0.67; IQR: 0.03 − 2.24) on τ0 to allow for a more accurate and precise estimation of the parameters due to the limited number of studies per comparison suggested by relevant literature. 31 We ran three chains of different initial values with 80 000 iterations, 20 000 burn-in, and thinning equal to three. We used the Gelman–Rubin convergence diagnostic and visual inspection of trace plots to assess the convergence. 32 To implement the models, we used the R statistical software 33 and JAGS 30 via the R package R2jags. 34 We used the R-package ggplot2 35 to create the figures and the R package pcnetmeta 36 to draw the network plot.
Results
The model-fit measures for the different FP and FP-PM models are presented in Table 1. The FP-PM model systematically yielded more effective parameters than FP for estimating more parameters (the difference ranged from 14.8 to 21.5). However, the FP-PM model yielded a systematically lower posterior mean of residual deviance than FP for all pairs of powers, leading to a consistently lower DIC (the difference ranged from 44.7 to 157.2). According to the Gelman–Rubin convergence diagnostic, convergence was achieved for all model parameters (range: 1.001−1.002 for
Network meta-analysis results
Posterior median and 95% CrI of log HR for comparisons with docetaxel, between-study standard deviation, and expected survival time.
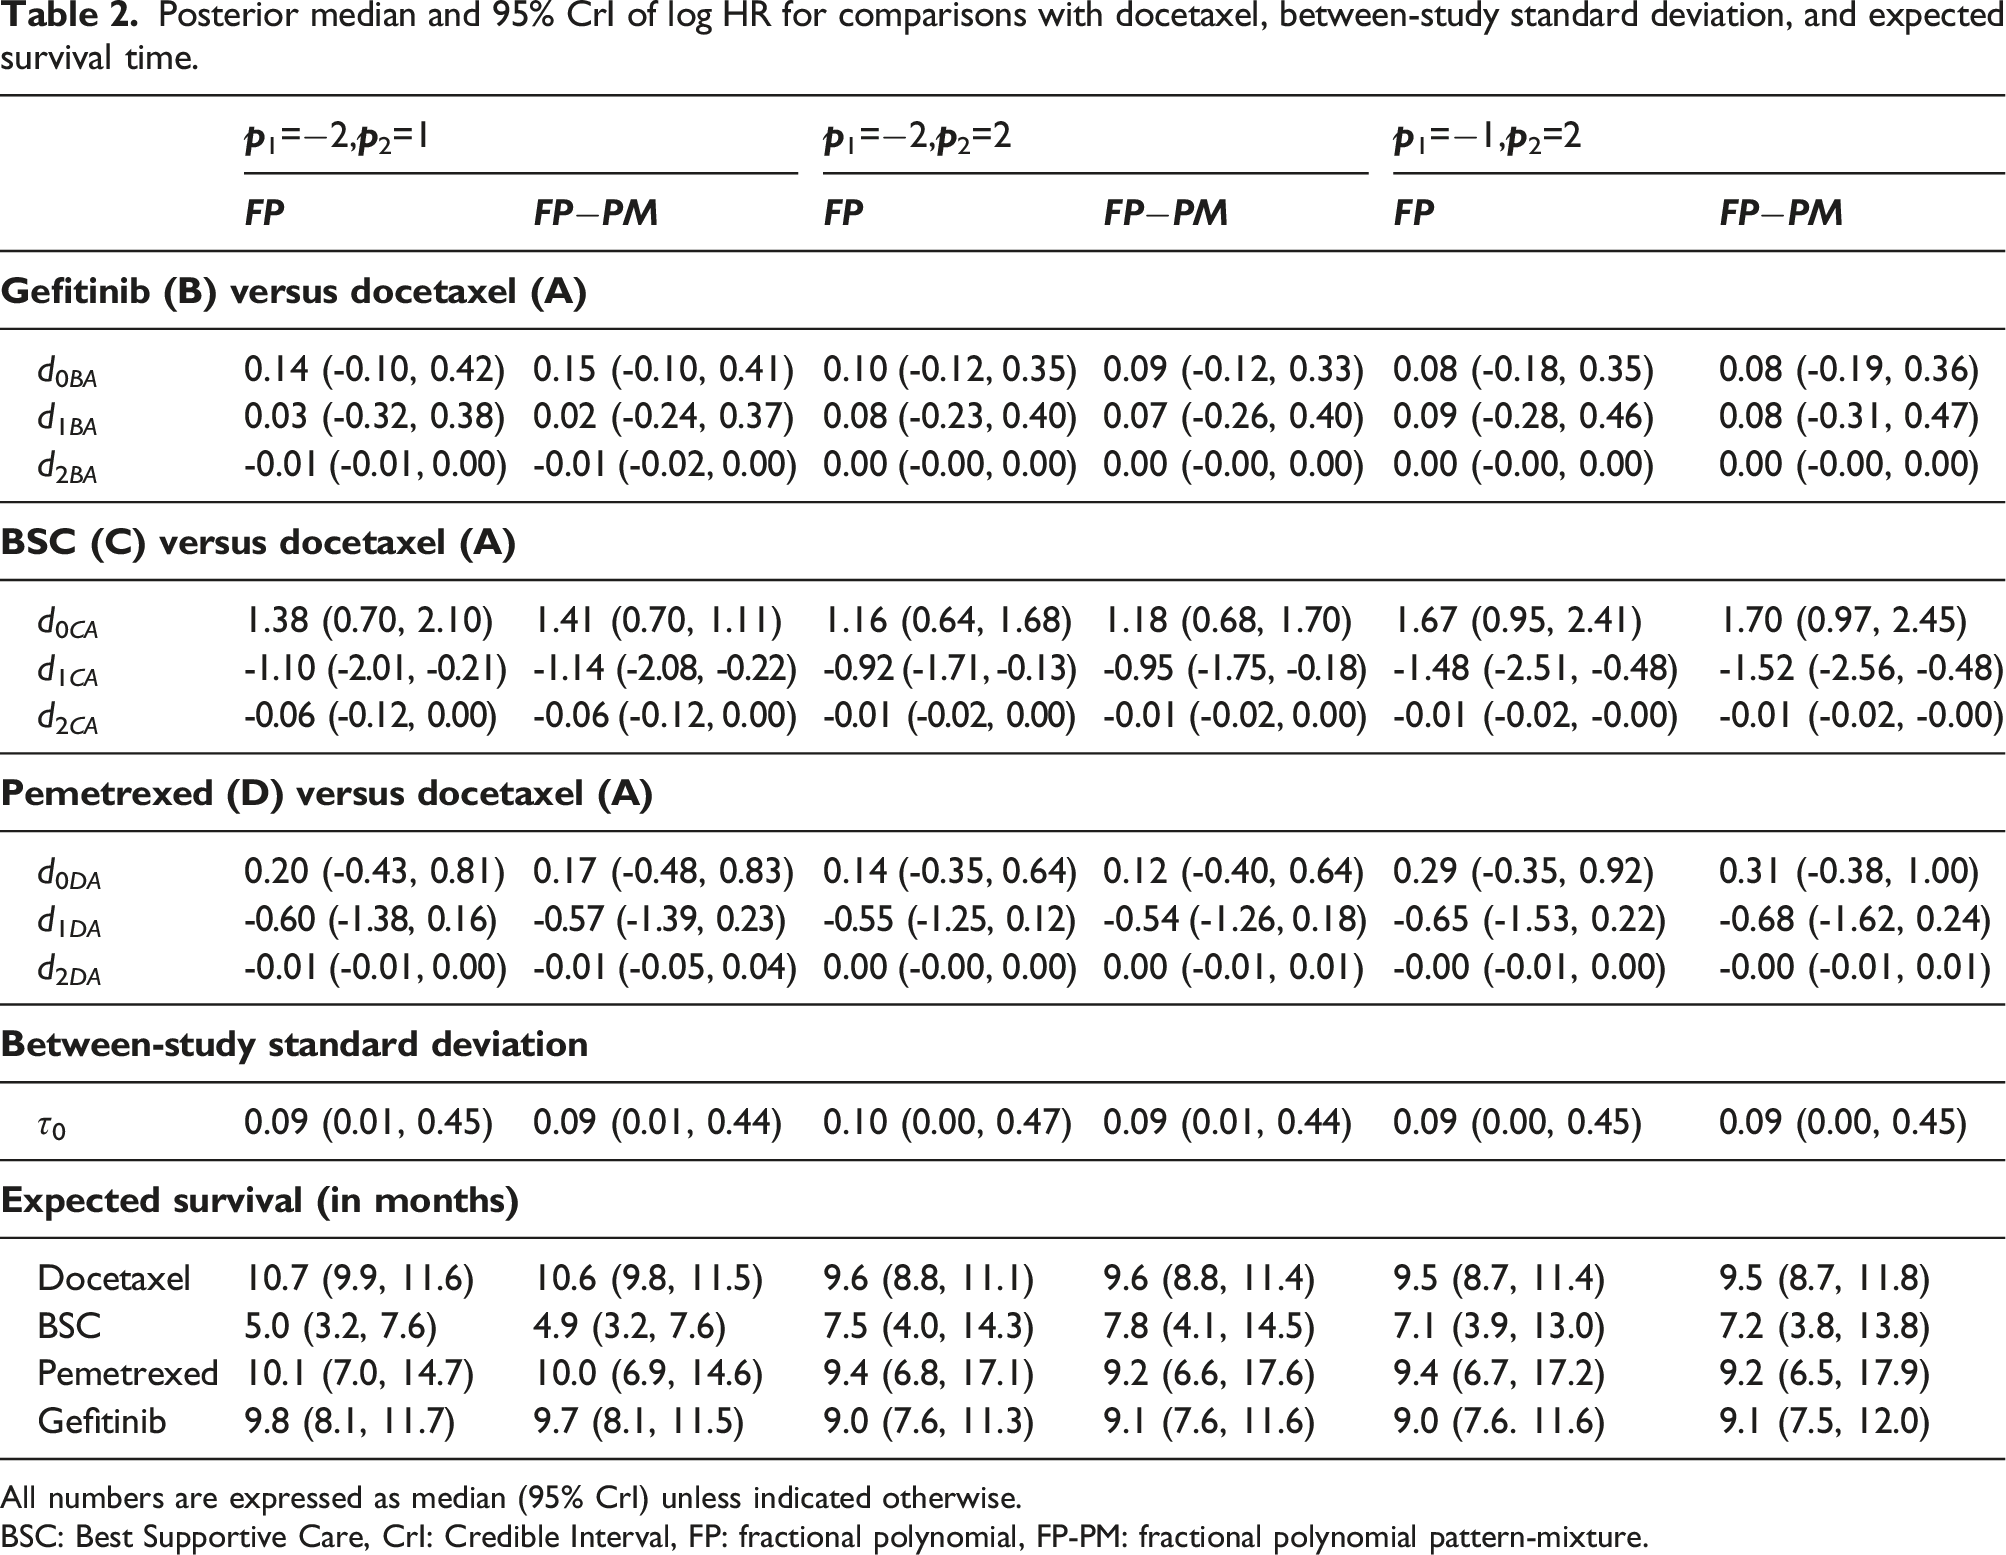
All numbers are expressed as median (95% CrI) unless indicated otherwise.
BSC: Best Supportive Care, CrI: Credible Interval, FP: fractional polynomial, FP-PM: fractional polynomial pattern-mixture.
Overall, the development of HR had a similar pattern in both models but differed for different powers (Figure 2, panels a and b for the primary analysis; Figure S2 in the Supplementary material for the secondary analyses). Models with a second-order power of 2 showed implausible results for extrapolation purposes: the upper bound of the 95% CrI reached very large values (Figure S2 in the Supplementary material). The same pattern of survival curves was also shared between the FP-PM and FP models (Figure 2, panels c and d for the primary analysis; Figure S3 in the Supplementary material for the secondary analyses). Nevertheless, they demonstrated slightly greater uncertainty in estimating the hazard over time under the FP-PM model than under the FP model. When modeling survival time with either model, the curves of docetaxel, gefitinib and pemetrexed were hardly distinguished. Gefitinib showed better results on average, and BSC showed the least good results with a plateau after month 20 (Figure 2, panels c and d for the primary analysis; Figure S3 in the Supplementary material for the secondary analyses). First row: hazard ratio over time for each intervention relative to docetaxel under the FP-PM model for the CAR assumption (panel (a)) and FP model (panel (b)). Second row: survival function over time for each intervention under the FP-PM model for the CAR assumption (panel (c)) and FP model (panel (d)). Both models have been fitted for p1=−2 and p2=1 (primary analysis). The solid and the dot-dashed lines represent the posterior distribution's median and 95% credible interval, respectively.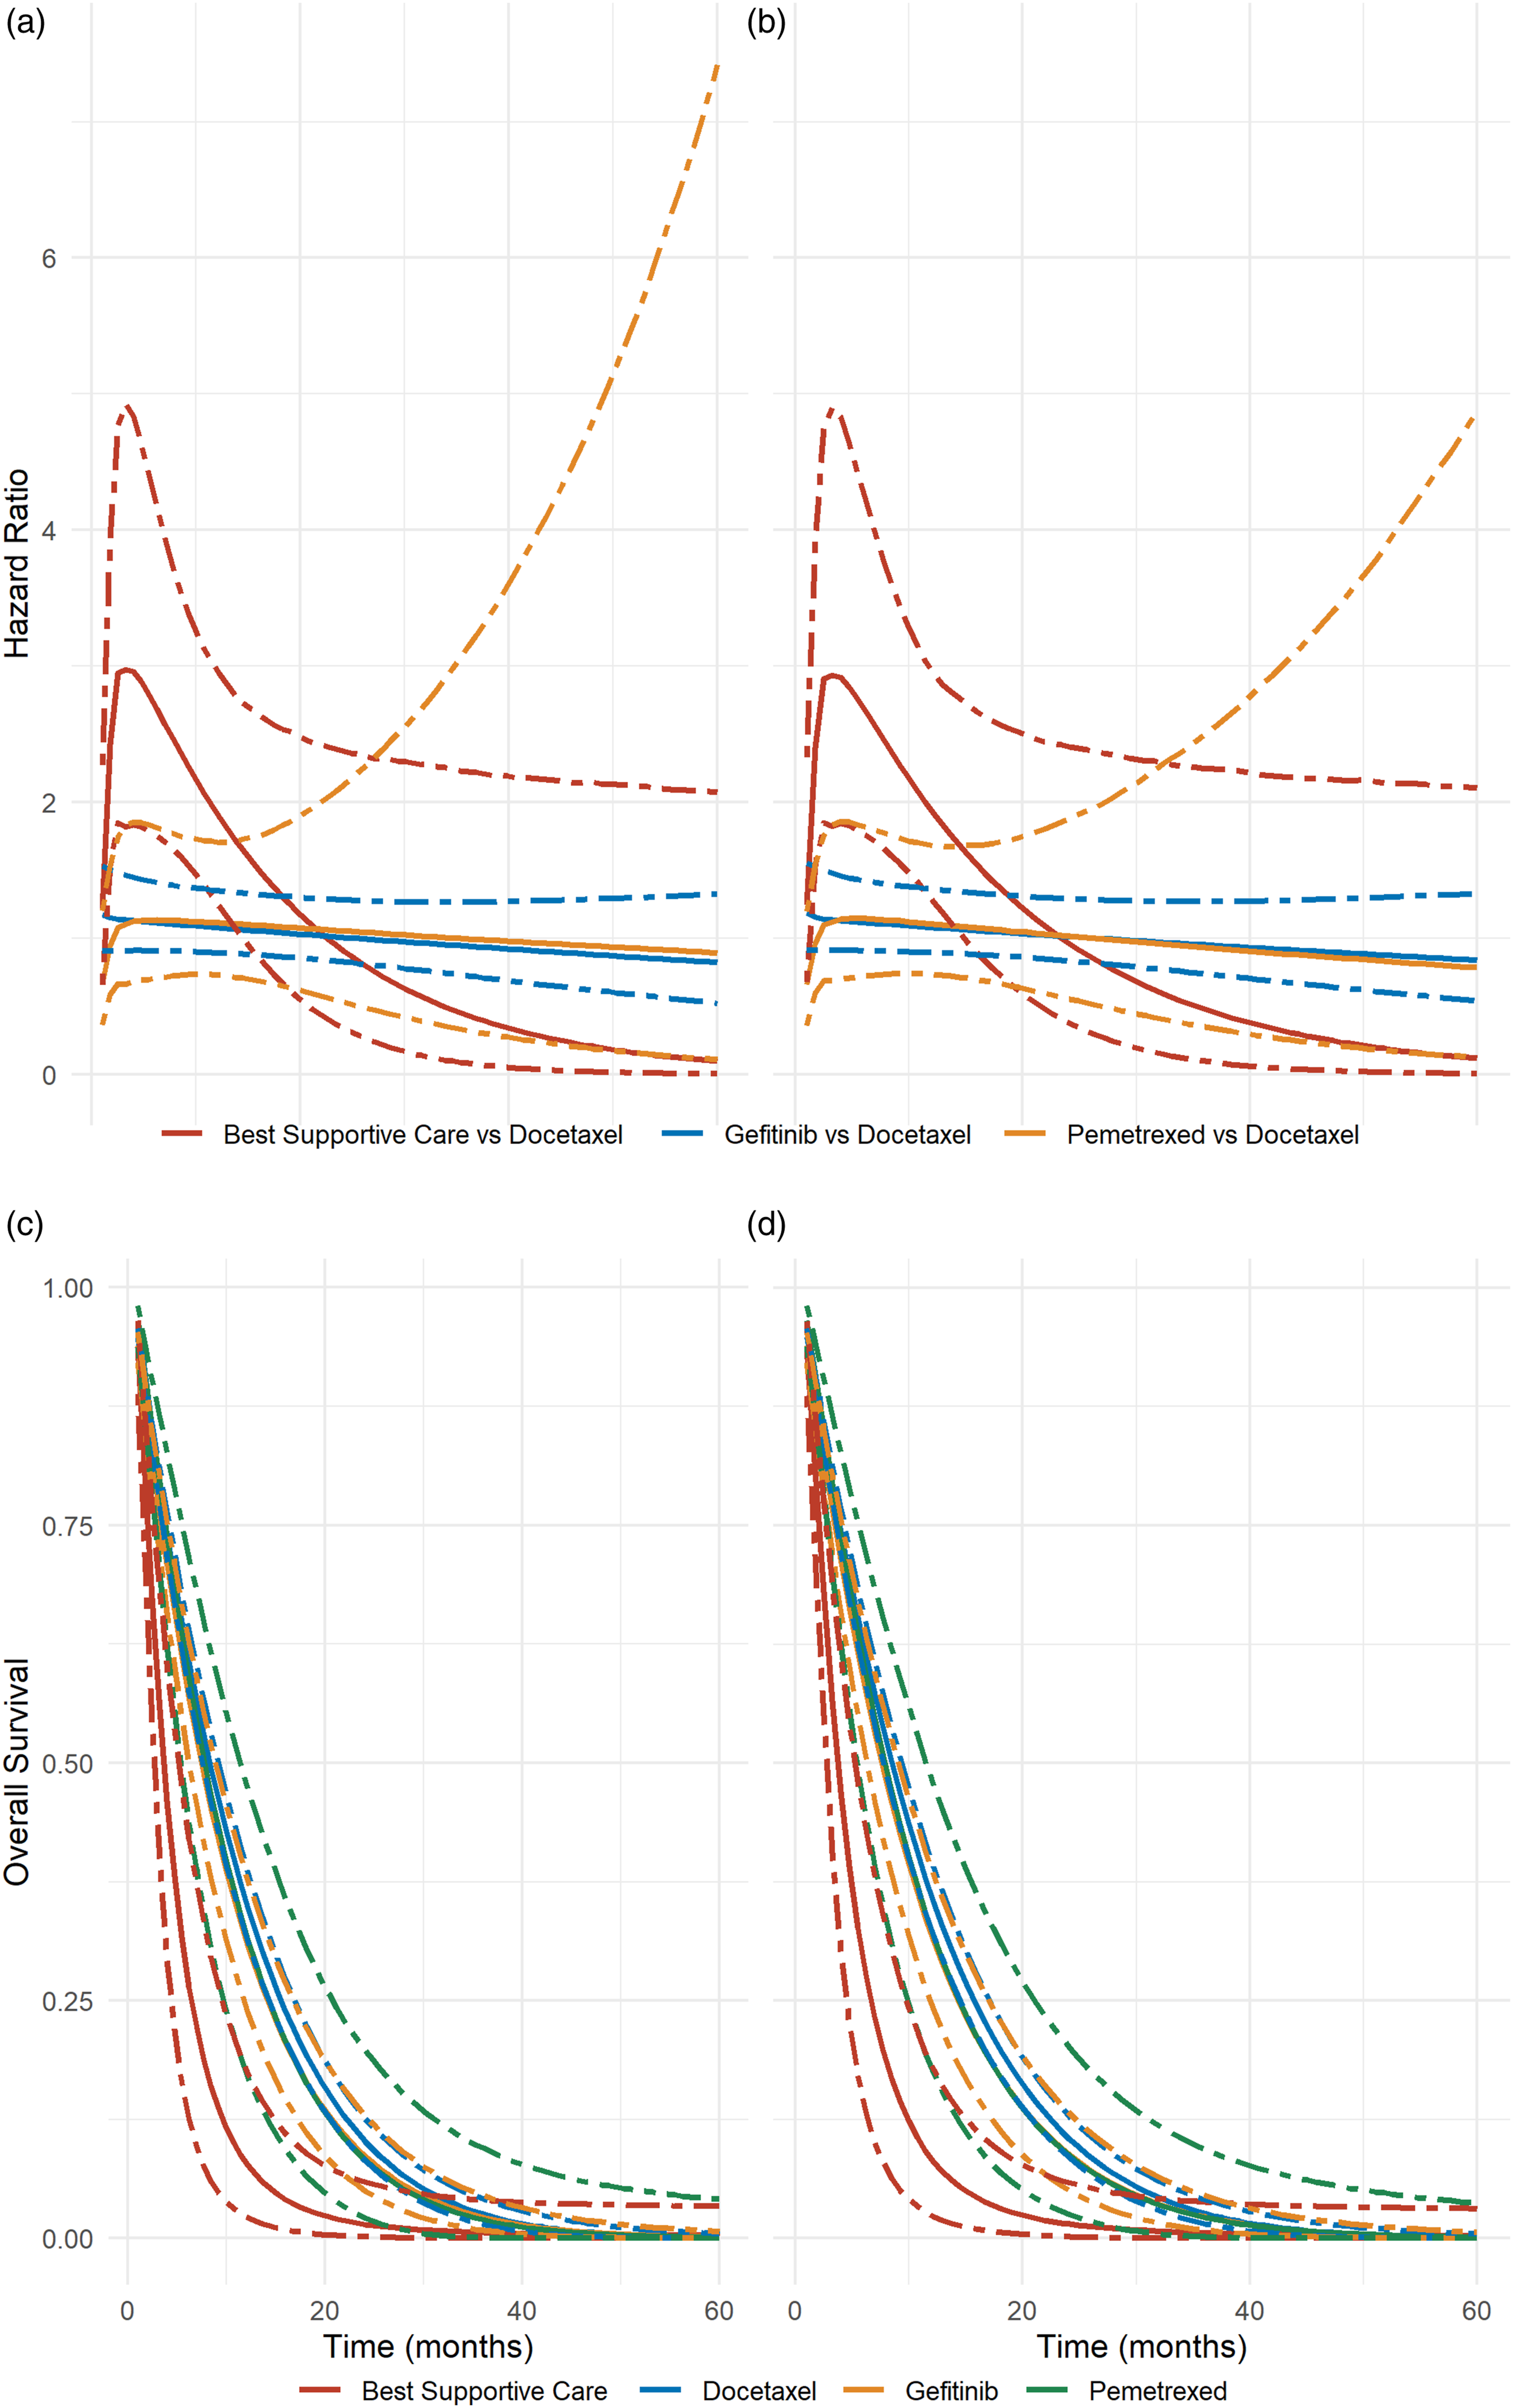
Learning about the censoring mechanisms
The posterior distribution of log ICHR for each study's arm in the network and at each timepoint is shown in Figure 3. For some of the study-arms, the posterior mean of log ICHR deviated from zero, and the bounds of the 95% CrI protruded from the interval of the prior distribution on φ
ikt
, indicating a departure from the CAR assumption; hence, the censoring process may be informative. For those study-arms with a positive posterior mean of log ICHR, the hazard of death may be higher among the censored participants than among the completers, whilst the opposite holds for a negative posterior mean of log ICHR. Also, for two study-arms referring to gefitinib
19
and BSC,
24
respectively (highlighted in red in Figure 3), the 95% CrI of log ICHR excluded zero and protruded from the interval of the prior distribution of log ICHR, which was a strong indication of informative censoring. This was an expected finding resulting from censoring at the end of the follow-up. Interval plot of the posterior distribution of log ICHR for all study-arms of the networks and timepoints. The vertical lines indicate the prior distribution for ICHR as obtained using the FP-PM (p1=−2, p2=1) network meta-analysis model under the CAR assumption.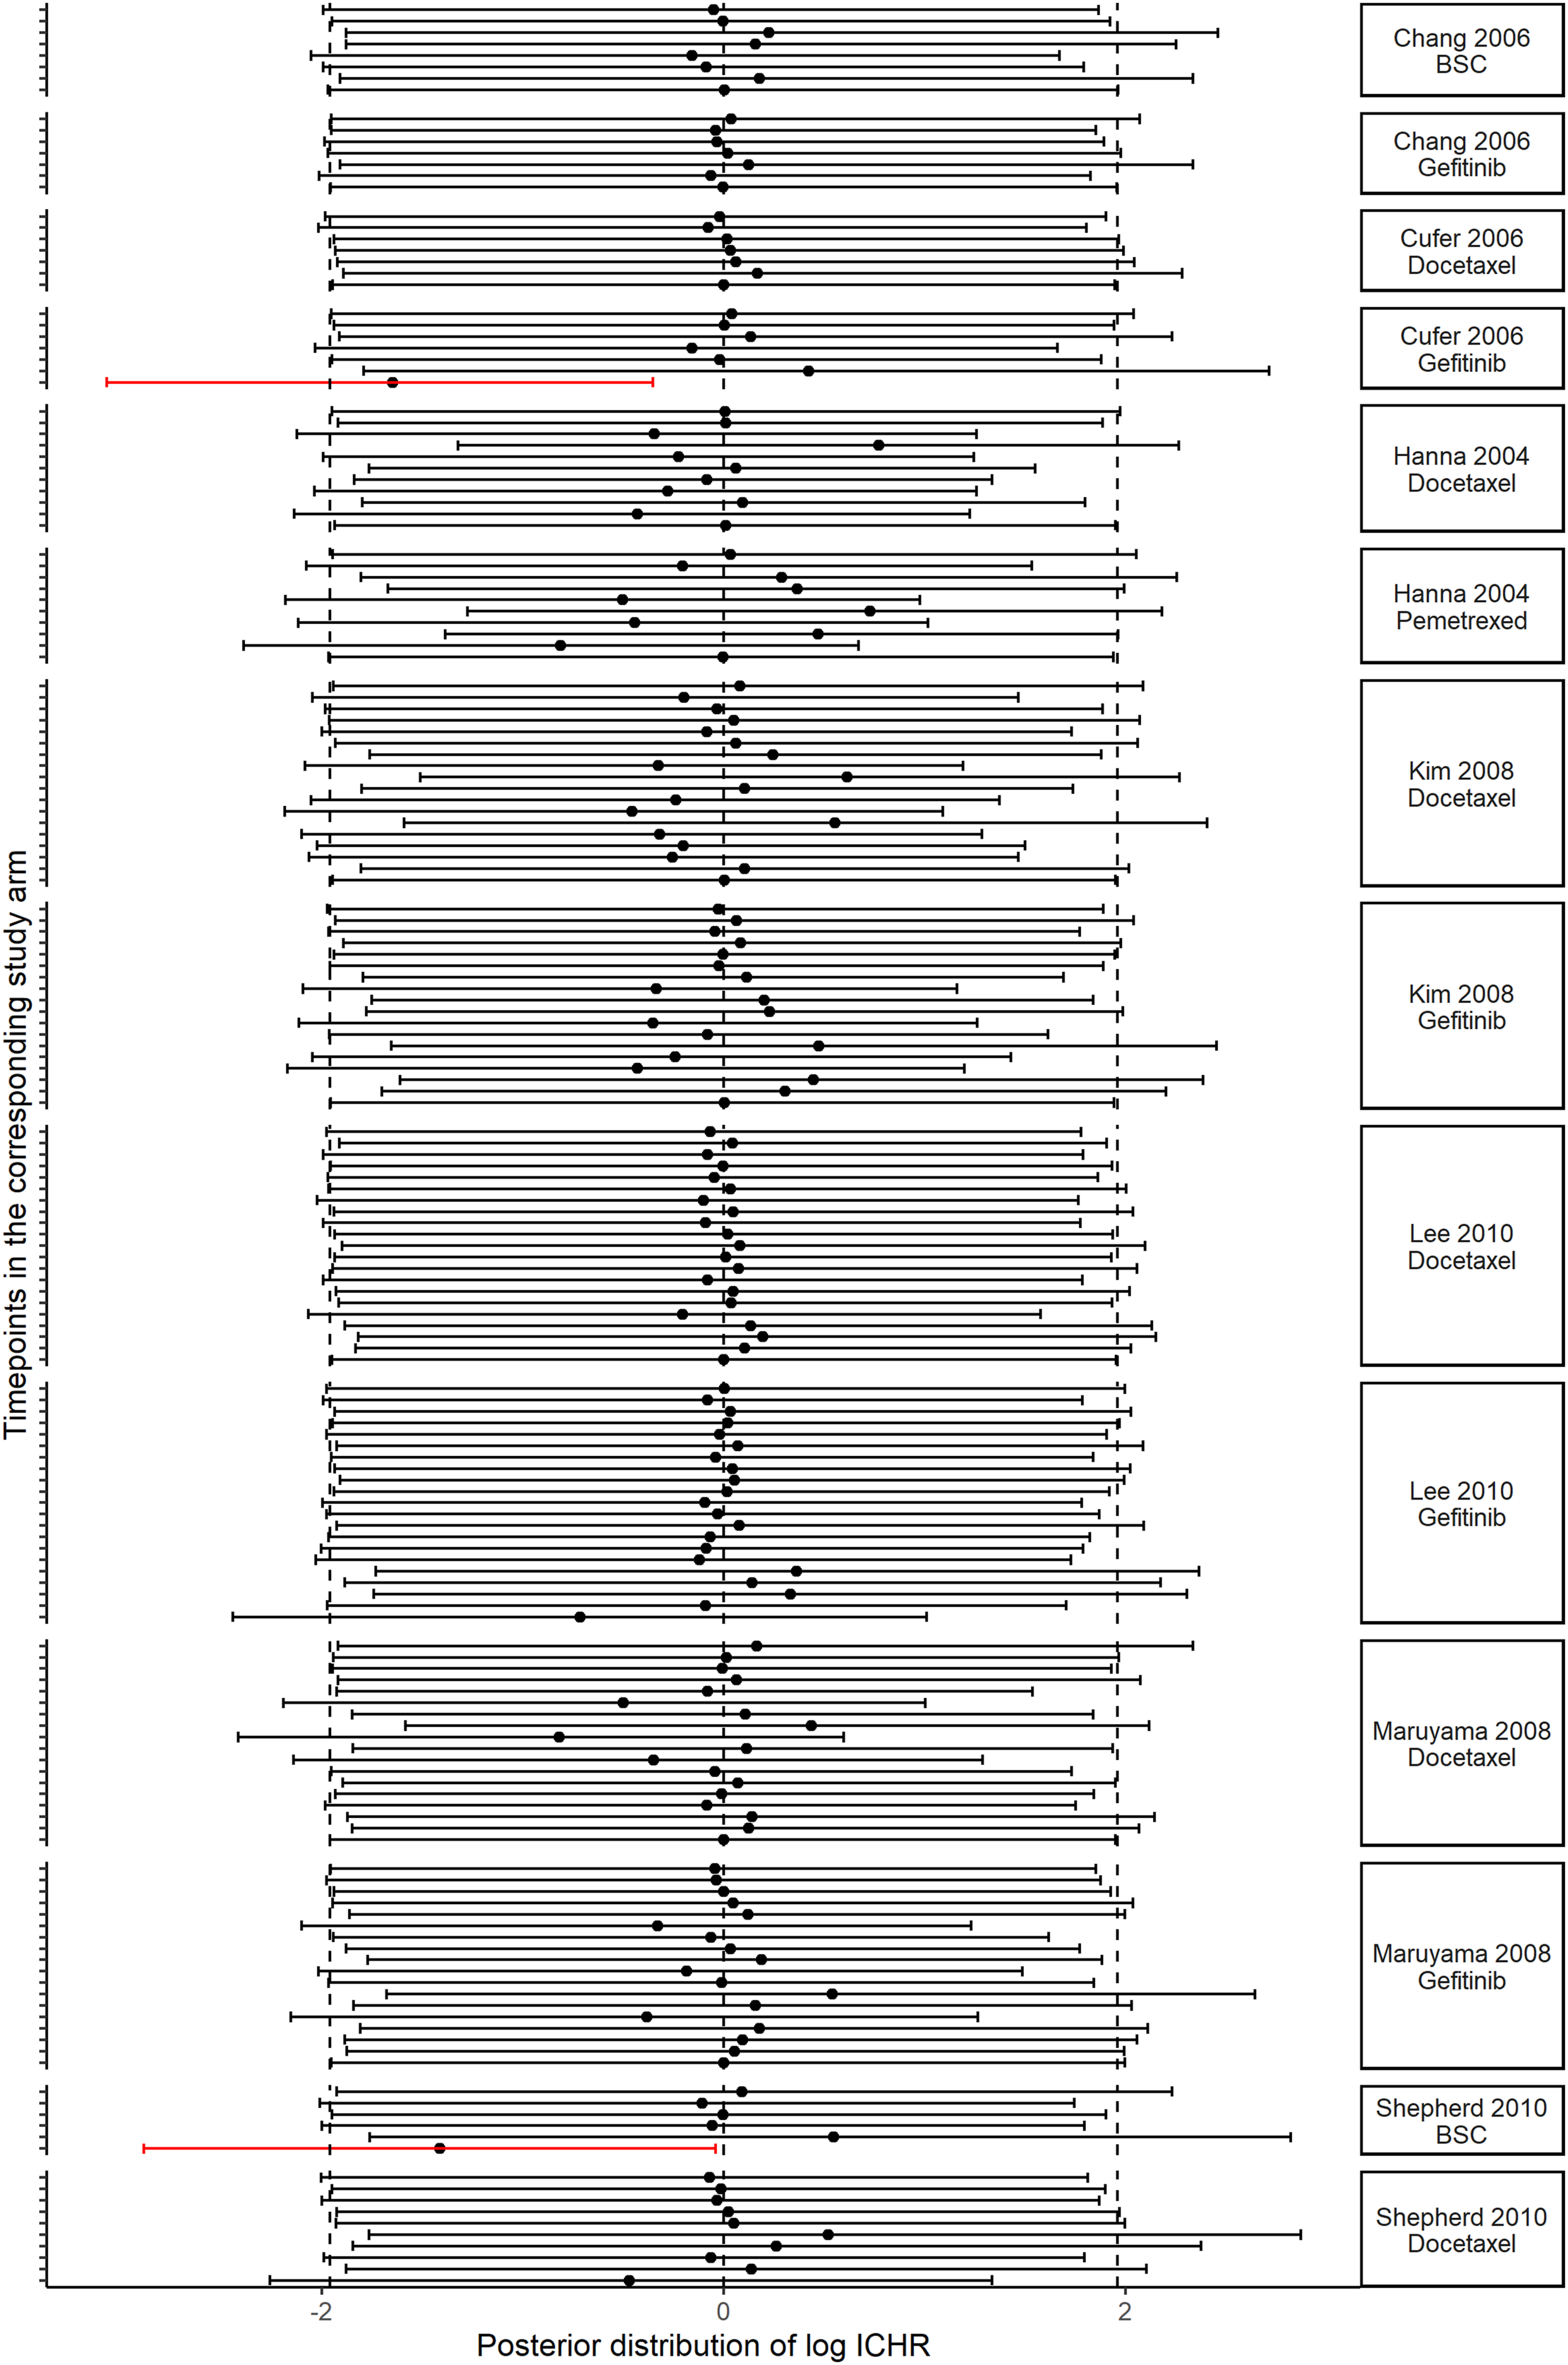
Discussion
The present article addressed a methodological gap in handling censoring in aggregate survival data. We proposed a straightforward approach to model aggregate time-to-event data with censoring by extending the FP model to incorporate the PM model and obtain bias-adjusted results. We introduced the ICHR parameter to investigate possible departures from the CAR assumption and ‘learn' about the censoring mechanisms in the network.
In the absence of IPD, applying the PM on reconstructed IPD is advantageous to imputation and exclusion for accounting for the uncertainty induced by censoring through assumptions about the distribution of the ICHR parameter. Ideally, the researcher would invite expert opinion to determine a series of clinically plausible assumptions about the distribution of the ICHR parameter to investigate the sensitivity of the results to censoring. For instance, the present work could be extended to consider the approach of White et al. 37 on eliciting expert opinions about the degree of departure from the CAR assumption.
An indication of informative censoring was observed at the end of the KM in Cufer et al. 19 and Shepherd et al. 24 However, no strong indication of informative censoring was observed in any other time interval, showing that the follow-up ended at a pre-specified date when most participants had not experienced the event yet. In principle, we should distinguish censoring due to losses to follow-up from administrative censoring. In oncology trials, loss to follow-up is relatively rare, and most censoring tends to be administrative and unlikely to cause bias. Administrative censoring may lead to overly precise or imprecise results if censoring is imputed or excluded, leading to possibly spurious conclusions depending on the amount of censoring in the data. However, it is impossible to distinguish between the losses to follow-up and administrative censoring when IPD is unavailable. Therefore, regardless of the censoring type, our approach is advantageous and should be preferred to imputation or exclusion for maintaining the randomized sample and incorporating the uncertainty about the censoring mechanism in the results. Our proposed method is also relevant to observational studies or studies examining more chronic conditions as they are not immune to losses to follow-up and its implications. 38
The models with a power equal to 2 for the second order did not provide clinically plausible results for the log HRs over time (Figure S2 in the Supplementary material), which may impact the extrapolation of the KM curves. Furthermore, we observed greater variability in the results for different powers than between the FP and FP-PM models (Table 2). Selecting the proper set of powers for the dataset may require a heuristic procedure considering the trade-off between clinical plausibility and model fit. Ideally, the selected powers should not result in overfitting as it may compromise the clinical plausibility of the extrapolation. 10 Royston has developed a function in the STATA package to assist the researchers in selecting the powers for the p1 and p2 that result in a parsimonious FP model through a model selection process. 39 To determine the model with the best representation of hazards beyond the study period, the researchers should consider whether the extrapolation is realistic, seeking external data sources and clinical expert opinion. 40
The limitations of our proposed method are primarily inherent to those resulting from the KM digitization. The digitization of the published KM curves tends to pool data over different covariates that might (or not) affect survival, possibly resulting in biased treatment effects, with the extent of bias being proportional to the strength of the covariate effect. 26 However, this limitation can be argued if the studies considered in the NMA are comparable for essential effect modifiers. The reliability of the reconstructed data also strongly depends on the information in the published reports. There is high interest in reconstructing KM curves, and the recently developed R shiny app might be the solution to the limitations of digitization. 41
Another limitation of our study is that incorporating the PM model in the FP framework did not materially change the conclusions. This may be primarily attributed to the relatively low censoring rate across the studies (typical in pivotal oncology trials), which was accommodated in an aggregate form without information on the exact censoring times and any essential covariates that would have allowed for more sophisticated analyses to handle censoring. However, information on the exact censoring times and important covariates would require access to IPD. Nonetheless, having studies with very low censoring (3% and 1% in Cufer et al. 19 and Shepherd et al., 24 respectively) allowed us to learn about the censoring mechanisms (the prior distribution for φ ikt was updated in some study-arms and timepoints). 16 In studies examining more chronic conditions, loss to follow-up can be substantial with serious implications for decision-making. Without access to IPD, the proposed FP-PM model would safeguard against spurious conclusions by naturally increasing the uncertainty around the model parameters. However, the substantial censoring may compromise the ability to learn about the censoring mechanisms.
Moreover, we did not perform a sensitivity analysis to investigate whether the primary analysis results (under CAR) are sensitive to different informative censoring scenarios. Due to low censoring observed across the studies, one may presume that the results would have been robust to different structures and assumptions about the ICHR parameter. However, a recent study on aggregate binary outcome data in NMA revealed that bias might be imminent even for low attrition, particularly when event frequency is low, the sample size is small and statistical heterogeneity is substantial. 42
Other survival approaches can be extended straightforwardly to incorporate the PM model to handle censoring, 40 which falls beyond the scope of this work. Selecting among the different survival models (e.g., FP and parametric models) requires careful consideration of the necessary assumptions and the scope of the application. Generally, relying solely on the goodness-of-fit measures for model selection may be misleading because the best-fitting model may not have a clinically meaningful interpretation. The structure of the network should also be taken into account. For instance, sparse networks are characterized by few connections between the treatments informed mainly by a handful of small studies. In such networks, estimating many parameters may result in convergence problems.
Conclusions
When the collated studies report the KM curves, the researchers should opt for the reconstructed time-to-event and censoring data. Then applying the FP-PM NMA model using clinically plausible scenarios about the ICHR parameter would provide biased-adjusted results and safeguard against spurious conclusions.
Supplemental Material
Supplemental Material - Dealing with censoring in a network meta-analysis of time-to-event data
Supplemental Material for Dealing with censoring in a network meta-analysis of time-to-event data by Chrysostomos Kalyvas, Katerina Papadimitropoulou, William Malbecq and Loukia M. Spineli in Research Methods in Medicine & Health Sciences
Footnotes
Acknowledgments
CK and WM are employed by Merck Sharp & Dohme. The authors alone are responsible for the views expressed in this article, and they should not be construed with the views, decisions, or policies of the institutions they are affiliated with.
Declaration of conflicting interests
The author(s) declared no potential conflicts of interest with respect to the research, authorship, and/or publication of this article.
Funding
The author(s) received no financial support for the research, authorship, and/or publication of this article.
Data Availability Statement
The data given this article are all functions and data related to this manuscript are publicly available at ![]() .
.
Supplemental Material
Supplemental material for this article is available online.
References
Supplementary Material
Please find the following supplemental material available below.
For Open Access articles published under a Creative Commons License, all supplemental material carries the same license as the article it is associated with.
For non-Open Access articles published, all supplemental material carries a non-exclusive license, and permission requests for re-use of supplemental material or any part of supplemental material shall be sent directly to the copyright owner as specified in the copyright notice associated with the article.