
Abstract
Background
Using evidence synthesis to design a clinical trial has long been advocated as the key against research waste. However, the relevant methodology does not deal with possible missing participants (MP) that may occur in a future trial. We illustrated the synergism of the baseline effects model and network meta-analysis (NMA) to predict the percentage of MP for a future trial.
Methods
We considered the network of a published systematic review as a case study. We applied the baseline effects model, followed by the relative effects model using Bayesian methods to predict the percentage of MP in each intervention when conducting NMA and a series of pairwise meta-analyses. We illustrated the posterior distribution of the predicted percentage MP under both synthesis methods alongside the MP reported in the corresponding trials for each intervention.
Results
Selecting different interventions for the baseline effects model yielded different predicted baseline effects and led to different predicted percentages of MP for the remaining interventions, highlighting the need to carefully pre-specifying the intervention for the baseline effects model. Both synthesis methods provided almost identical posterior distributions of predicted percentage MP for estimating similar summary odds ratios. There was great variability in the percentage of MP across the trials for each intervention, manifesting as considerable variability in the percentage difference in MP compared to NMA.
Conclusions
Incorporating predictions and absolute effects in the context of MP in NMA aids in determining the anticipated percentage of MP in the compared interventions to plan a future trial efficiently.
Keywords
Background
Patient dropouts are ubiquitous in clinical trials for various reasons, some of which may be related to the design and conduct of the trial. Knowledge of the number of and reasons for missing participants (MP) is necessary to design a trial that will deliver results of high quality. 1 Information on the number of MP in the compared interventions will ensure a sufficient sample size to detect the minimum clinically relevant difference for a specific outcome and target population. Information on the possible reasons for MP will lead to a proactive design of the future trial to retain the most randomised participants and increase statistical power. 1
Using evidence synthesis to design a clinical trial has long been advocated as the key against research waste because it can reveal limitations in conducting and analysing past relevant trials to prioritise future research. 2 The research community holds a positive attitude toward a research agenda for future trials based on synthesising past relevant trials.3,4
Evidence synthesis can also play a crucial role in uncovering the extent of MP in a specific patient population, set of interventions and outcome under investigation. Applications of pairwise and network meta-analysis have revealed that trials with similar patient populations and intervention settings encountered variability in the amount of MP.5–7 Selecting any past trial to inform the sample size of a relevant future trial would be misleading. This is because failure to incorporate the variability in the amount of MP (as observed in a series of relevant trials) into the design of a future trial may result in an underpowered trial, thus compromising any efforts to create an ecosystem of the best available evidence.
There is already an arsenal of methods to plan future trials based on systematic reviews.8–10 Currently, these methods do not deal with possible MP that may occur in a future trial. Predictions play a fundamental role in decision-making as they convey our uncertainty about future observations based on observed data. 11 We acknowledge predictions as a useful framework for quantifying the expected percentage of MP for a specific comparison and outcome in a future trial by synthesising the relevant evidence base. Using Bayesian methods, we can obtain the predictive distribution of the percentage MP in each intervention straightforwardly. The predictive distribution would capture the variation in MP across the relevant trials and the uncertainty about MP in a future trial with a setting similar to the investigated evidence base.
It is legitimate to wonder about the “proper” synthesis framework to predict the percentage MP for a future trial: pairwise or network meta-analysis. A pairwise meta-analysis (PMA) restricts the synthesis of trials to one comparison, providing only a fraction of the “underlying” extent of MP in the compared interventions. Network meta-analysis (NMA) synthesises a series of relevant trials investigating a different set of interventions; hence, NMA is arguably the ideal framework for planning future trials. NMA can inform decisions for comparisons never studied in a trial and prioritise the target comparison(s) to be investigated in future trials. 9 In the context of MP, NMA can maximise the information on MP contained in different sets of interventions across trials to obtain the predictive distribution of percentage MP for each intervention in the network.
The present study aims to raise awareness of considering all available relevant evidence in deducing the size of MP in the target interventions when planning a future trial. To this aim, we illustrate the synergism of the baseline effects model and NMA to predict the percentage of MP in each intervention. We will not prescribe an approach to accommodate MP in the sample size calculation for a future trial, as it is out of scope. However, in the discussion section, we briefly elaborate on the latter for future research in the evidence synthesis context.
Motivating example
The systematic review of Baker et al.
12
comprised the motivating example. The authors investigated four pharmacological interventions (inhaled corticosteroid (ICS), long-acting β2-agonist (LABA), ICS + LABA, and tiotropium) and placebo regarding chronic obstructive pulmonary disease (COPD) exacerbations. We selected this systematic review from our collection for having substantial variation in the percentage of MP across the trials and interventions. We extracted 21 trials that reported MP in all intervention arms. Figure 1(a) presents the percentage of MP in each arm of every trial in the network. Figure 1(b) illustrates the distribution of percentage MP for each observed comparison (lower off-diagonal) and intervention (diagonal). The complete analysed dataset (including the binary outcome of COPD exacerbations) is found in Supplemental Table 1 (Supplemental material). Heatmap on the percentage of missing participants in each arm of every trial and the corresponding risk of bias (plot (a)). Heatmap on the percentage of missing participants in each intervention (diagonal) and observed comparison (lower-off diagonals) in the network (plot (b)). The colours in plot (b) are based on the median percentage of missing participants. ICS, inhaled corticosteroid; LABA, long-acting β2-agonist.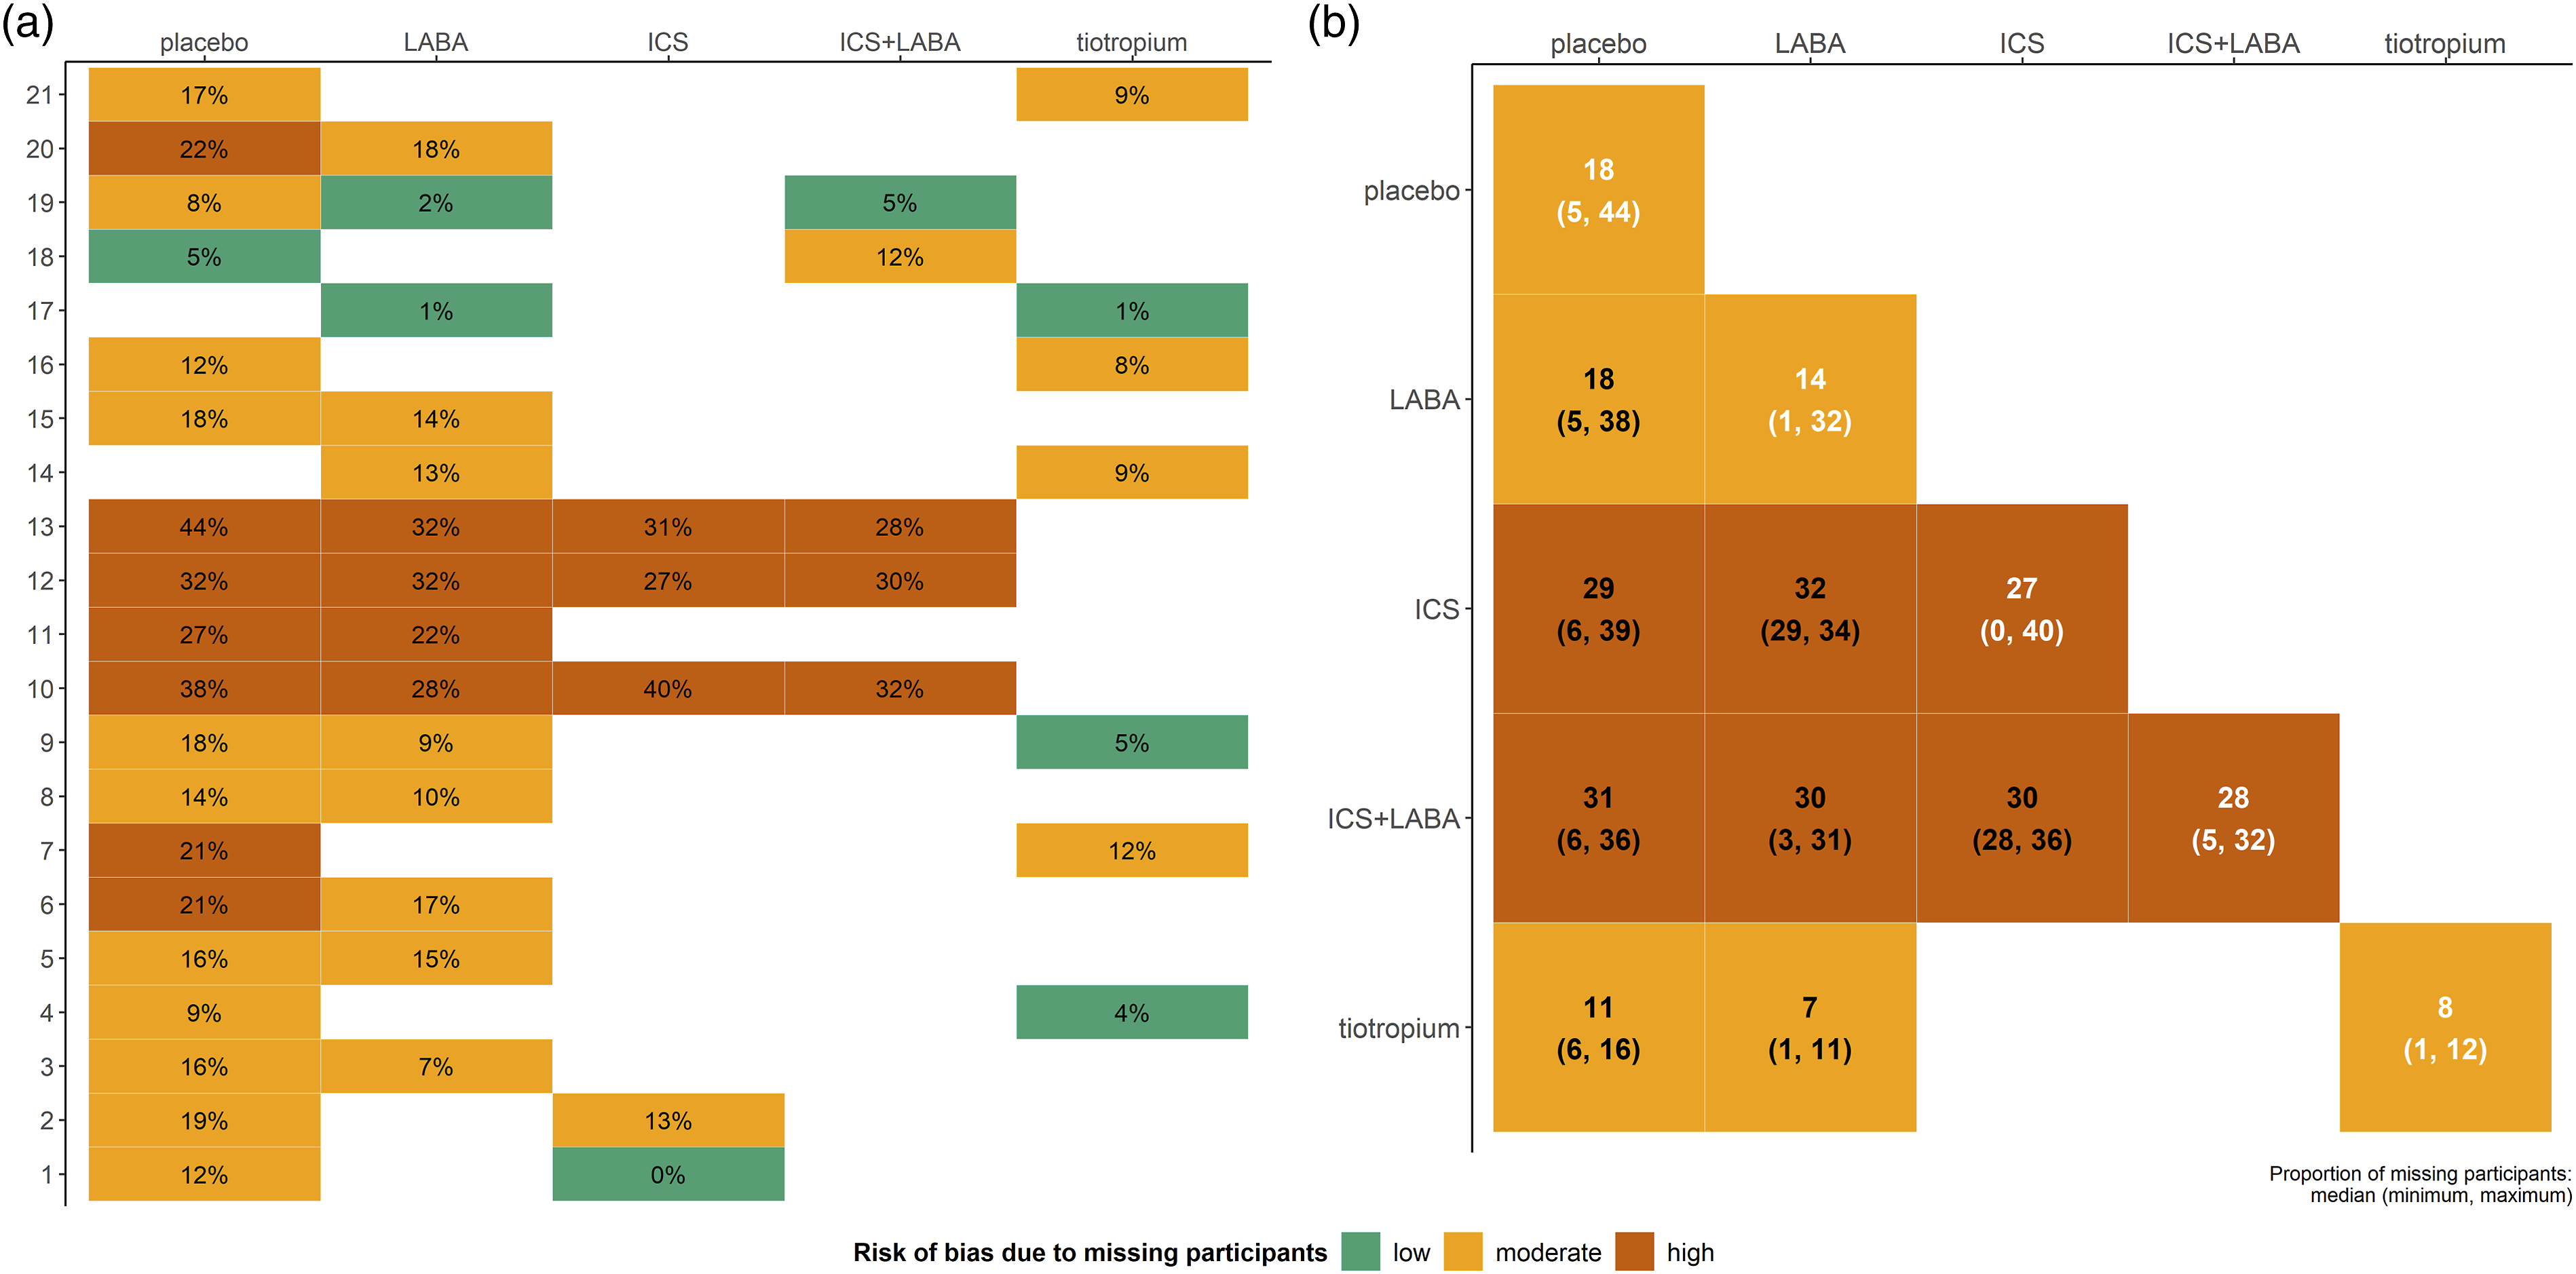
The percentage of MP ranged from low (
Methods
The relative effects model: synthesis of trials on an aggregate binary outcome
Consider a systematic review process yields
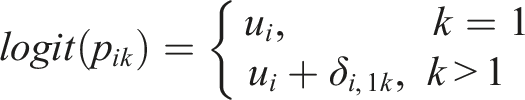
Using the logit link function, the log odds of an event in arm
In a PMA, the random-effects model boils down to
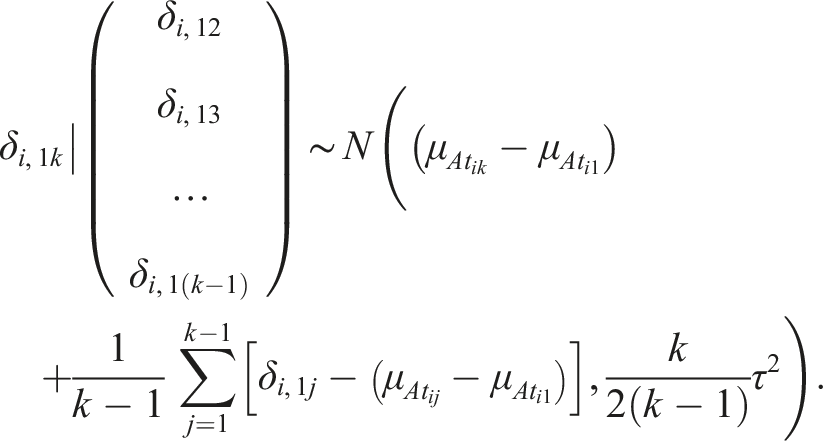
In the case of a multi-arm trial, the consistency assumption is intrinsic. Thus, it suffices to consider the random effects that refer to comparisons with the baseline arm of the trial: a trial with
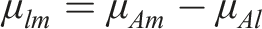
The location parameters
The baseline effects model: predicting the absolute effect of each intervention
Consider a set of
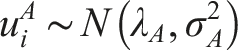
We assign the normal prior distribution

Then, the predictive distribution of the probability of an event in intervention
Dias et al.18,19 suggested running a separate model for the
The authors arguably advise considering different sources of evidence for each model.18,19 Clinical trials typically comprise the main source informing the relative effects model for offering fundamentally higher quality evidence. Observational studies may form the evidence base for the baseline effects model. These studies may be preferred when relevant trials have strict inclusion criteria or methodological limitations that compromise the quality of the delivered evidence.
For illustrative purposes only, we restricted the network to the trials investigating the reference intervention (placebo) to run the baseline effects model. Following Dias et al.,
19
initially, we ran the baseline effects model to obtain the posterior mean and standard deviation of

The roadmap for the analyses
Primary analysis: placebo as the reference intervention
We performed separate analyses to obtain the predictive distribution of percentage MP for each intervention under NMA and a series of PMAs. One baseline effects model was considered using • At the network level: We performed a random-effects NMA with consistency equations using • At the observed comparison level: The network has four placebo comparisons (Figure 1(b), lower off-diagonal). We performed random-effects PMA for each placebo comparison separately. LABA versus placebo included 12 trials, and the remaining three placebo comparisons included five trials each. • At trial level: We calculated the percentage of MP in each arm of every placebo-controlled trial as a ratio of the corresponding number of MP to the total number randomised. Altogether, we observed 19 different percentages of MP for placebo, 12 for LABA, and five for the remaining interventions.
Secondary analysis: implications of using a different reference intervention
As a secondary analysis, we repeated the analyses above for NMA and PMA, using each of the remaining interventions as the reference. Initially, we applied the baseline effects model for each intervention separately. Fourteen trials were considered in the baseline effects model for LABA, five trials for ICS and ICS + LABA, and seven trials for tiotropium (Supplemental Table S1 in Supplemental material and Figure 1(a)). Then, we incorporated the results from the baseline effects models into the corresponding relative effects models for NMA and PMA. The following four PMAs were performed: ICS versus LABA, ICS + LABA versus LABA, ICS + LABA versus ICS, and tiotropium versus LABA (Figure 1(b), lower off-diagonal). This analysis aimed to demonstrate the implications of the reference intervention in the predictive distribution of the absolute effects for all non-reference interventions.
For the primary and secondary analyses, Bayesian random-effects NMA and PMA models were conducted using the function run_model of the R package rnmamod in the statistical software R (version 4.2.0).20,21 The R package rnmamod performs Bayesian hierarchical NMA in JAGS 22 through the R package R2jags. 23 Specifically, we ran three chains of different initial values with 50,000 iterations, 5,000 burn-in, and thinning equal to 10 after inspecting the autocorrelation plots of the monitored parameters. We checked for convergence using the function mcmc_diagnostics of the package that considers the Gelman–Rubin convergence diagnostic. 24 We illustrated the calculated percentage MP and posterior distribution of the percentage MP for each reference-controlled trial using a forest plot obtained via the function baseline_model. A detailed description of the methods used to illustrate the results can be found in the Supplemental material under Technical notes. All figures were created using the R package ggplot2. 25 The analysed dataset and all functions related to this manuscript are available online at https://github.com/LoukiaSpin/Predict-missing-participants-NMA- future-trial.git.
Results
Baseline effects model in placebo-controlled trials
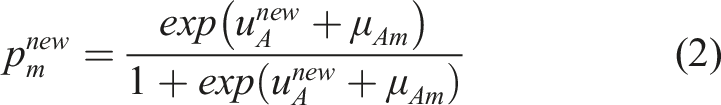
The baseline effects model revealed substantial variation in the percentage MP for placebo (primary analysis) across the trials (Figure 2). The estimated between-trial standard deviation was fairly high at 0.61, with a 95% credible interval (CrI) from 0.42 to 0.94. In most trials, the observed percentage MP (green points) was identical or close to the corresponding posterior mean of percentage MP (red points). The posterior mean of the summary percentage MP was 19% (95% CrI: 14 to 24%). The posterior mean of the predicted percentage MP was accompanied by a wider 95% CrI (6 to 46%) due to the substantial heterogeneity. We incorporated the posterior mean and precision of the predicted percentage MP for placebo into the relative effects model via equation (4), where Forest plot on the posterior means (red points) and 95% credible intervals of the trial-specific percentage of missing participants in the placebo arm of the trials. Green points refer to the corresponding calculated percentage of missing participants. Both points appear with opaqueness when the posterior mean overlaps with the calculated percentage of missing participants in a trial. The grey vertical dashed lines refer to the posterior summary percentage of missing participants in the placebo. SD, standard deviation.
Predictive distribution of the percentage of missing participants
Both analyses yielded almost identical posterior means and standard deviations of predicted percentage MP for each (non-reference) intervention (Figure 3). Furthermore, LABA, ICS and ICS + LABA were associated with a similar predicted percentage of MP and uncertainty (Figure 3). Based on NMA, the predicted percentage MP was 16% (95% CrI: 4 to 37%) for LABA, 17% (95% CrI: 4 to 40%) for ICS, 16% (95% CrI: 4 to 38%) for ICS+LABA, and 12% (95% CrI: 3 to 30%) for tiotropium. Under PMA, the predicted percentage MP was 15% (95% CrI: 4 to 36%) for LABA, 16% (95% CrI: 4 to 40%) for ICS, 17% (95% CrI: 4 to 43%) for ICS + LABA, and 11% (95% CrI: 3 to 30%) for tiotropium. Therefore, in a future trial on the population of the analysed dataset, a placebo is more likely to attract a relatively high percentage of MP, around 19% on average. The remaining interventions are more likely to attract a moderate percentage of MP, between 12% and 17% on average, with tiotropium being on the lower bound. Density plots on the predicted percentage of missing participants for each intervention and analysis. The vertical dotted lines refer to the percentage of missing participants observed in the corresponding trials. Areas of green, orange and red refer to a low (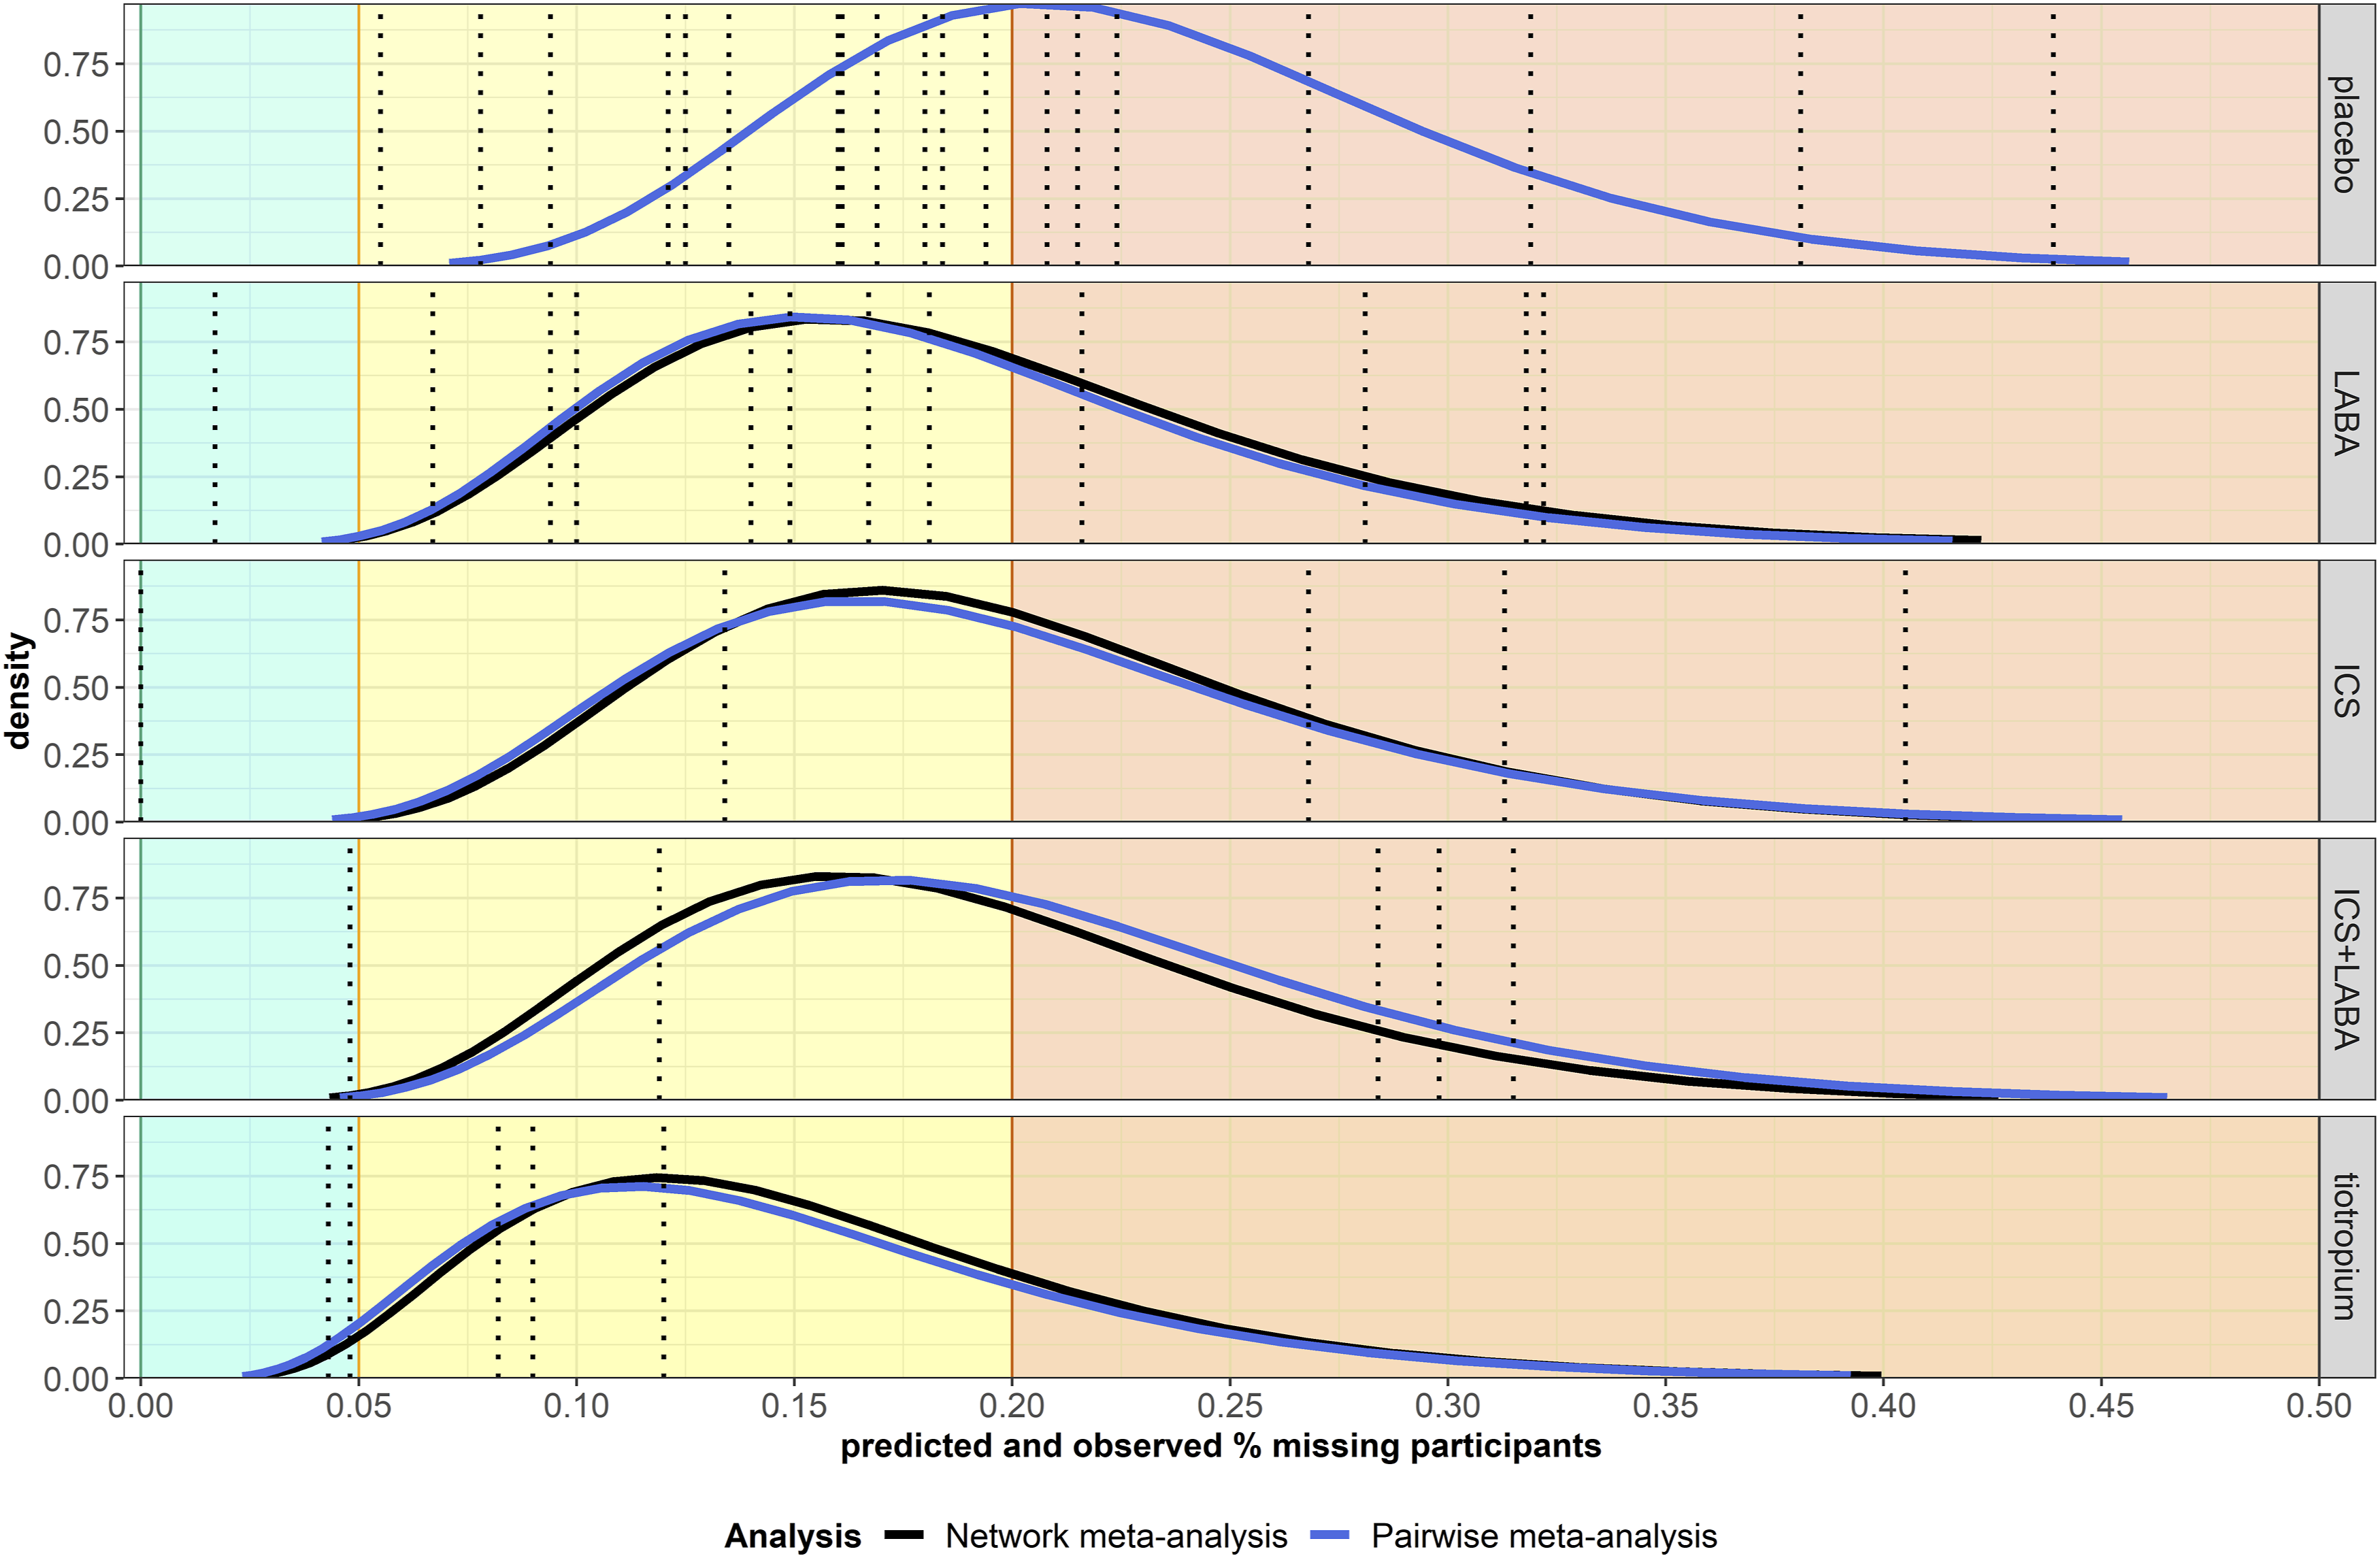
The almost identical posterior distributions of predicted percentage MP in both analyses may be attributed to yielding a similar posterior mean of odd ratio, though more precise under NMA (Supplemental Figure S1(a) in Supplemental material), and assigning the same informative prior distribution on
Percentage difference in missing participants
The great variability of percentage MP observed across the trials for each intervention (Figure 3) also manifested as considerable variability in the percentage difference in MP compared to NMA (Figure 4). Apart from tiotropium, all interventions included trials that yielded larger (red bars) or smaller (green bars) percentage MP than NMA, with the absolute percentage difference ranging from small values (1 to 6% in placebo and 5 to 6% in LABA) to at least 100% (placebo, LABA and ICS). In tiotropium, the percentage difference ranged from −64 to −25% in four trials and reached 1% in one trial only. Bar plots on the percentage difference in missing participants from each trial (observed missing participants) to network meta-analysis (predicted missing participants) for each intervention. The green and red bars refer to the reduction and increase in the percentage difference, respectively. Bars are sorted in increasing order. ICS, inhaled corticosteroid; LABA, long-acting β2-agonist.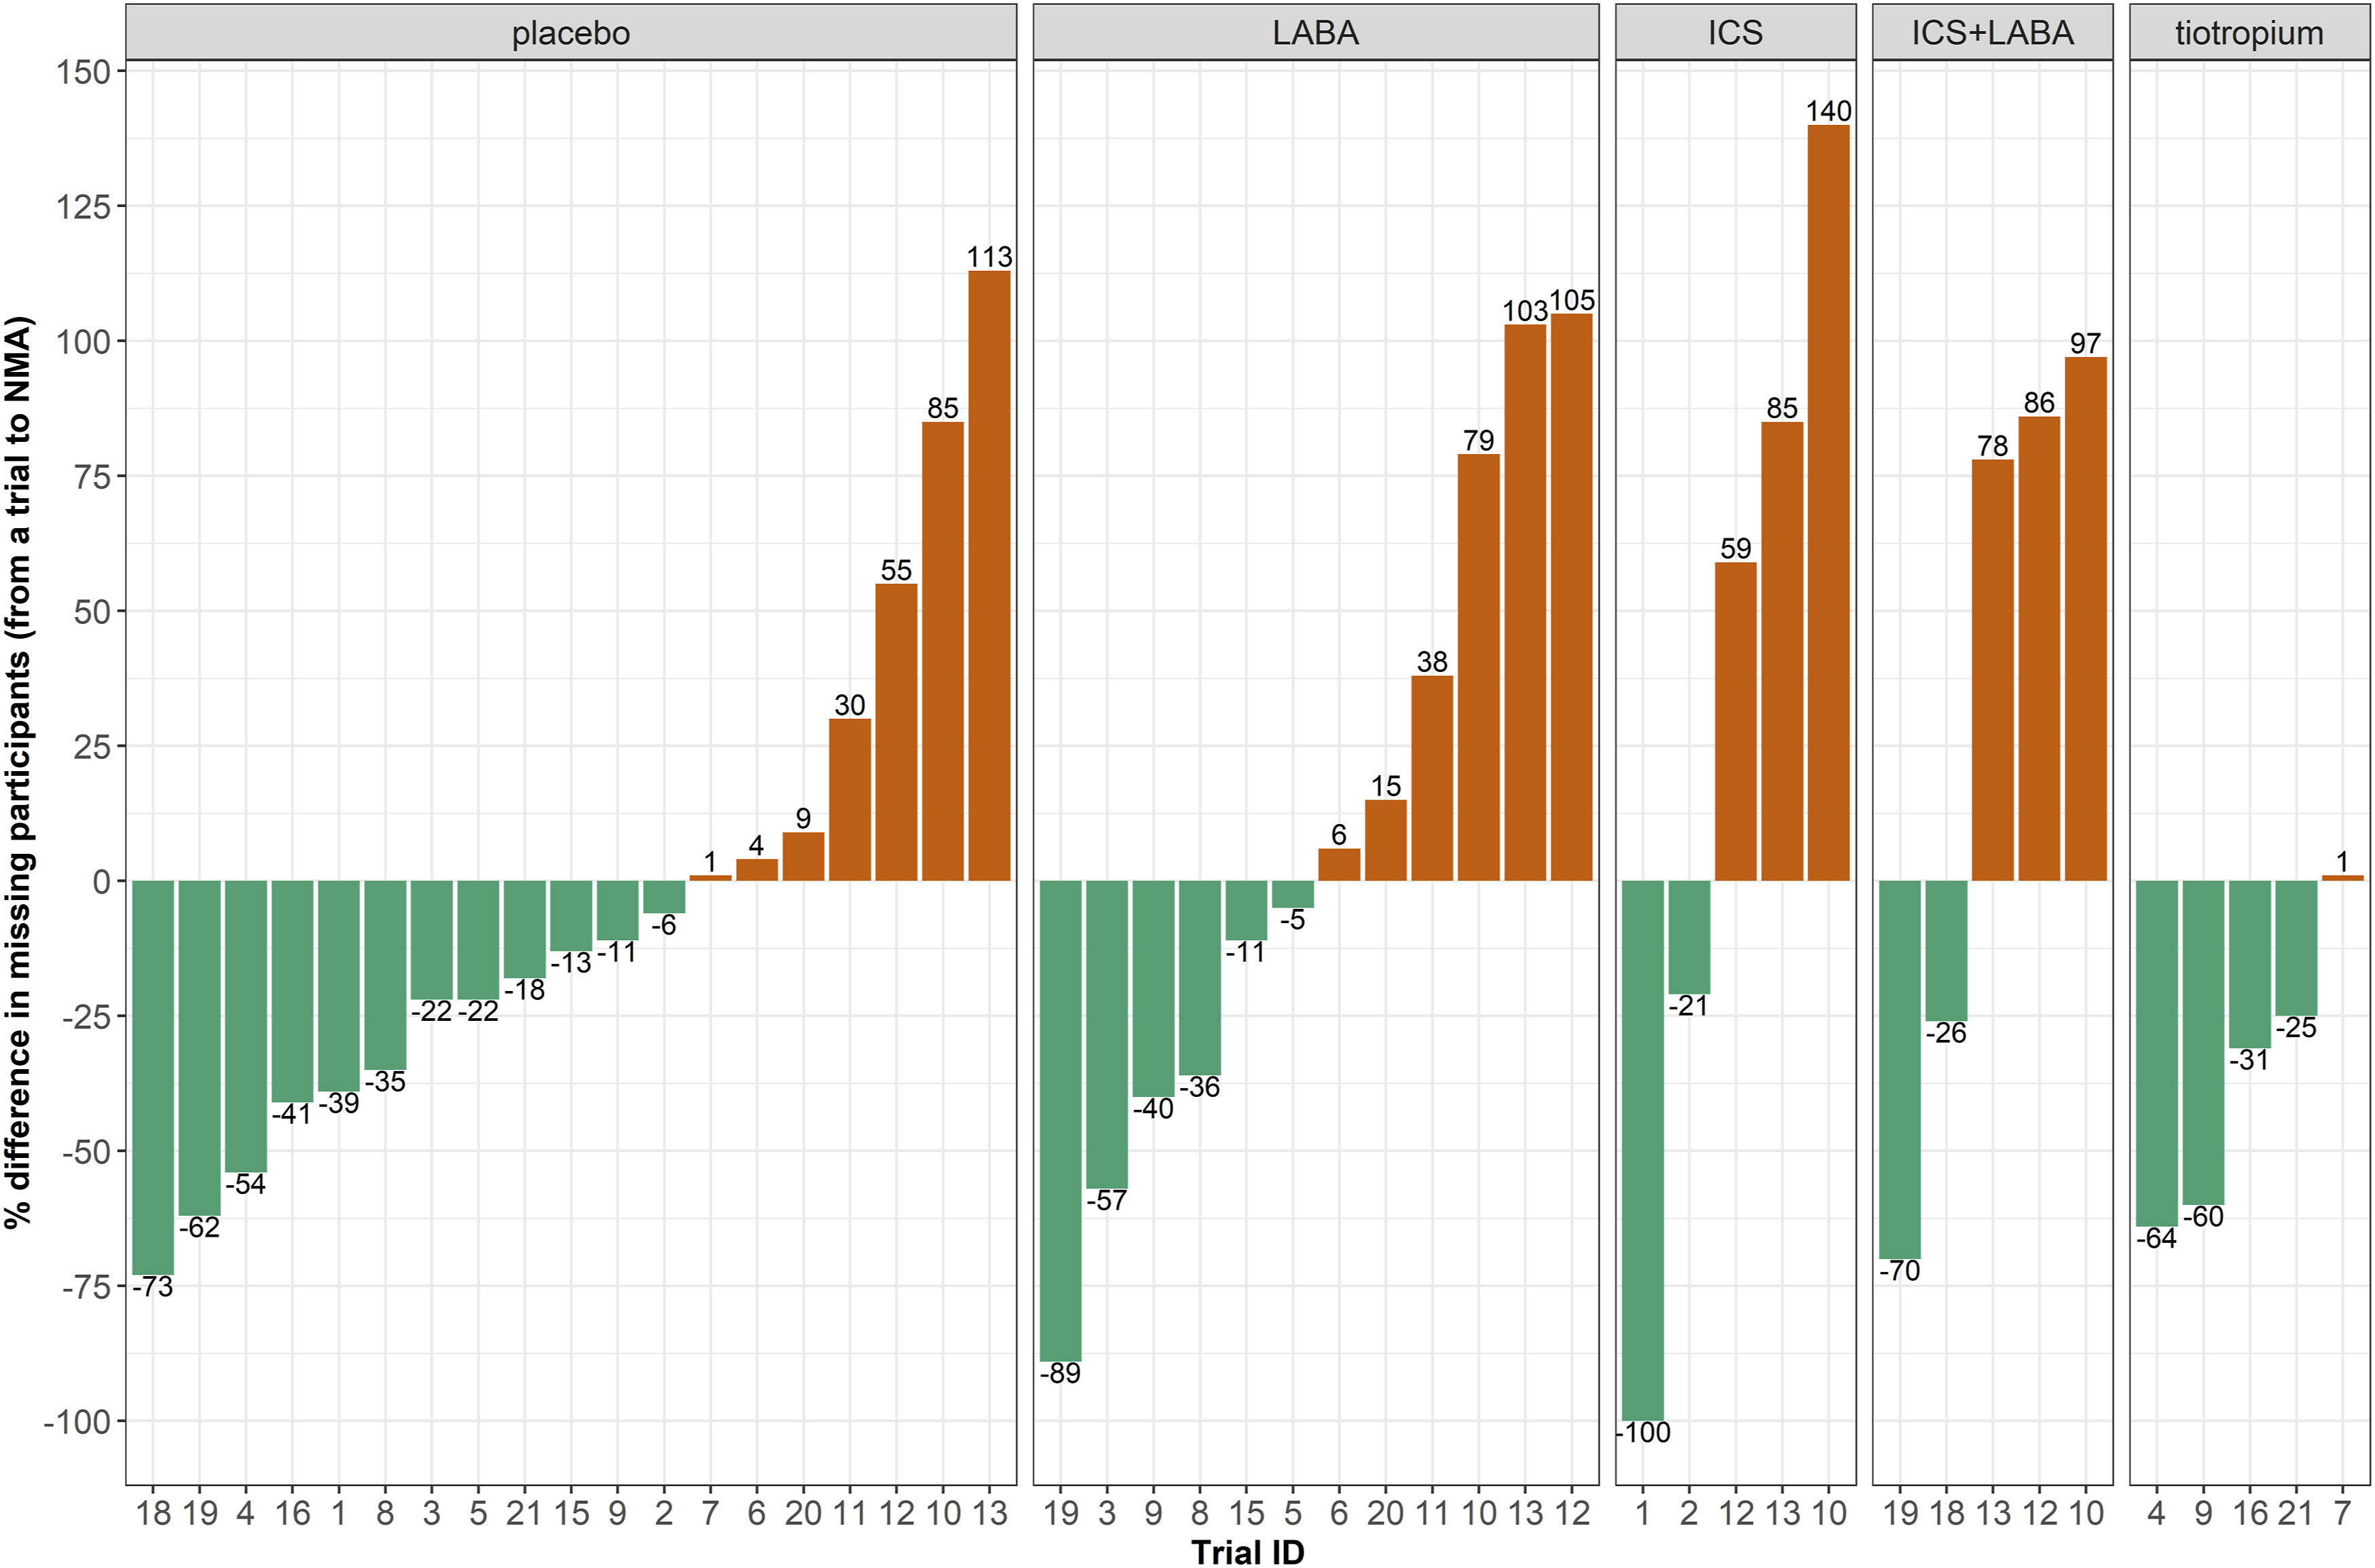
Implications of using different reference interventions
Supplemental Figure S2 (in Supplemental material) presents a panel of forest plots on the posterior distributions of percentage MP for each non-placebo intervention obtained from the corresponding baseline effects model. Different baseline effects models yielded different summary percentages of MP: ICS and ICS + LABA were associated with a similarly large summary percentage of MP (21% and 19% with 95% CrI: 3 to 53% and 5 to 47%, respectively), followed by LABA (13% with 95% CrI: 8 to 21%) and tiotropium (7% with 95% CrI: 4 to 11%). The different baseline effects for the reference interventions substantially affected the predictive distribution of percentage MP for all interventions obtained from the corresponding relative effects models (Figure 5). Specifically, the posterior mean of predicted percentage MP ranged from 5 to 27% for placebo, 8 to 25% for tiotropium and 6 to around 31% for the remaining interventions. When ICS or ICS + LABA comprised the reference interventions, the predicted percentage MOD indicated high missingness (22 to 32%) with considerable uncertainty for all interventions. Contrariwise, when tiotropium was the reference intervention, the predicted percentage of MP was associated with low levels of moderate missingness (5 to 8%) for all interventions. The results demonstrated the importance of carefully pre-specifying the reference intervention for the baseline and relative effects models. Interval plots on the predicted percentage of missing participants for each intervention (facets) using a different reference intervention (x-axis). Green and blue lines refer to the network and pairwise meta-analysis, respectively. The numbers refer to the posterior mean of the predictive distribution. ICS, inhaled corticosteroid; LABA, long-acting β2-agonist.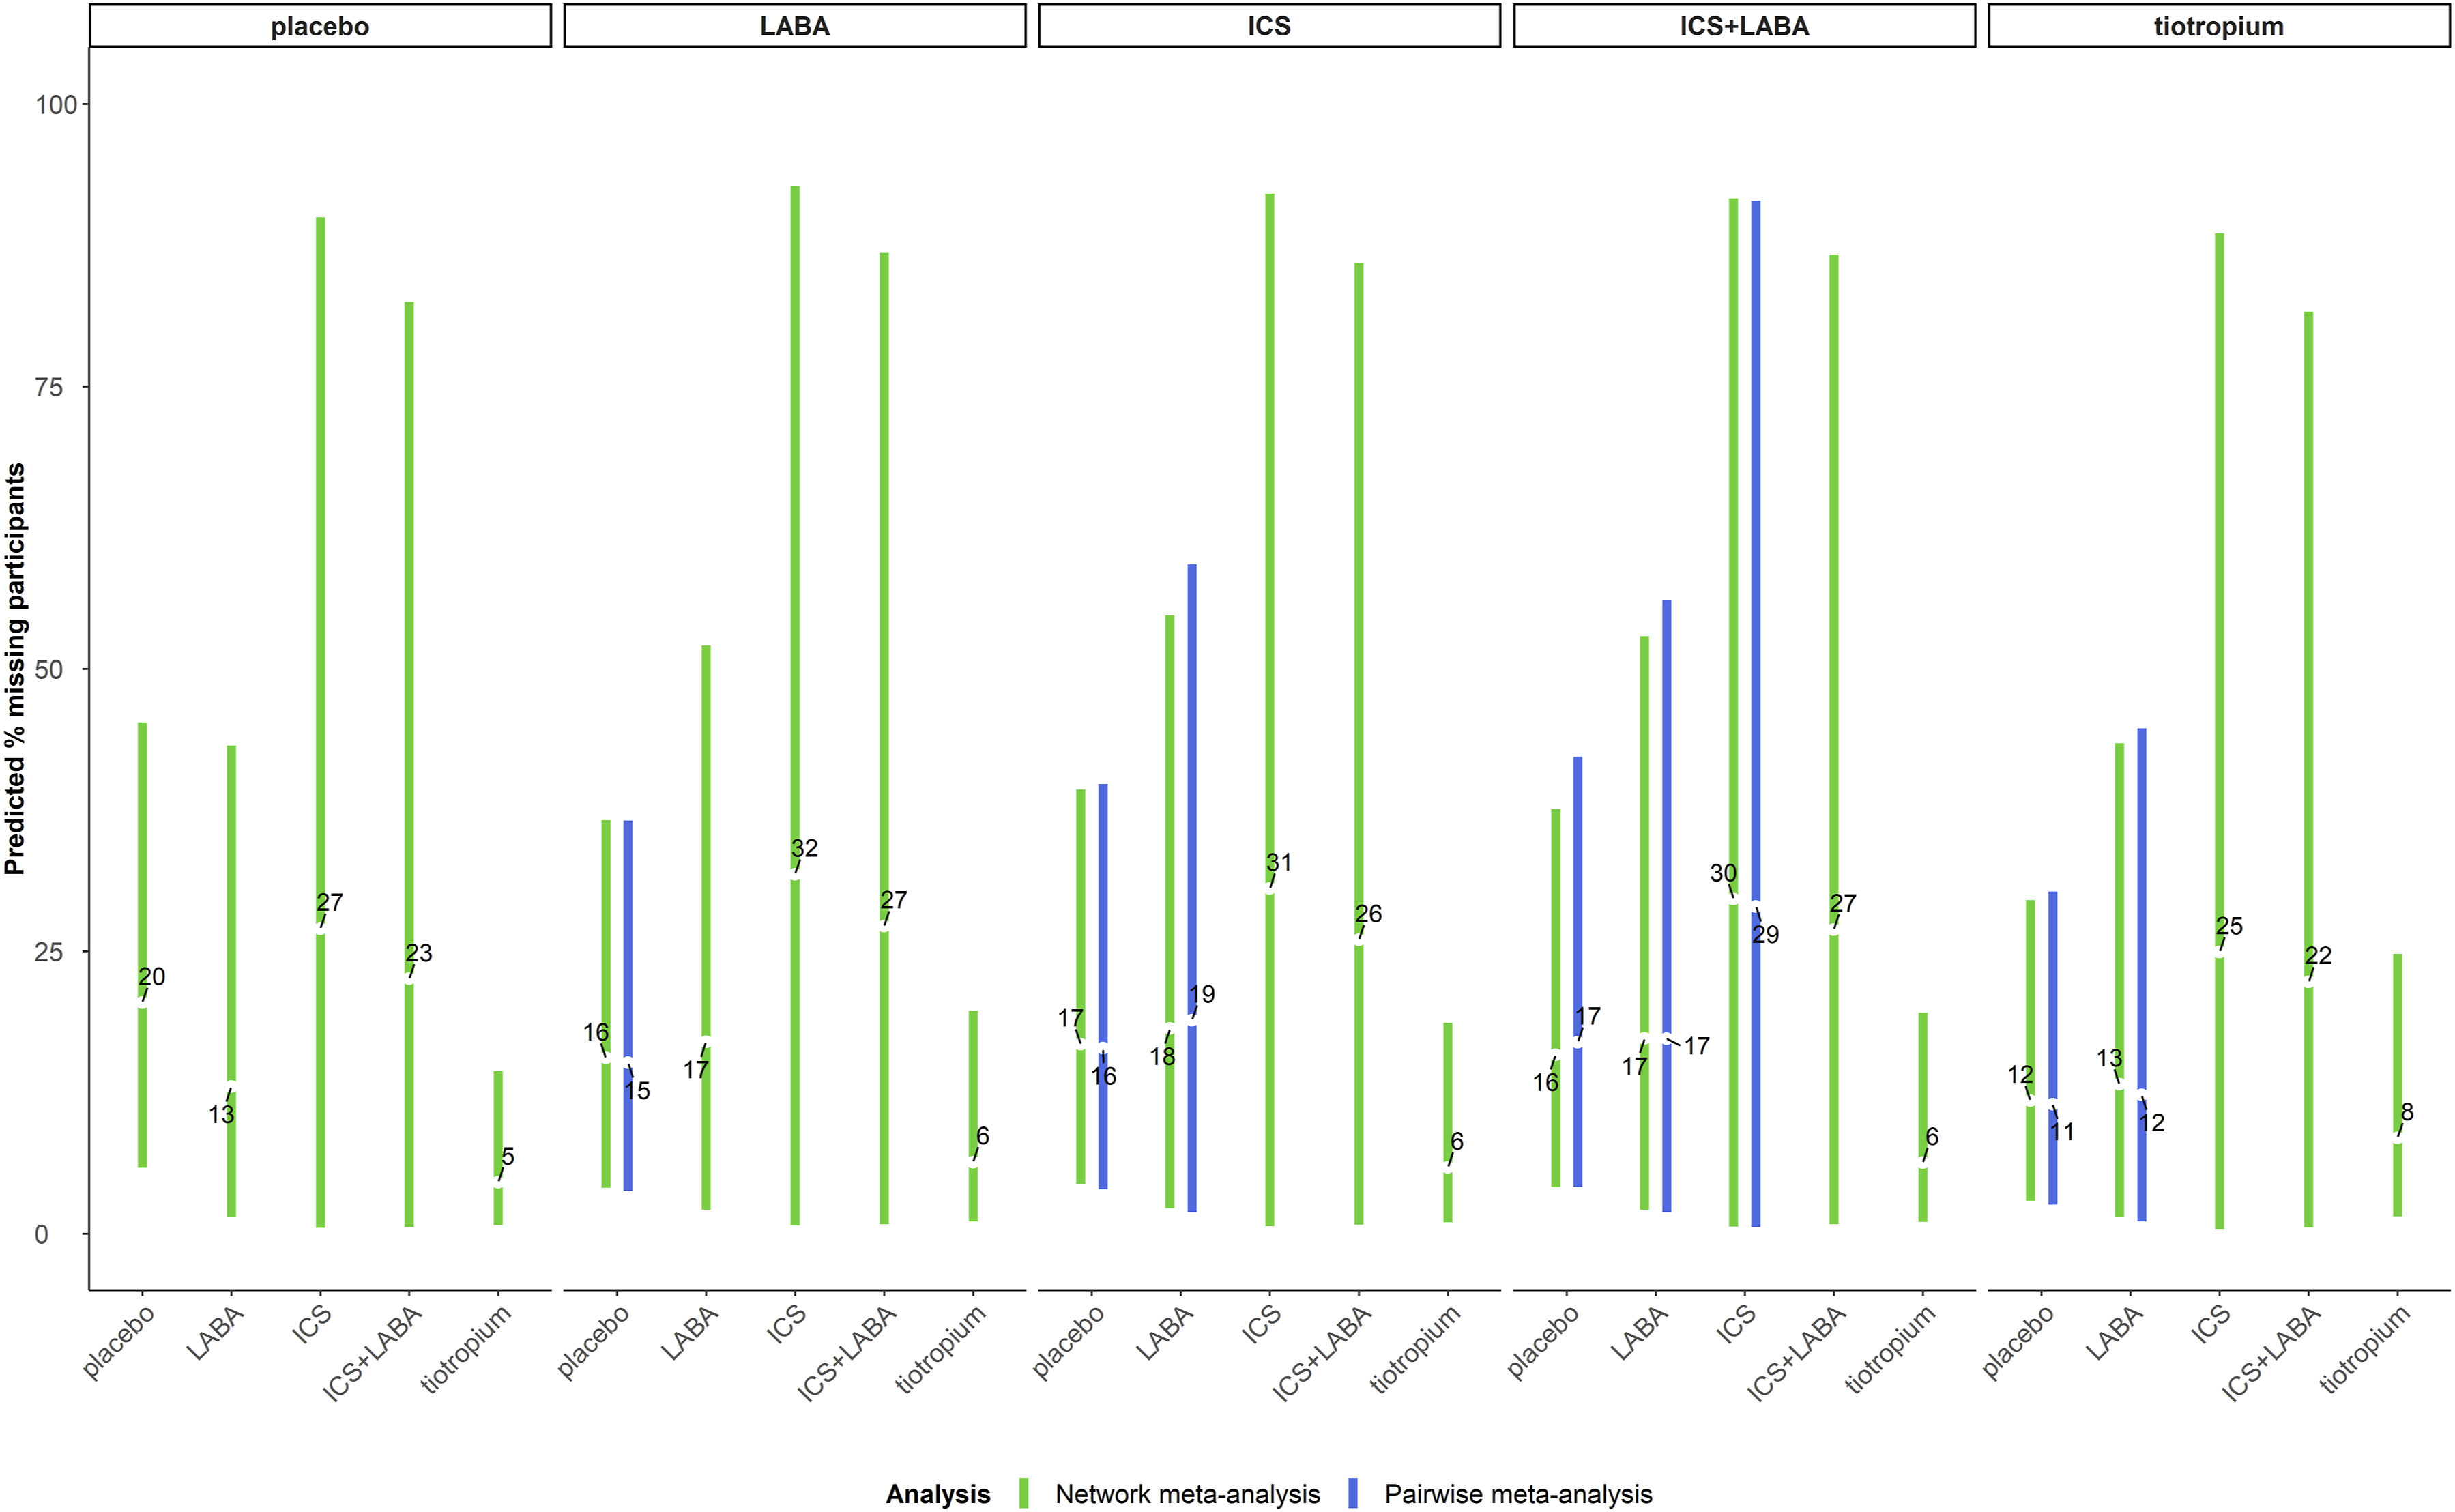
Discussion
Using all available evidence, we illustrated the synergism of the baseline effects model and NMA to reckon the percentage MP anticipated for a future trial. The present work contributed to the growing literature on the importance of NMA in planning future trials26,27 by demonstrating another advantage of NMA in this direction: maximising the information on the extent of MP in the network to make predictions for the interventions of interest in a future trial. Being an inevitable challenge in conducting and analysing a clinical trial, MP should be an integral part of designing a new trial. We illustrated that individual trials reflected only a fragment of the extent of MP for a specific set of interventions and target patient population. Using NMA, we naturally obtained a predictive distribution of the percentage MP for each intervention while accounting for the variability of MP across the included trials. Contrariwise, selecting any trial for the comparison under investigation resulted in considerably different calculations of percentage MP for a future trial (Figure 4), which has ethical and logistic implications for the planned trial.
We acknowledge that using the same set of trials in the baseline and relative effects models contradicts recommendations that emphasise constructing the baseline effects model independently from the relative effects model.18,19 This constitutes the main limitation of the present study. Developing the evidence base for the baseline effects model would require appropriate sources of evidence defined by a multidisciplinary group of experts for the condition, population and intervention under investigation. Additional considerations would apply to developing the relative effects model, 28 such as defining the evidence base, the set of interventions under investigation and selecting the reference intervention upon which the baseline effects model will be based.
The analyses revealed that NMA and PMA yielded almost identical predictive distributions of percentage MP. Based on this evidence, one may argue opting for PMA than NMA to predict the percentage MP for a future trial as the latter is more labour-intensive. However, such a perspective is misplaced and harmful to the evergrowing evidence ecosystem. Αnalogising the evidence base for a specific research question with a puzzle, and NMA and PMA with the efforts to complete the puzzle, a well-planned and conducted NMA assembles and properly synthesises all scattered pieces of the evidence puzzle and even completes the puzzle by constantly updating the evidence base with the necessary trials. By design, a PMA considers a small fraction of the relevant evidence base; hence, PMA cannot assemble nor update the evidence base efficiently. For instance, assuming we plan to conduct a trial on tiotropium versus ICS. We will have to rely on different meta-analyses comparing tiotropium or ICS with other interventions yielding various predictions of percentage MP for tiotropιum and ICS (Figure 1(b)).
A possible scenario where NMA may yield different predictive distributions of absolute effects from PMA may be in the case of statistical inconsistency in the former. A considerable disagreement between the indirect and direct effects may result in an NMA summary effect that differs substantially from the PMA summary effect. This, in turn, may lead to inconsistent predicted absolute effects between PMA and NMA. The frequency and extent of inconsistency between PMA and NMA in the predicted absolute effects can be investigated empirically using a large set of NMAs and applying the models described in the present study. Such an empirical study can consider outcomes other than MP, as we acknowledge that an extensive collection of networks with complete information on MP for each arm of every trial would be challenging.
Guidance on incorporating the predictive distribution of percentage MP into the sample size calculation for a future study was not within the scope of this article. However, it would be intriguing to extend the sensitivity analysis framework of Cook and Zea to a network of interventions and encompass the predictive distributions of percentage MP to investigate the sensitivity of sample size to different assumptions about the missingness mechanisms. 29 To our knowledge, there is currently no research at the level of evidence synthesis to demonstrate how to incorporate MP from a series of relevant past trials into the design of a future trial.
Conclusions
Predictions and absolute effects constitute an integral part of evidence synthesis and play an important role in decision-making. The present study demonstrated the synergistic benefits of predictions and absolute effects in the context of MP in NMA based on an established methodology. NMA can assist in detecting and prioritising comparisons of interventions with knowledge gaps to be investigated in a future trial. 9 Then, using the framework of predictions alongside the absolute effects, NMA can determine the anticipated percentage MP in the compared interventions. Incorporating MP in planning a future trial through the evidence synthesis framework merits methodological attention.
Supplemental Material
Supplemental Material - Using network meta-analysis to predict the percentage of missing participants for a future trial
Supplemental Material for Using network meta-analysis to predict the percentage of missing participants for a future trial by Loukia M Spineli in Research Methods in Medicine & Health Sciences
Footnotes
Acknowledgements
The author alone is responsible for the views expressed in this article, and they should not be construed with the views, decisions, or policies of the affiliated institution.
Declaration of conflicting interests
The author(s) declared no potential conflicts of interest with respect to the research, authorship, and/or publication of this article.
Funding
The author(s) disclosed receipt of the following financial support for the research, authorship, and/or publication of this article: This work was supported by the German Research Foundation [Deutsche Forschungsgemeinschaft under grant number SP 1664/1-3].
Supplemental Material
Supplemental material for this article is available online.
References
Supplementary Material
Please find the following supplemental material available below.
For Open Access articles published under a Creative Commons License, all supplemental material carries the same license as the article it is associated with.
For non-Open Access articles published, all supplemental material carries a non-exclusive license, and permission requests for re-use of supplemental material or any part of supplemental material shall be sent directly to the copyright owner as specified in the copyright notice associated with the article.