
Abstract
An indirect comparison or network-meta analysis (NMA) can be performed to compare treatments that may not have been compared directly in head-to-head clinical trials. 1 However, before conducting an indirect comparison or NMA, it is important to assess heterogeneity between trials in terms of patient characteristics and study design to determine if it is appropriate to combine the results of multiple trials into one analysis. 1 The appropriate use of NMAs can lead to enhanced decision-making in situations where head-to-head clinical trials do not exist, but decision makers need to be aware of the potential issues that NMAs can cause if not performed appropriately.
In some disease areas, it may be pragmatically challenging or unethical to run conventional parallel design RCTs. For example, patients may not want to be randomized to placebo when equipoise no longer exists. For these reasons, more efficient “adaptive” designs, which allow patients to switch to the active interventions or higher doses within the trial, are increasingly being used. In the context of NMAs and indirect comparisons, this presents a methodological challenge, as data from such adaptive trial designs differ from conventional parallel design RCTs. Combining the results of adaptive and parallel trial designs in network meta-analysis will bias the findings if this is not considered. 2
In this paper, we describe the potential approaches that can be considered to adjust findings derived from adaptive study designs to make them more comparable with findings derived from conventional parallel design RCTs. We investigate the advantages and pitfalls of using such approaches or failing to incorporate such adjustments into NMAs. To illustrate the advantages and disadvantages of the proposed approaches, we discuss the methods in the context of an example comparing anti-tumor necrosis factor drugs (anti-TNFs) for moderately to severely active ulcerative colitis (UC).
Methods
We aimed to investigate the advantages and pitfalls of methods to adjust for differences in study design when conducting an NMA using an applied case study, which compares anti-TNFs for moderately to severely active UC.
Anti-TNFs for Moderately to Severely Active Ulcerative Colitis
UC is a form of chronic inflammatory bowel disease (IBD) characterized by recurrent inflammation of the mucosal lining of the colon and rectum; although, the exact cause of UC is unknown. 3 Various treatment options are available to reduce the frequency and severity of UC symptoms. The primary drugs used to treat UC include 5-aminosalicylic acid (5-ASA), steroids, and immunosuppressive drugs, including azathioprine (AZA) and 6-mercaptopurine (6-MP). If patients do not respond to these treatments, then anti-TNF biological agents are used. Three anti-TNF agents have been approved for the treatment of moderately to severely active UC: adalimumab (ADA), infliximab (IFX), and golimumab (GLM). Several RCTs have been performed comparing each of ADA, IFX and GLM to a placebo, but there has not been a head-to-head clinical trial that directly compares the 3 anti-TNFs.
Network Meta-analyses of Anti-TNFs for Moderately to Severely Active Ulcerative Colitis
Our case study is based on findings reported in 3 separate NMAs comparing anti-TNFs for moderately to severely active UC.2,4,5 We selected the 3 NMAs for our case study because each NMA addressed heterogeneity in the study design using a different approach. Stidham and others 2 combined all RCTs and did not adjust for differences in study design. Danese and others 4 opted to report the direct results from the individual RCTs and did not report indirect estimates due to differences in study design. Thorlund and others 5 attempted to adjust for differences in study design before RCTs were combined. A summary of each of the NMAs is reported in Table 1, and the findings reported in each study are summarized in Supplemental Figure 1 and Supplemental Table 1.
Summary of Characteristics from Network Meta-Analyses comparing Anti-Tumor Necrosis Factor Drugs for Ulcerative Colitis
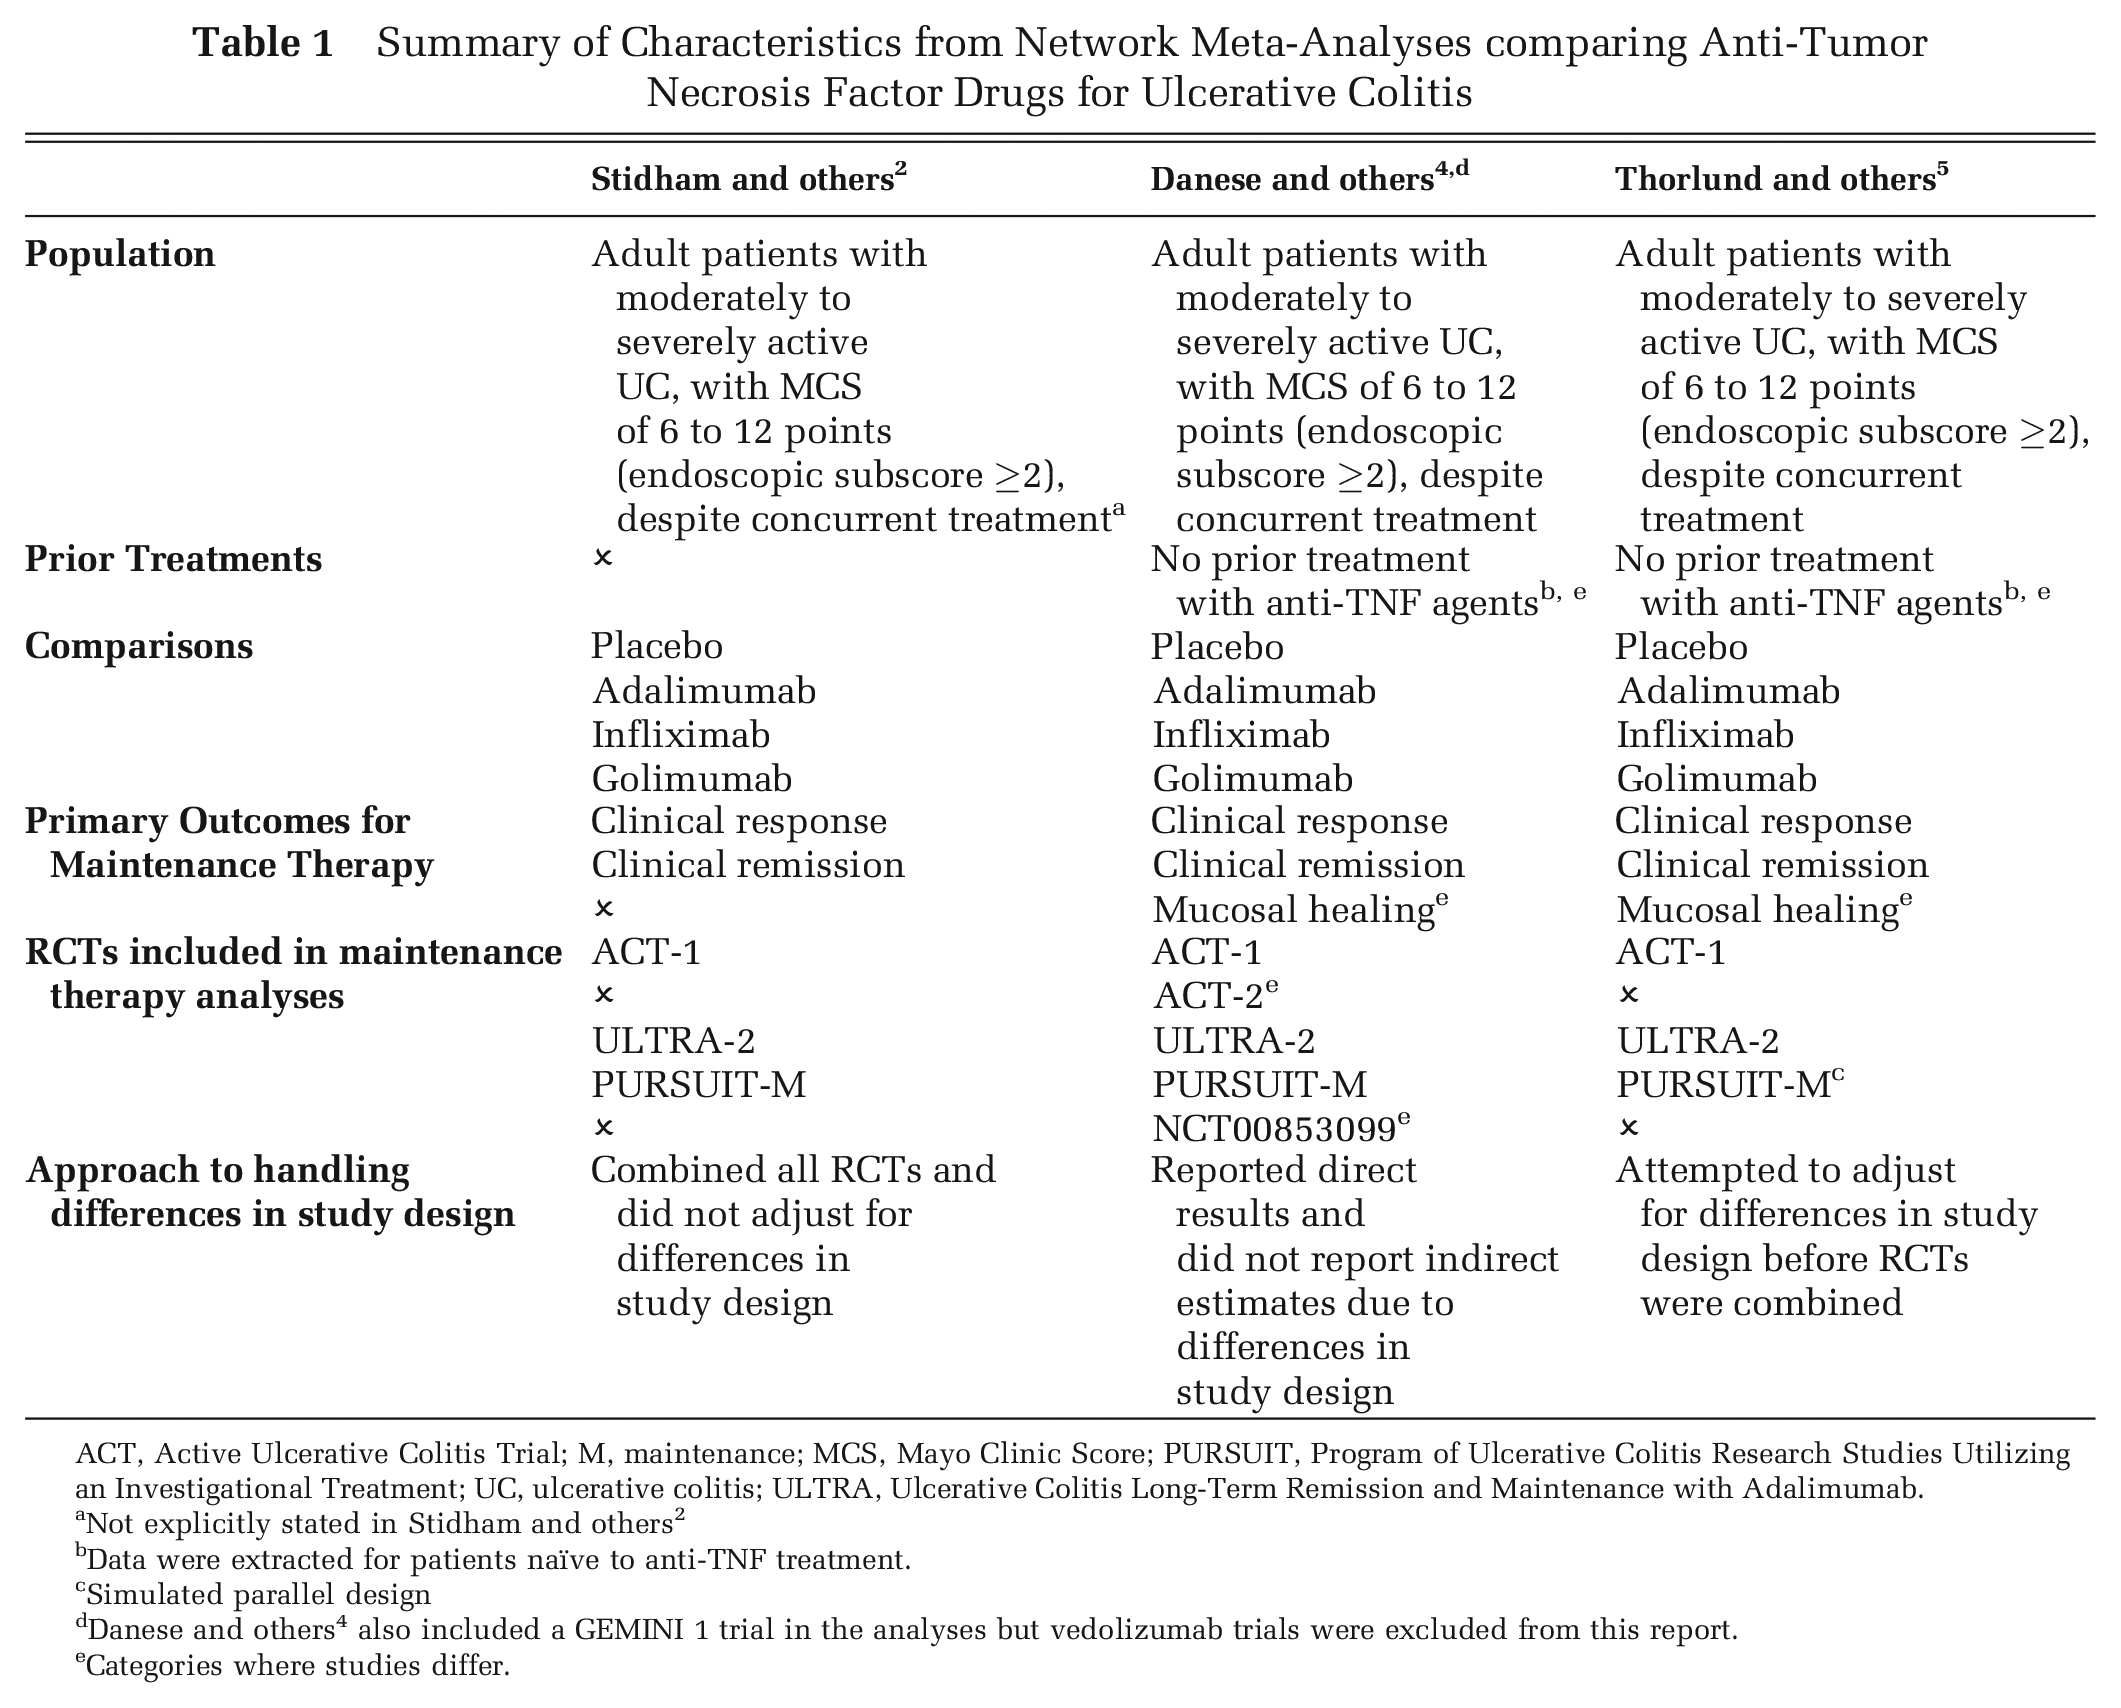
ACT, Active Ulcerative Colitis Trial; M, maintenance; MCS, Mayo Clinic Score; PURSUIT, Program of Ulcerative Colitis Research Studies Utilizing an Investigational Treatment; UC, ulcerative colitis; ULTRA, Ulcerative Colitis Long-Term Remission and Maintenance with Adalimumab.
Not explicitly stated in Stidham and others 2
Data were extracted for patients naïve to anti-TNF treatment.
Simulated parallel design
Danese and others 4 also included a GEMINI 1 trial in the analyses but vedolizumab trials were excluded from this report.
Categories where studies differ.
Evaluation of Trial Designs Used in RCTs Comparing Anti-TNFs for Moderately to Severely Active Ulcerative Colitis
Each of the NMAs was underpinned by a similar set of RCTs6–10 allowing us to replicate the findings of each NMA, as well as to compare the findings with or without adjusting for differences in study design (Table 1). A summary of the study and patient characteristics for RCTs included in each of the NMAs is provided in Supplemental Tables 2–4, and Figure 1 provides a summary of the study design characteristics among the underlying trials. In the RCTs with parallel design (ACT-1, ACT-2, ULTRA-2 and NCT00853099), there is one randomization event at the beginning of the induction phase, where participants are randomly assigned to a treatment. Regardless of participants’ response to treatment at the end of the induction phase, participants are kept on this treatment until the end of the maintenance phase (i.e., responders and non-responders at the end of induction are not allowed to change treatment). However, in the PURSUIT trial, there is a two-stage re-randomization design, where participants were re-assigned to treatments at the end of the induction phase depending on whether they responded to treatment. For example, participants who did not respond to placebo during the induction phase were re-assigned to the open-label GLM 100 mg during the maintenance phase. This adaptive study design used in the PURSUIT trials has several clinical and ethical benefits; for example, participants who do not respond to one treatment will be switched to another treatment or a higher dose to try to achieve a response. Accordingly, the adaptive study design employed in the PURSUIT trial may be perceived as being more realistic than a parallel design and considered a better reflection of what will happen during day-to-day treatment. Nonetheless, the study design clearly differs from conventional parallel design RCTs, and these differences in study design should be accounted for if they are combined in an NMA.
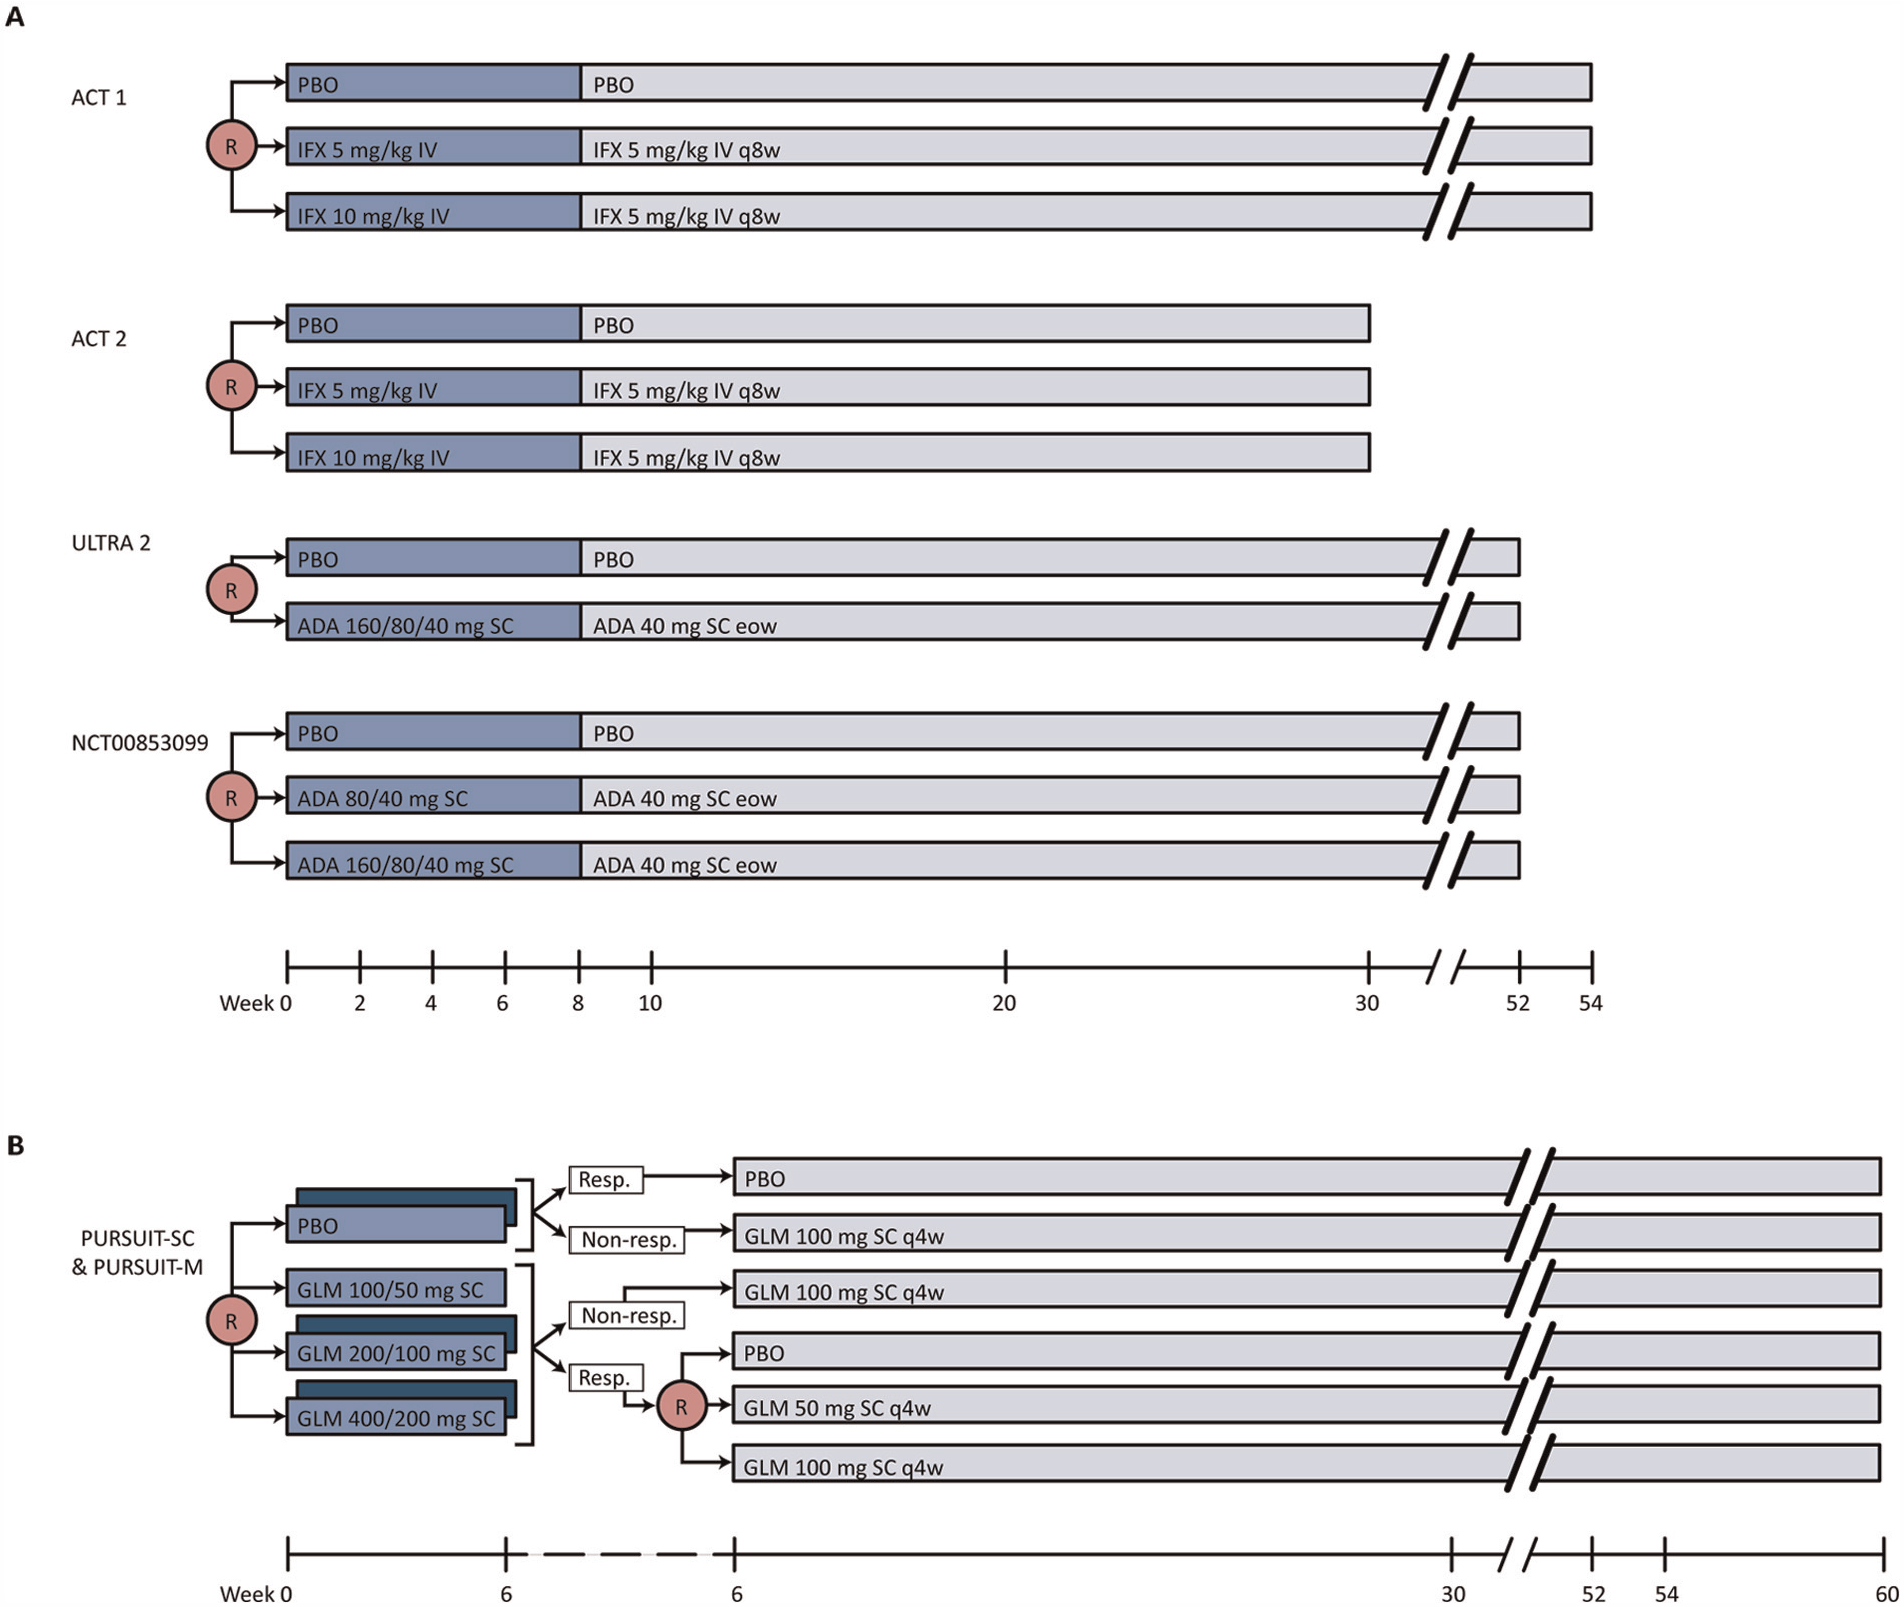
Summary of study design among underlying trials. (A) Study flow diagrams for ACT-1, ACT-2, ULTRA-2 and NCT00853099. (B) Study flow diagram for PURSUIT-SC and PURSUIT-M. Phase II of PURSUIT-SC is shown in dark blue and phase III of PURSUIT-SC is shown in light blue. Dotted section of timeline represents the 6-week time point (i.e., PURSUIT-SC trial ends at 6 weeks and PURSUIT-M trial begins at 6 weeks). Induction phases are shown in blue and maintenance phases are shown in grey. ACT, Active Ulcerative Colitis Trial; ADA, adalimumab; eow, every other week; GLM, golimumab; IFX, infliximab; M, maintenance; PBO, placebo; PURSUIT, Program of Ulcerative Colitis Research Studies Utilizing an Investigational Treatment; q4w, every 4 weeks; q8w, every 8 weeks; Resp., responders; R, randomization; SC, subcutaneous; ULTRA, Ulcerative Colitis Long-Term Remission and Maintenance with Adalimumab.
Conversion of PURSUIT Trial to Conventional Parallel RCT Design
In Box 1, we present the step-by-step mathematical calculations that can be employed to adjust endpoint data from PURSUIT to reflect a parallel design RCT. To perform this conversion, simple mathematical relationships are assumed to calculate the overall maintenance proportion from the PURSUIT trial for each of the 3 arms: GLM 100 mg, GLM 50 mg, and placebo. In conventional RCTs, the maintenance response is a combination of the patients who responded at induction and the patients who did not respond at induction. Accordingly, to approximate the proportion of patients who would have responded to GLM 100 mg at maintenance if no reallocation or re-randomization had occurred after induction (i.e., what would have occurred in a conventional RCT), the number of responders receiving GLM 100 mg is diluted by a factor of 3 (equivalent to the number of arms in PURSUIT) relative to the total number of induction responders. We subsequently diluted the number of non-responders by a factor of 3 (equivalent to the number of arms in PURSUIT). We also diluted the observed number of events accordingly, and combined these numbers to get a maintenance proportion of 41.8% ([78 + 43]/[154 + 135]) for GLM 100 mg.
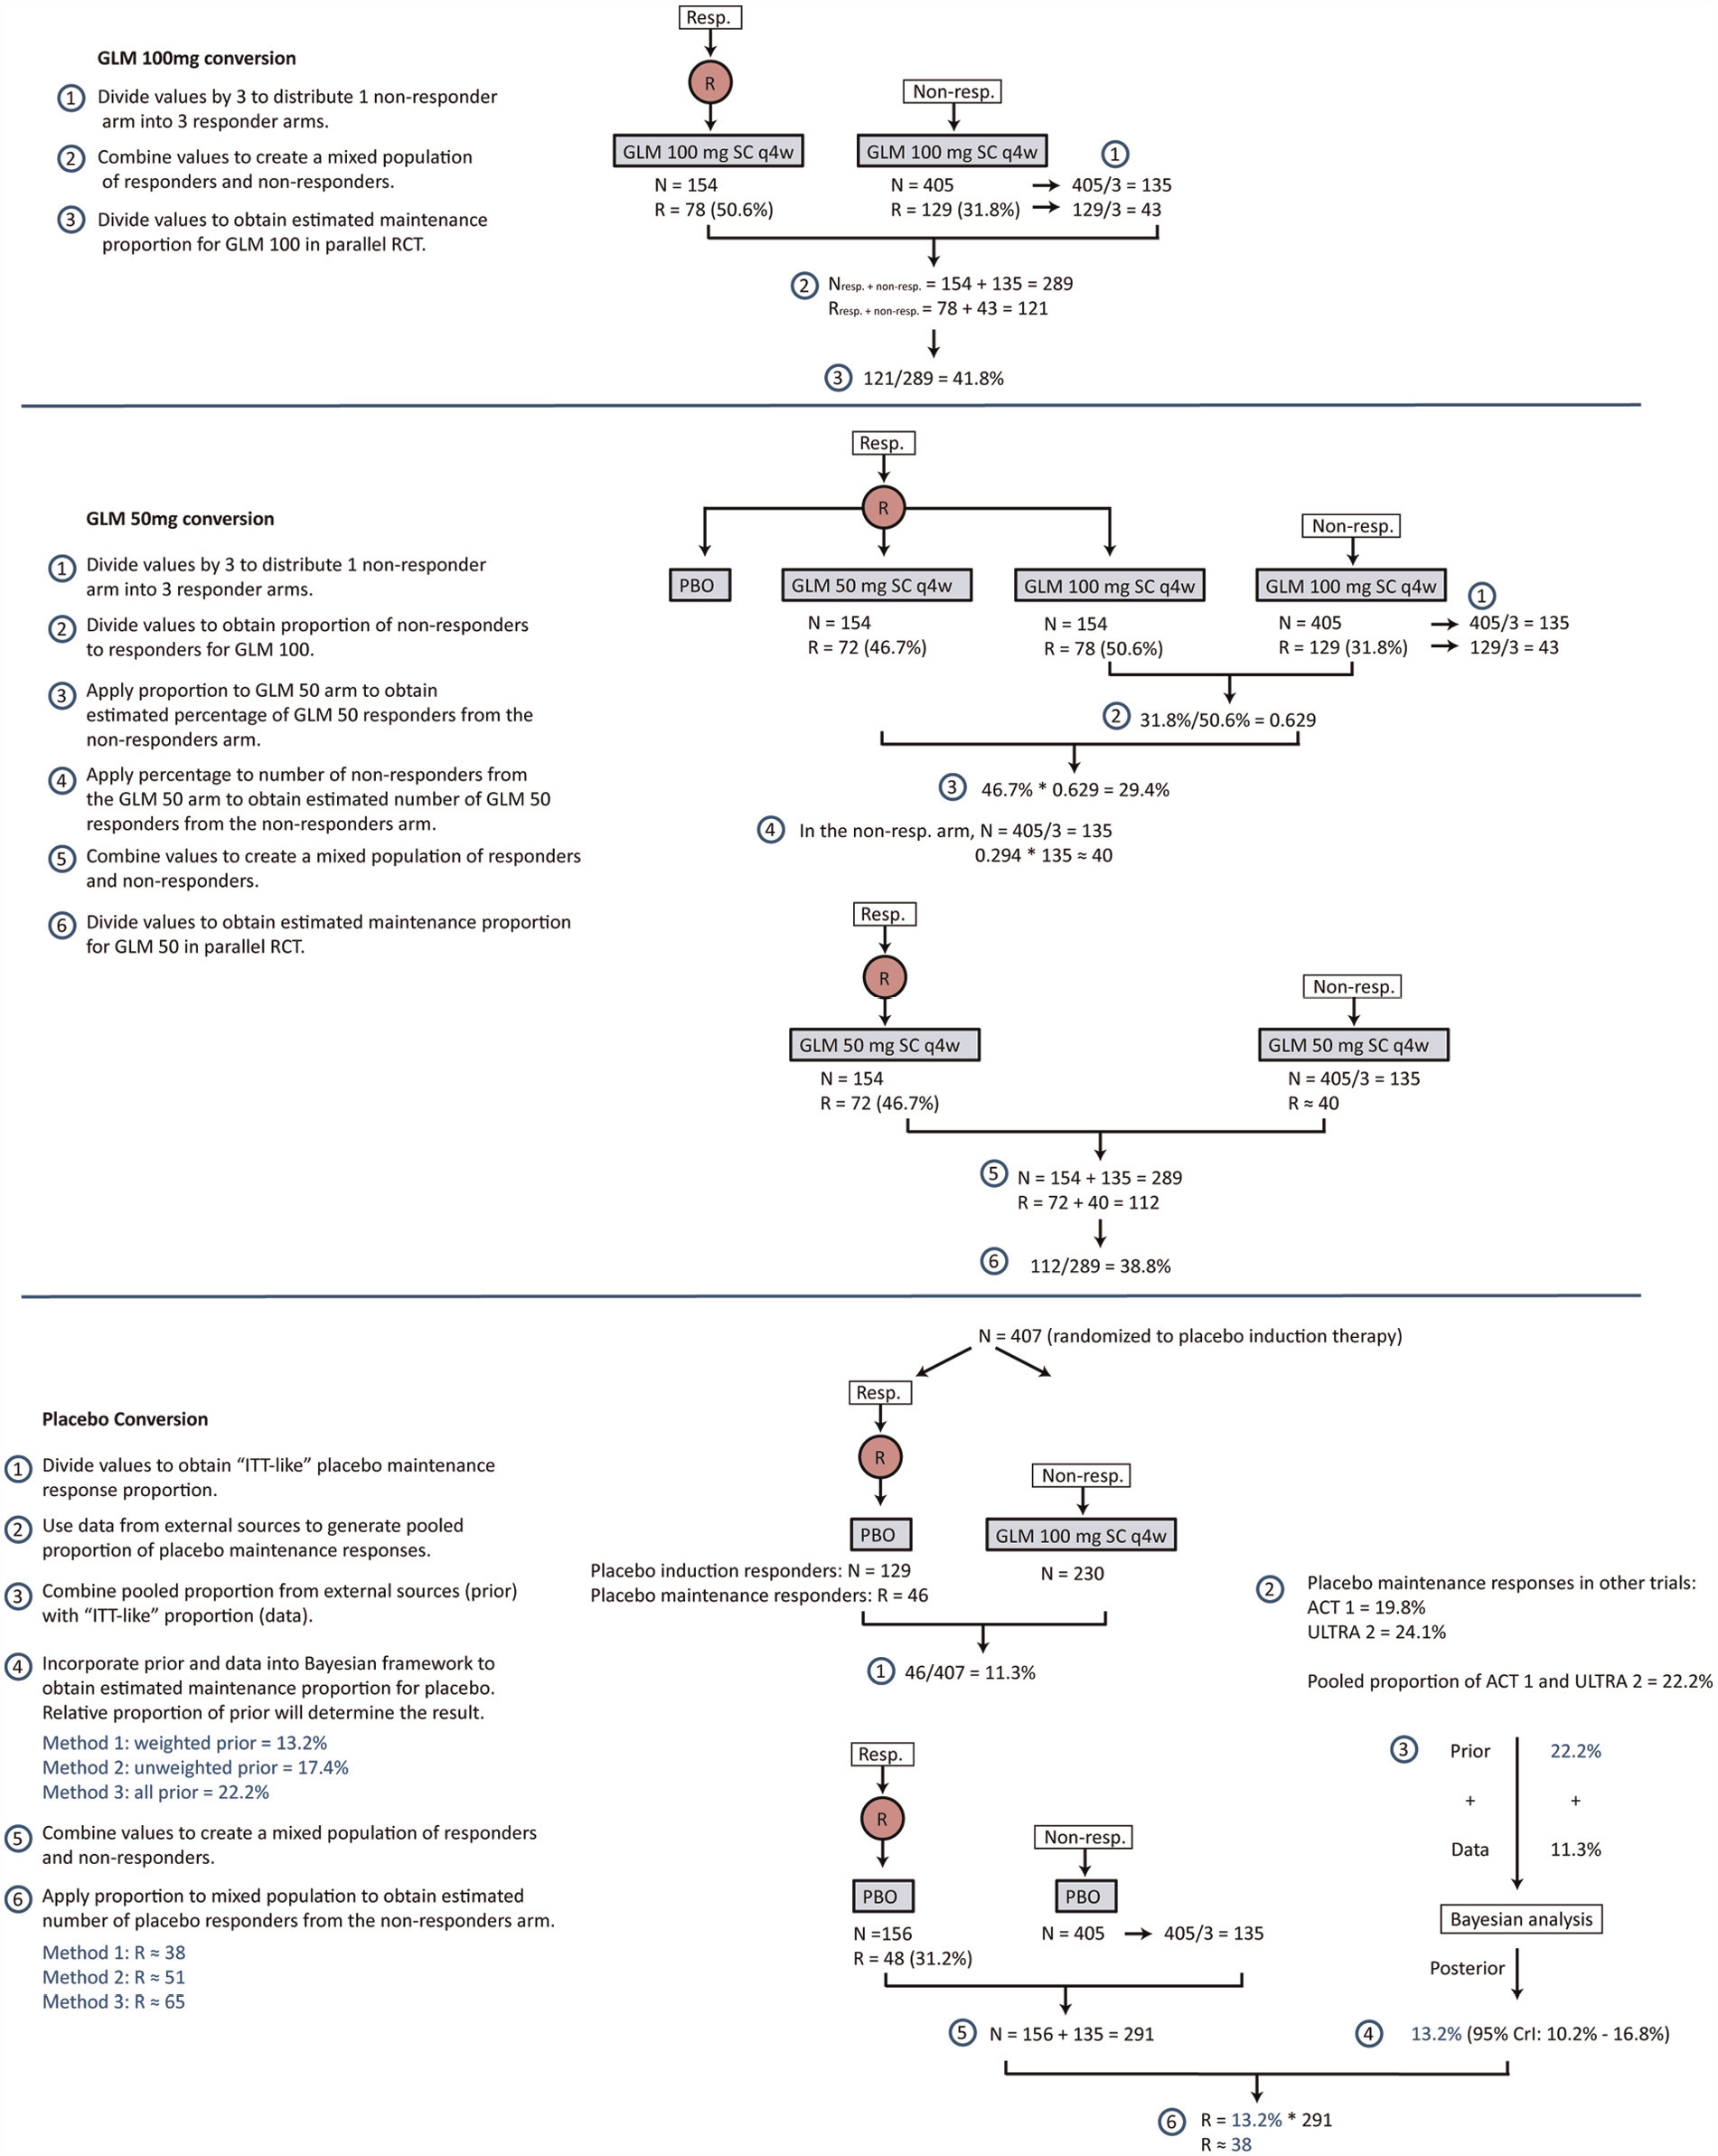
Calculations used to adjust endpoint data from PURSUIT to reflect a parallel design RCT.
With regard to GLM 50 mg, the calculations are more challenging, given that data are not available for the number of patients not responding to GLM induction therapy. We therefore imputed the maintenance proportion in patients receiving a 54-week course of GLM 50 mg by multiplying the relative efficacy between the 2 GLM 100 mg groups (GLM induction therapy responders and non-responders) by the maintenance response of GLM 50 mg. The analysis takes into account that there will be a loss in precision due to assuming only one-third of induction therapy non-responders could have hypothetically been randomized to GLM 50 mg.
Maintenance data for placebo was not available, as, after 6 weeks, all placebo induction non-responders were assigned to GLM 100 mg for the maintenance phase. However, the proportion of responders to the placebo induction therapy that also responded at the end of maintenance was reported (R = 46). Because the total number of patients randomized to placebo initially was N = 407, this yields an “intention-to-treat (ITT)-like” placebo proportion of responders of 11.3% (46/407), if we consider the non-responders receiving GLM 100 mg for maintenance therapy as dropouts. However, the assumption that all patients switching to GLM 100 mg would have dropped out had they not switched is likely too strong, and thus likely underestimates the placebo maintenance response. To lessen this downward bias, we combined the “ITT-like” observed proportion of maintenance responders with evidence from external sources—the ACT-1 and ULTRA-2 trials.
In the Bayesian framework, it is possible to incorporate external data in the form of prior distributions. In particular, the mean proportion of placebo responders from ACT-1 and ULTRA-2, as well as the uncertainty around this estimate, can be incorporated as a “prior” distribution of the placebo response in PURSUIT. To incorporate this information, a fixed-effect meta-analysis was performed to estimate the pooled proportion of the placebo response from ACT-1 and ULTRA-2 with 95% credible intervals (CrI). These results were subsequently transformed to the logit scale because the outcome (clinical response) was dichotomous. The corresponding variance (precision estimate) was then used in the Bayesian model as the “prior”. These sources of information were combined by turning the ACT-1 and ULTRA-2 proportions into prior distributions and mixing them with the “ITT-like” placebo proportion from PURSUIT. The pooled proportion of the ACT-1 and ULTRA-2 proportions was 22.2% (95% CrI: 17.3% to 27.7%). We considered 3 scenarios of how to incorporate this proportion for use in the data conversion. In the first scenario, we assumed that we had limited confidence that the ACT-1 and ULTRA-2 placebo maintenance responses were representative of the same population and trial design as that of the PURSUIT trial, and deflated its impact on the pooled placebo proportion by inflating the standard error (Method 1: down-weighted), similar to Thorlund and others.5,11 In the second scenario, we assumed that we had reasonable confidence that the ACT-1 and ULTRA-2 placebo maintenance responses were representative of the same population and trial design as that of the PURSUIT trial, and did not down-weight the prior (Method 2: unweighted). In the third scenario, we assumed we had zero confidence in the data or “ITT-like” proportion estimated from the PURSUIT trial, and assigned the placebo maintenance proportion based entirely on external data from ACT-1 and ULTRA-2 (Method 3: external data). Figure 2 depicts how the combination of the prior distribution and the likelihood (data) distribution form the posterior distribution to obtain a parallel placebo arm, using each of these 3 scenarios.
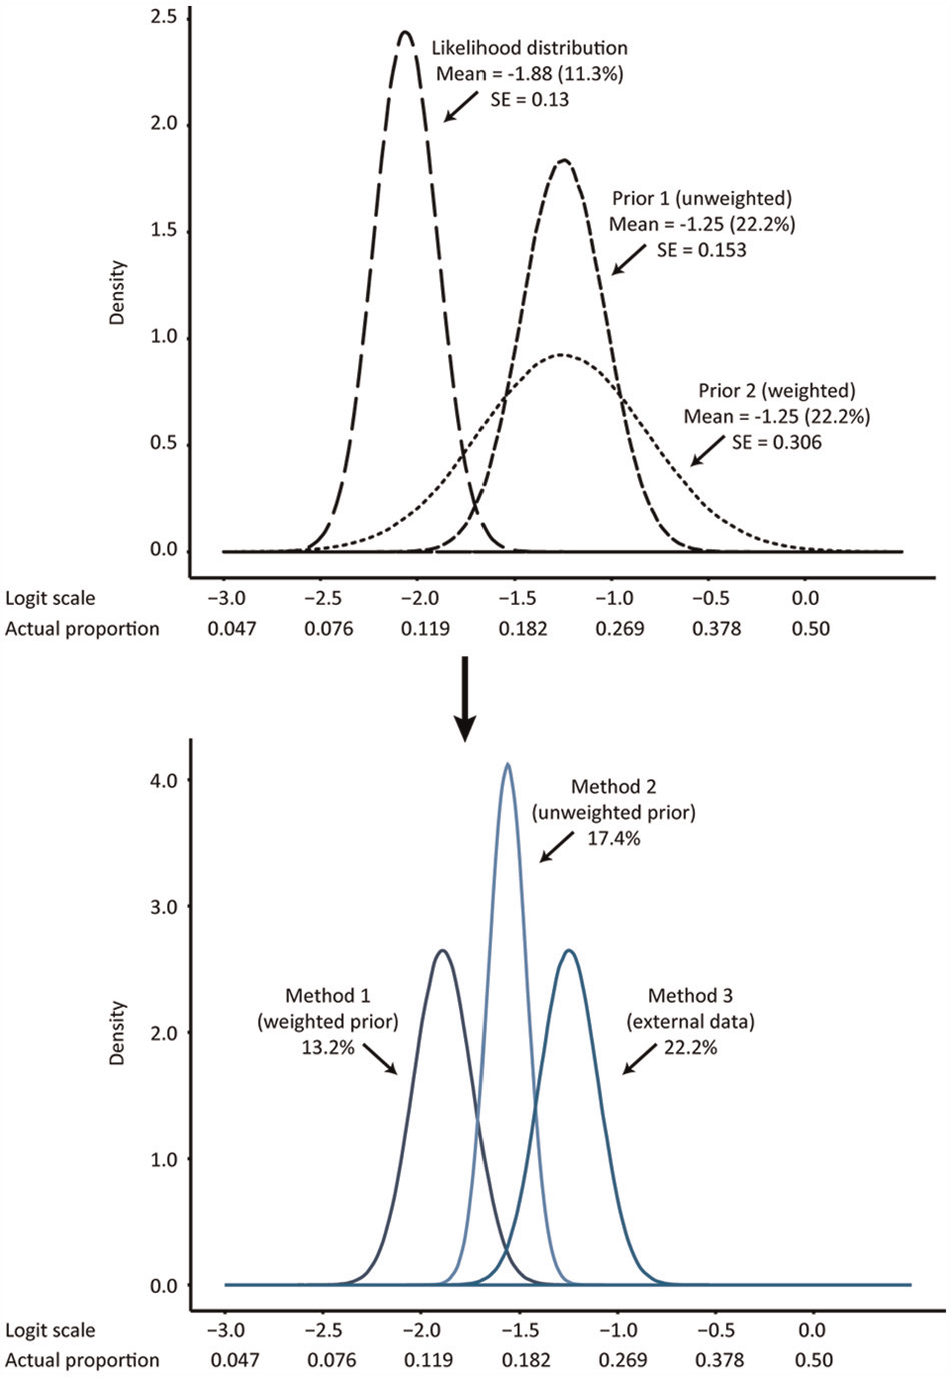
Illustration of the prior distribution for the placebo maintenance response shaped from the ACT-1 and ULTRA-2 data, mixed with the data from PURSUIT (the likelihood distribution) using the 3 methods. Collectively, the data yield the final posterior distribution for the placebo maintenance response for each of the 3 methods.
Network Meta-analysis of Unadjusted and Adjusted Analyses Accounting for Differences in Study Design
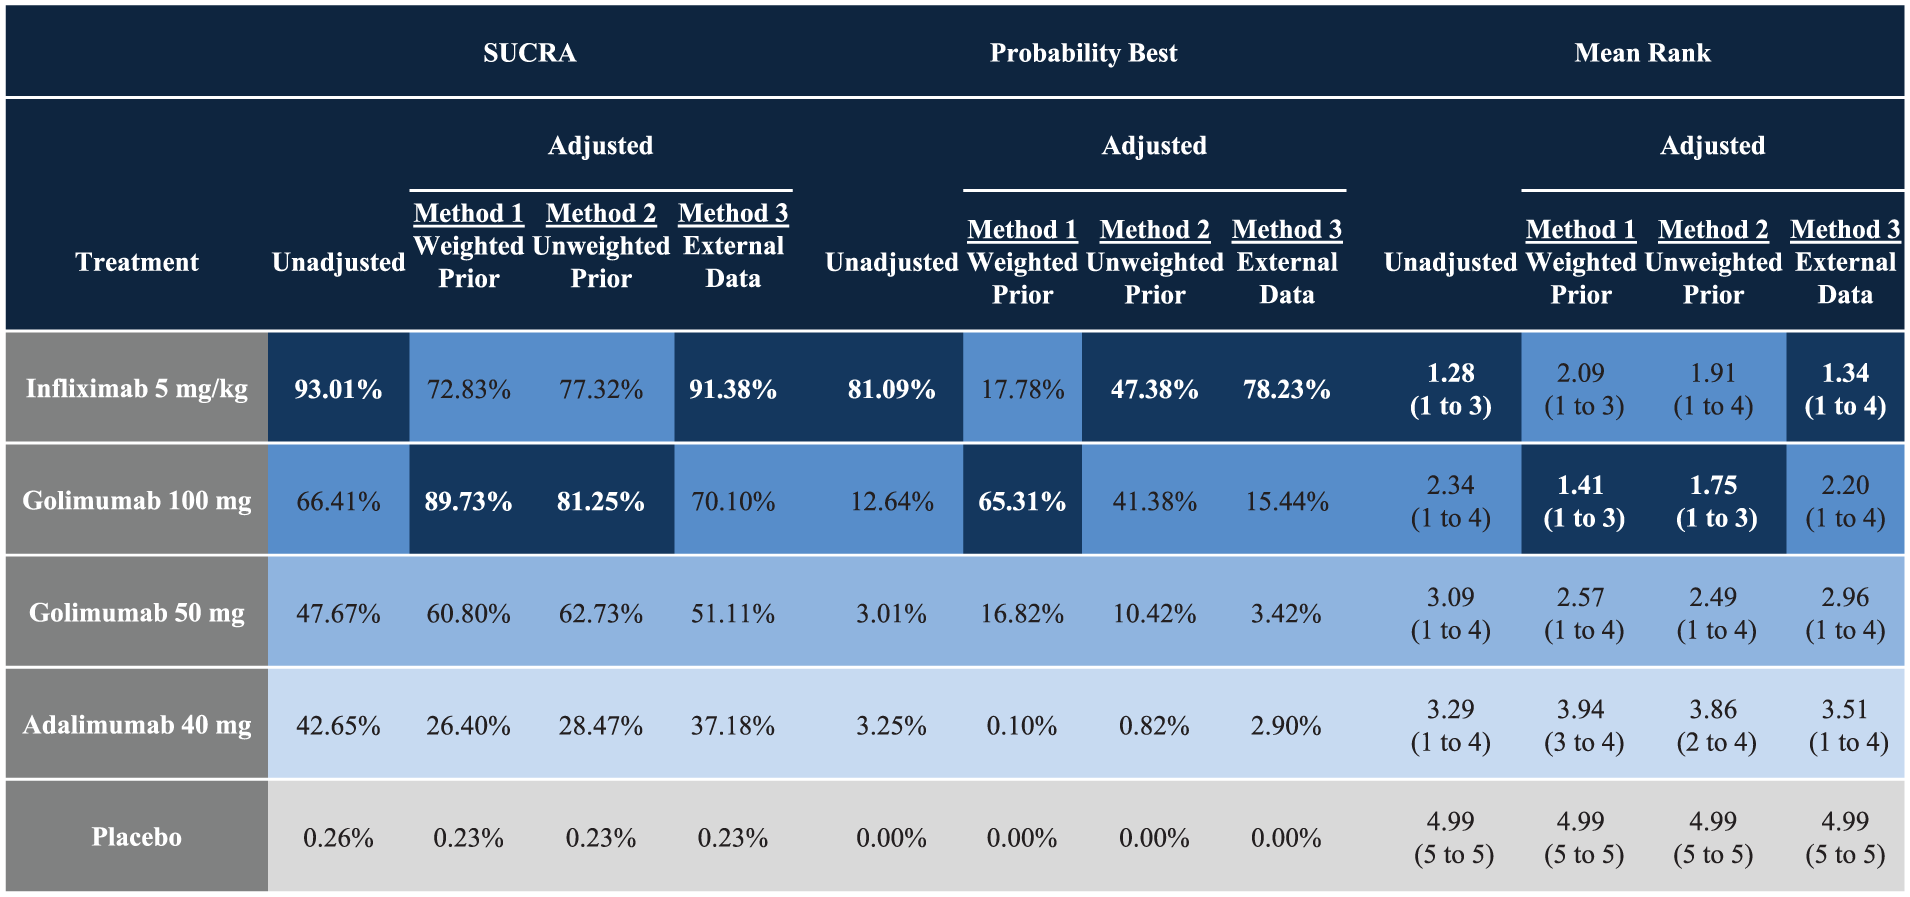
After converting the PURSUIT trial to a conventional parallel groups RCT design (using the aforementioned approaches), NMAs were conducted using WinBUGS software. 12 Only the ACT-1, ULTRA-2, and PURSUIT trials were included in the replicated NMAs, given that these were larger trials and were consistently included in the 3 NMAs of interest (Figure 3).2,4,5 Because outcomes were dichotomous and were captured in multi-arm trials, a binomial likelihood model 13 was used for all analyses. Both fixed- and random-effects NMAs were conducted; although, the fixed-effects model was chosen for the reference case analysis, as the evidence network largely comprised single-study connections. 14 We also generated other measures of effect that are commonly presented for Bayesian NMAs, including mean treatment rankings with 95% CrIs (where values closer to 1 are better), and the probability of each treatment being best, second best, and so forth. 15 In addition, we generated Surface Under the Cumulative RAnking curve (SUCRA) values as an additional measure to reflect ranking and uncertainty. This measure, expressed as a percentage, shows the relative probability of an intervention being among the best options. 15 For interpretation, both p(best) and SUCRA values range between 0% and 100%, with values closest to 100% preferred. 15 To ensure that convergence was reached, trace plots and the Brooks-Gelman-Rubin statistic were assessed. Three chains were fitted in WinBUGS for each analysis, with at least 50,000 sampling iterations, and a burn-in of at least 20,000 iterations.
We performed 4 Bayesian NMAs: 1) An unadjusted analysis not accounting for differences in study design; 2) an analysis adjusting for differences in study design but deflating the impact of the external data on the assumed placebo maintenance response rate (Method 1); 3) an analysis adjusting for differences in study design, which does not deflate the impact of external data on assumed placebo maintenance response rate (Method 2); and 4) an analysis where we assigned the placebo maintenance proportion based entirely on external data from the ACT-1 and ULTRA-2 trials (Method 3). The various approaches for adjusted analyses are presented in Figure 2. In addition to these 4 methods, we compared the placebo maintenance response rates observed in each of the included RCTs. We also ran a sensitivity analysis where we varied the maintenance of the response rate in the placebo arm between 10% and 25%.
Results
The evidence network for the NMA comprised 3 RCTs (ACT-1, ULTRA-2, and PURSUIT) representing 4 treatments (ADA 40 mg, GLM 50 mg, GLM 100 mg, IFX 5 mg/kg) in addition to placebo (N = 1,003) (Figure 3A). Two RCTs (ACT-2 and NCT00853099) were not included in the analysis because of shorter study duration and smaller sample size (i.e., N < 100). ACT-2 and NCT00853099 were also not consistently included in 3 NMAs comparing anti-TNFs of interest.2,4,5 Figure 3B presents a box plot of the placebo response rates from the 3 RCTs used in the analyses, displaying the unadjusted and adjusted differences in the study design. A comparison of the placebo response rates allows for an assessment of the assumption of exchangeability of the sources of evidence within the network. Placebo response rates should be similar if studies are indeed similar in terms of patient and study characteristics. Due to the differences in study design (adaptive v. parallel RCT design), the unadjusted analysis reported much higher placebo response rates in the PURSUIT trial comparing GLM with placebo than was demonstrated in the ACT-1 and ULTRA-2 trials. The placebo response rates in the unadjusted analysis were also much higher than those in the analyses that attempted to adjust for differences in study design. Raw data for the NMAs are reported in Supplemental Table 5.
A summary of the odds ratios from the NMAs comparing anti-TNFs for UC using the 3 alternative approaches to adjusting for differences in study design, as well as unadjusted results, are reported in Table 2. The corresponding SUCRA, probability of being best, and mean treatment ranking with 95% CrIs are reported in Figure 4. For all 4 methods, anti-TNFs are associated with statistically significant improvements in the maintenance of the clinical response as compared with the placebo. In unadjusted analyses, IFX 5 mg/kg was associated with the highest odds of achieving maintenance of a clinical response among all included anti-TNFs. IFX 5 mg/kg was also associated with the highest probability of being best, the highest SUCRA, and the lowest rank nearest to 1. The 3 methods attempting to adjust for differences in study design resulted in varying findings. In Method 1, GLM 100 mg was associated with the highest odds of achieving maintenance of a clinical response, as well as the highest SUCRA and lowest rank nearest to 1. In Method 2, GLM 100 mg and IFX 5 mg/kg were associated with similar odds of achieving maintenance of a clinical response among TNFs. GLM 100 mg was associated with the highest SUCRA and lowest rank nearest to 1, whereas IFX 5 mg/kg was associated with the highest probability of being best. Finally, in Method 3, IFX 5 mg/kg was associated with the highest odds of achieving maintenance of a clinical response among all anti-TNFs, and was associated with the highest probability of being best, the highest SUCRA, and the lowest rank nearest to 1. GLM 50 mg, ADA, and placebo consistently ranked third, fourth, and fifth (respectively) using probability of being best, SUCRA, and mean ranks.
Summary of Findings from Network Meta-Analysis Comparing Anti-Tumor Necrosis Factor Drugs for Ulcerative Colitis using Three Methods to Adjust for Differences in Study Design, as well as Unadjusted Results Not Accounting for Differences in Study Design
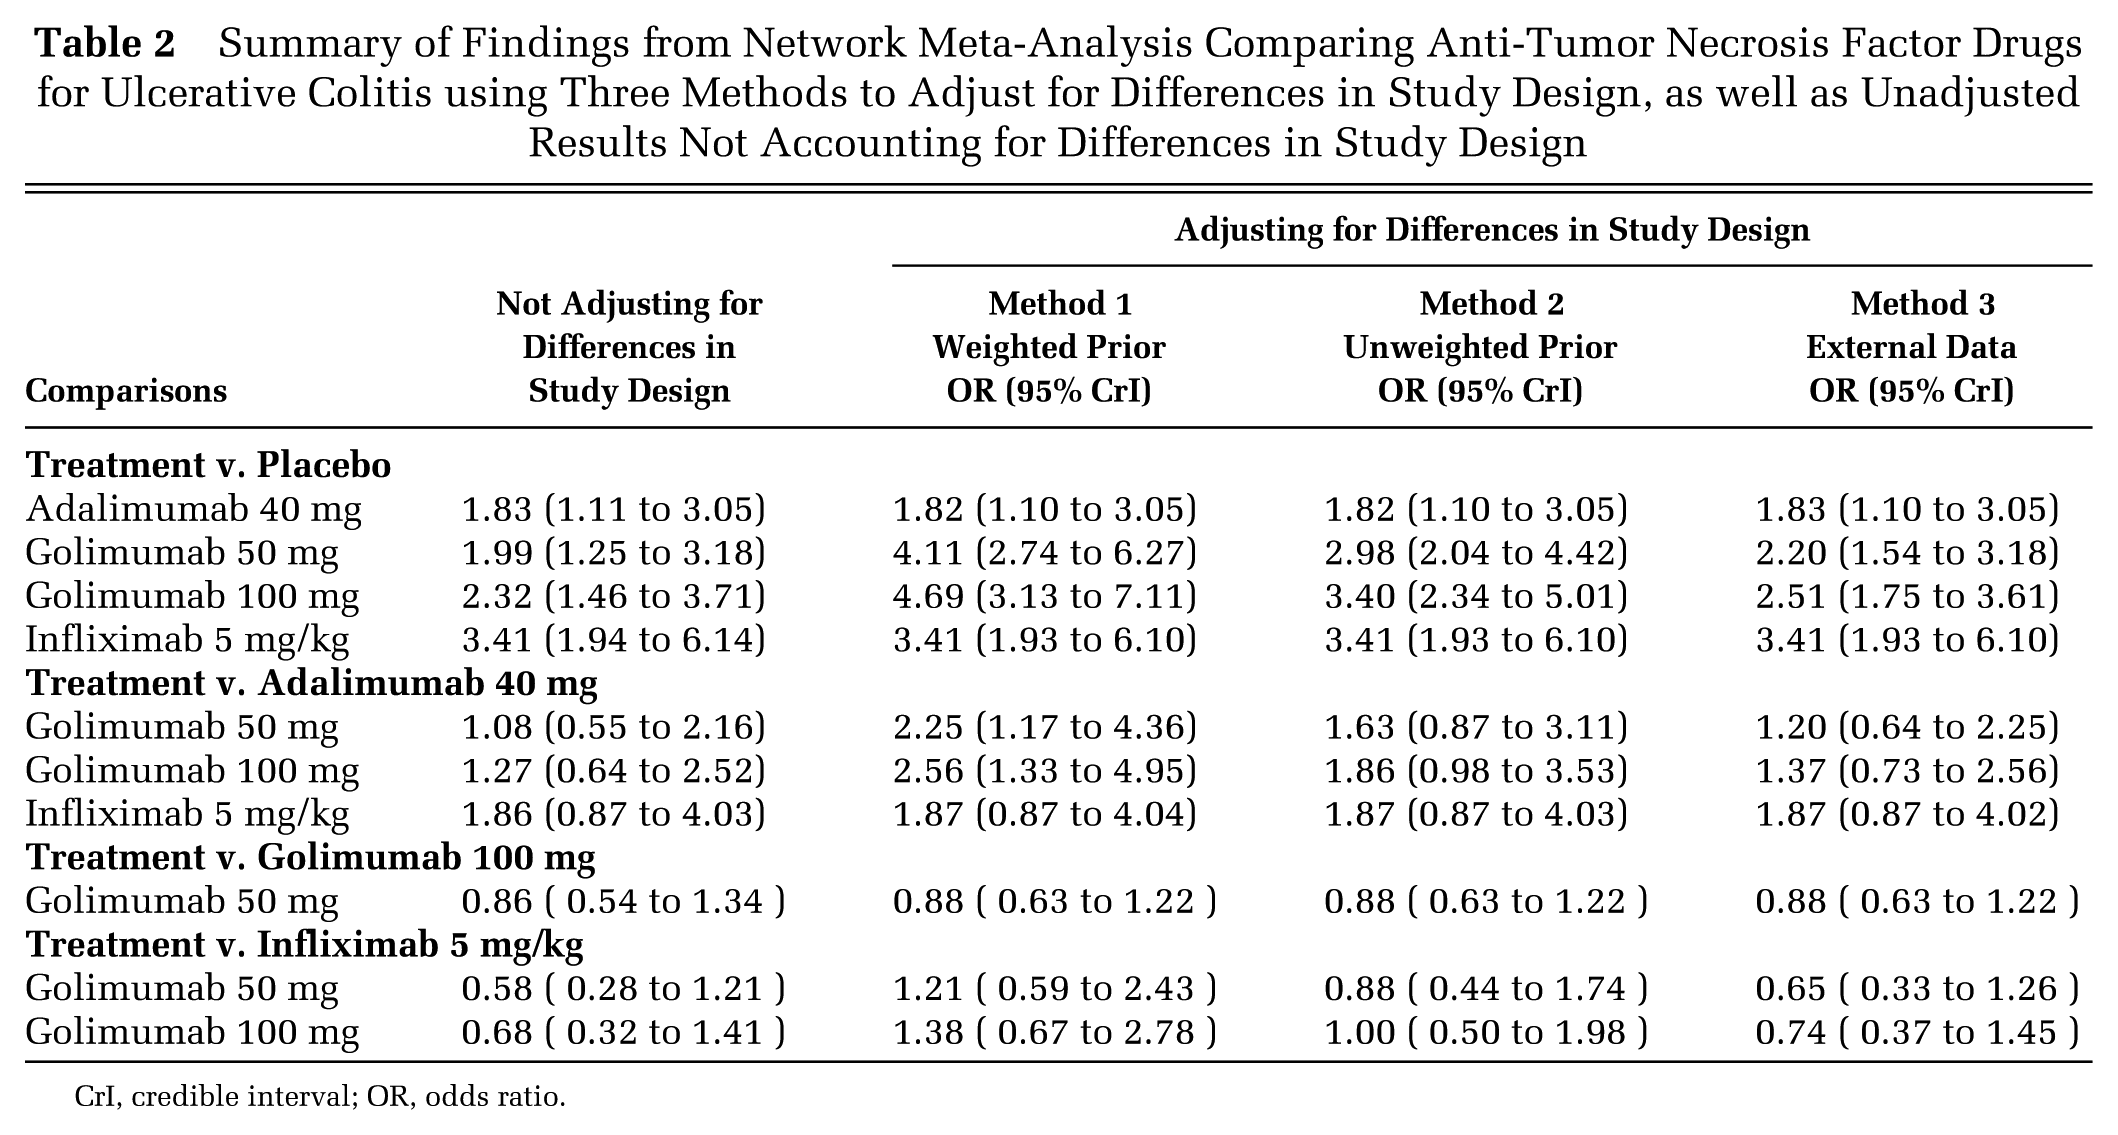
CrI, credible interval; OR, odds ratio.
Findings from the network meta-analyses reported using other measures of effect that are commonly presented for Bayesian network meta-analyses, including Surface Under the Cumulative RAnking curve (SUCRA), probability of being best, and mean rank with 95% credible intervals (CrIs). Both the probability of being best and SUCRA values range between 0% and 100%; values nearer 100% are preferred, whereas values closer to 1 are preferred for ranks. The results are sorted by colors according to the favorability of the comparison, where a darker shade implies a more favorable treatment.
In addition to these 4 methods, we also ran sensitivity analyses where we varied the maintenance of the response rate in the placebo arm between 10% and 25%. The results from these analyses largely aligned with those reported using the 4 methods, and are reported in Supplemental Table 6.
Discussion
An adaptive clinical trial design is a clinical trial that evaluates a medical device or treatment by observing participant outcomes on a pre-specified schedule, and modifying parameters of the trial protocol in response to these observations. 16 The use of an adaptive trial design has increased dramatically over time, and it is expected that their use will continue to increase further moving forward. 17 As adaptive trial designs become more common, it will become increasingly important to compare and contrast findings from such study designs with other treatments that may have been developed using traditional parallel RCT designs in the context of systematic reviews and meta-analyses. We have illustrated methods for converting results from one form of adaptive trial design to results corresponding to a parallel RCT design using an illustrative example comparing anti-TNFs for UC. Although the method applied to the PURSUIT data 9 in our illustrative example is by no means generalizable to all adaptive designs, our findings should stimulate awareness around the issues of combining and comparing studies using alternative study designs.
Our re-analyses of the NMAs have shown that combined results from various study designs and not accounting for differences in study design, as was done by Stidham and others, 2 may bias estimates of effect in NMAs. In our illustrative example, combining the results without adjusting for differences in study design resulted in estimates of effect that were biased against GLM. We have also shown that reporting direct results from RCTs and opting to not report indirect estimates due to differences in study design, as was done by Danese and others, 4 is just as problematic: clinicians and decision makers may still compare direct estimates of effect between studies which, in our case study, aligned with the NMA that combined the results and did not account for study design. Decisions based on such a crude approach would be biased given that they do not account for important differences in study design. By contrast, attempting to adjust for differences in study design, as was done by Thorlund and others, 5 addresses the issue in a transparent manner, provides a more holistic view of the evidence, and is likely to yield more appropriate estimates of comparative efficacy.
We have also shown that the Bayesian approach 18 offers a flexible framework to account for uncertainty when adjusting for differences in study design. In the Bayesian framework, it is possible to incorporate external data in the form of prior distributions. 18 In our illustrative example, we were able to incorporate data on the mean proportion of placebo responders from ACT-1 and ULTRA-2, as well as the uncertainty around this estimate, as a “prior” distribution of the placebo response in PURSUIT. We mixed the mean proportion of placebo responders from ACT-1 and ULTRA-2 with our “ITT-like” proportion to obtain an estimate of the placebo response rate in a conventional parallel design, and also varied this “mix” in a multitude of scenario analyses to account for uncertainty. In Method 1, we down-weighted the impact of external data on assumed placebo maintenance response rate, whereas, in Methods 2 and 3, we did not down-weight the impact of external data. In our case, if you have more confidence in the estimate of the “ITT-like” placebo response rate, then Method 1 may be the most appropriate, resulting in more favorable estimates for GLM. If one cannot determine whether they can rely on the “ITT-like” placebo response rate, then Method 2 may be viewed as most appropriate, yielding more favorable estimates for IFX. The flexibility to vary the “mix” of trial level data with external data within the Bayesian framework allowed us to be more transparent and investigate the impact of various assumptions underpinning our conversion calculations. It also allowed us to determine ranges of reasonable effect estimates after accounting for differences in study design. Interestingly, in all scenarios, ADA was associated with less favorable estimates than GLM and IFX. This flexibility will undoubtedly be useful for future studies investigating the various methods to convert other types of adaptive study designs into NMA.
Consideration of differences in study design is particularly important for health economic evaluations and decision making. Cost-effectiveness estimates are largely driven by mean estimates of effect. 19 Including findings from NMAs for which differences in study design have not been accounted for could lead to inappropriate conclusions in health economic evaluations. For example, including estimates of effect from an NMA that has not accounted for differences in study design (such as in the study by Stidham and others 2 ) in a health economic evaluation, could result in the authors concluding that GLM is more expensive and less effective than competing anti-TNFs for moderately to severely active UC. Similar conclusions would be drawn if direct estimates (such as those from Danese and others 4 ) were used in a health economic evaluation. Future studies are needed to investigate the implications of incorporating efficacy estimates from NMAs that have not accounted for study design on health economic evaluations, as well as decision making. For example, have published health economic evaluations inappropriately included NMAs which have not adjusted for differences in study design? Similarly, have health technology assessment agencies or clinical practice guidelines groups incorporated such analyses to inform their guidance or recommendations? We conducted a literature search to investigate this issue using our case study but because Stidham and others 2 and Danese and others 4 were both recently published, there has not been sufficient time for their findings to be incorporated into other published health economic evaluations, clinical practice guidelines, or health technology assessments. Future research is needed in this area after sufficient time has passed to allow for their uptake in the medical literature.
In conclusion, studies based on adaptive study designs should not be combined with traditional parallel RCT designs in NMAs. We have investigated the advantages and pitfalls of methods to adjust for differences in study design when re-analyzing NMAs comparing anti-TNFs for moderately to severely active UC. We have demonstrated methods for converting results from one form of adaptive design to the more conventional parallel RCT. Incorporating such conversions into NMAs provides a more holistic view of the evidence and is likely to yield less-biased estimates of comparative efficacy than naïve comparisons between studies for which adjustments have not been made for differences in study design.
Footnotes
Financial support for this study was provided entirely by a contract with Janssen Scientific Affairs LLC and Janssen Canada. The funding agreement ensured the authors’ independence in designing the study, interpreting the data, writing, and publishing the report. EE and PD are employees of Janssen Canada; MI is an employee of Janssen Scientific Affairs and a shareholder at Johnson and Johnson. CC, FW, AV are employees of Cornerstone Research Group Inc. which received financial support from Janssen Canada and Janssen Scientific Affairs. BH provides methodological advice for Cornerstone Research Group Inc. Cornerstone Research Group Inc. consults for various pharmaceutical, medical device, and biotech companies.