
Abstract
The Cox model is one of the most used statistical models in medical research. It models the hazard rate of an event and its association with covariates through hazard ratios. In the simple setting without competing risks nor time-dependent covariates, there exists a one-to-one mathematical connection between the hazard rate and the risk of experiencing the event within any given time period (e.g., 5 years). This makes it possible to conclude that a covariate associated with a hazard ratio above one is associated with a higher risk of event. Although it is becoming widely known that this connection is lost in the presence of competing risks, it seems that fewer users of the Cox model are aware that this connection is also lost when using time-dependent covariates. In other words, it seems still widely unknown that, when using a time-dependent Cox model, a hazard ratio estimated above one does not necessarily mean that there is a higher risk. Hence, this note aims to clarify why this is not the case with a detailed pedagogical example.
Introduction
The Cox model 1 is one of the most well established and commonly used statistical models. The model has been studied in details, including in case of time dependent-covariates and competing risks. 2 Unfortunately, as with any other popular statistical model, the model is sometimes misunderstood and misused. This lead authors of medical research papers to sometimes draw conclusions which are not as well supported by results of the data analysis as they claim.
In this manuscript, we aim to clarify one specific limitation of the Cox model which can result into such inappropriate conclusions. Our experience is that this limitation seems surprisingly widely unknown and is the source of much misunderstanding and confusion. Our point is about the use of time-dependent covariates into the Cox model and its consequence for interpreting the corresponding results. In short, our point is: a hazard ratio above one does not necessarily mean higher risk, when using a time-dependent Cox model. The same also applies to Poisson regression with time-dependent covariates, which is closely related to Cox regression, see for example, Andersen and Skovgaard. 3 As further discussed below, this remark is very similar to a remark already made many times about the competing risks setting, see for example, Andersen et al. 4
This remark is not new, see for example,. Fisher and Lin 5 or Chapter six of Kalbfleisch and Prentice. 6 However, it seems that this remark has not been made many times in the literature and has not reached many practitioners yet. Besides, this remark has been made using different and often less detailed examples, which might have been difficult to grasp by some practitioners. For example, we recently experienced statistical reviewers from “high impact” medical journals who recommended us to use a time-dependent Cox model to inappropriately compare several risks. They had difficulties to accept our argumentation and we understood that they would have liked to see our explanations published in a peer reviewed article.
Therefore, with this note we aim to share and detail a novel pedagogical example. It has helped several of our collaborators to understand why the remark is true, although they initially thought it was not. The example provides new insights via i) graphical representations to facilitate the understanding and memorization of the key ideas and ii) the corresponding mathematical explanations built upon the theory of multi-state models. 7 Overall, this note has been written with the intention to make it mostly accessible to a large audience of biostatisticians, epidemiologists, and medical researchers, but also complete and rigorous enough to satisfy the readers with a technical background.
The rest of the manuscript is organized as follows. We first present the notations and the Cox model, first without and then with time-dependent covariates. We then summarize the background for the widespread belief that a hazard ratio above one always means a risk ratio above one. We first recall why this is true without time-dependent covariates and then show that this is not necessarily the case with time-dependent covariates. The main ideas are emphasized by graphical representations and further mathematical details are provided in the Supplementary material. We close with a discussion which contains further remarks and references. The Supplementary material also contains R code which makes all results straightforward to reproduce and check.
Notations and models
The Cox model without time-dependent covariates
Let T denote a time from the inclusion into a study to death and

The quantity λ0 is called the baseline hazard function and is left unspecified, that is, no restrictive assumptions are made about it. The vector of coefficients
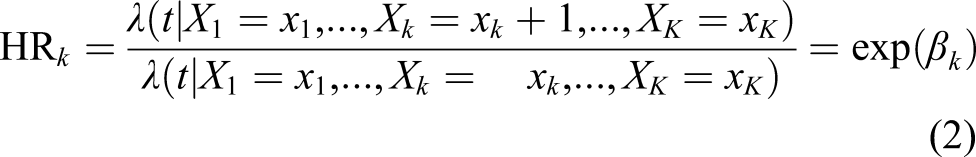
Let us recall that the hazard function, sometimes also called the rate function, which is modeled by the Cox model at any time t ≥ 0, is mathematically defined by
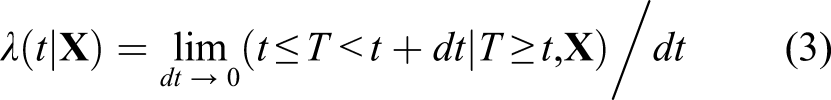
Informally, the hazard has the following interpretation. For any (very) small interval from time t to time t + dt, the hazard λ(t|
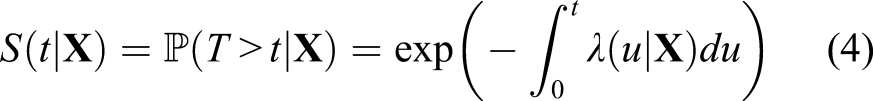
Using the Cox model therefore implies that the survival probability at time t is modeled as


Here the terms “
Let us emphasize that this equivalence (6) between increase/decrease in hazard and in risk remains true at any time during the follow-up. This remark is important for what follows in the next sections. More precisely, it remains true in the following sense:
The Cox model with time-dependent covariates
We now assume that we observe variables whose values can change over time. Examples include biomarker values measured from multiple blood sample during follow-up, treatment dose received each day/week during the follow-up, the level of air pollution to which the population is exposed, etc. Any summary of the history of a variable can also be used. For example, the accumulated dose of treatment received can be computed at any time during the follow-up and used as a time-dependent covariate in the model.
Formally, assume that during the τ years of follow-up we observe

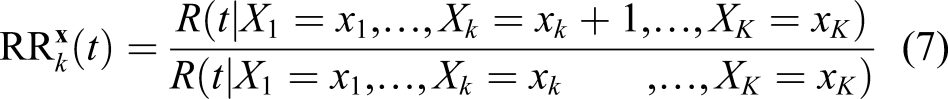
An important remark is the following: unless further assumptions are made, this model does model the hazard only and does not model the association between the time-dependent covariate observed up to any time point and the time to a subsequent death. In other words, this model does not model the association between the time-dependent covariates and the risk of death within the next t years. In general, no strong statement can be made about the (conditional) risk ratio
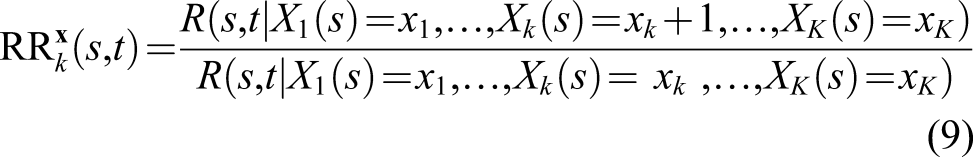
In short, the possibility of “inconsistency” between the hazard ratio and the risk ratio exists because the t-year risk R (s, t|
What can go “wrong” with time-dependent covariates: a simple example
The example
We now consider the simple example where we observe two binary time-dependent covariates, which can only increase during the follow-up. For each of them the value is 0 at baseline (i.e., at time 0) and jumps to one when the diagnosis of a comorbidity is made (if any), during the follow-up (e.g., a diagnosis of diabetes).
Let us assume that our data have been generated from a time-dependent Cox model. That is, we assume that the following model perfectly fits the data

In Figure 1, we exhibit an example of what can happen when looking at both hazard ratios and risk ratios. Although the hazard ratios HR2 = exp (β2) = 2 is above one, the risk ratio Hazard ratios HR
k
and risk ratios 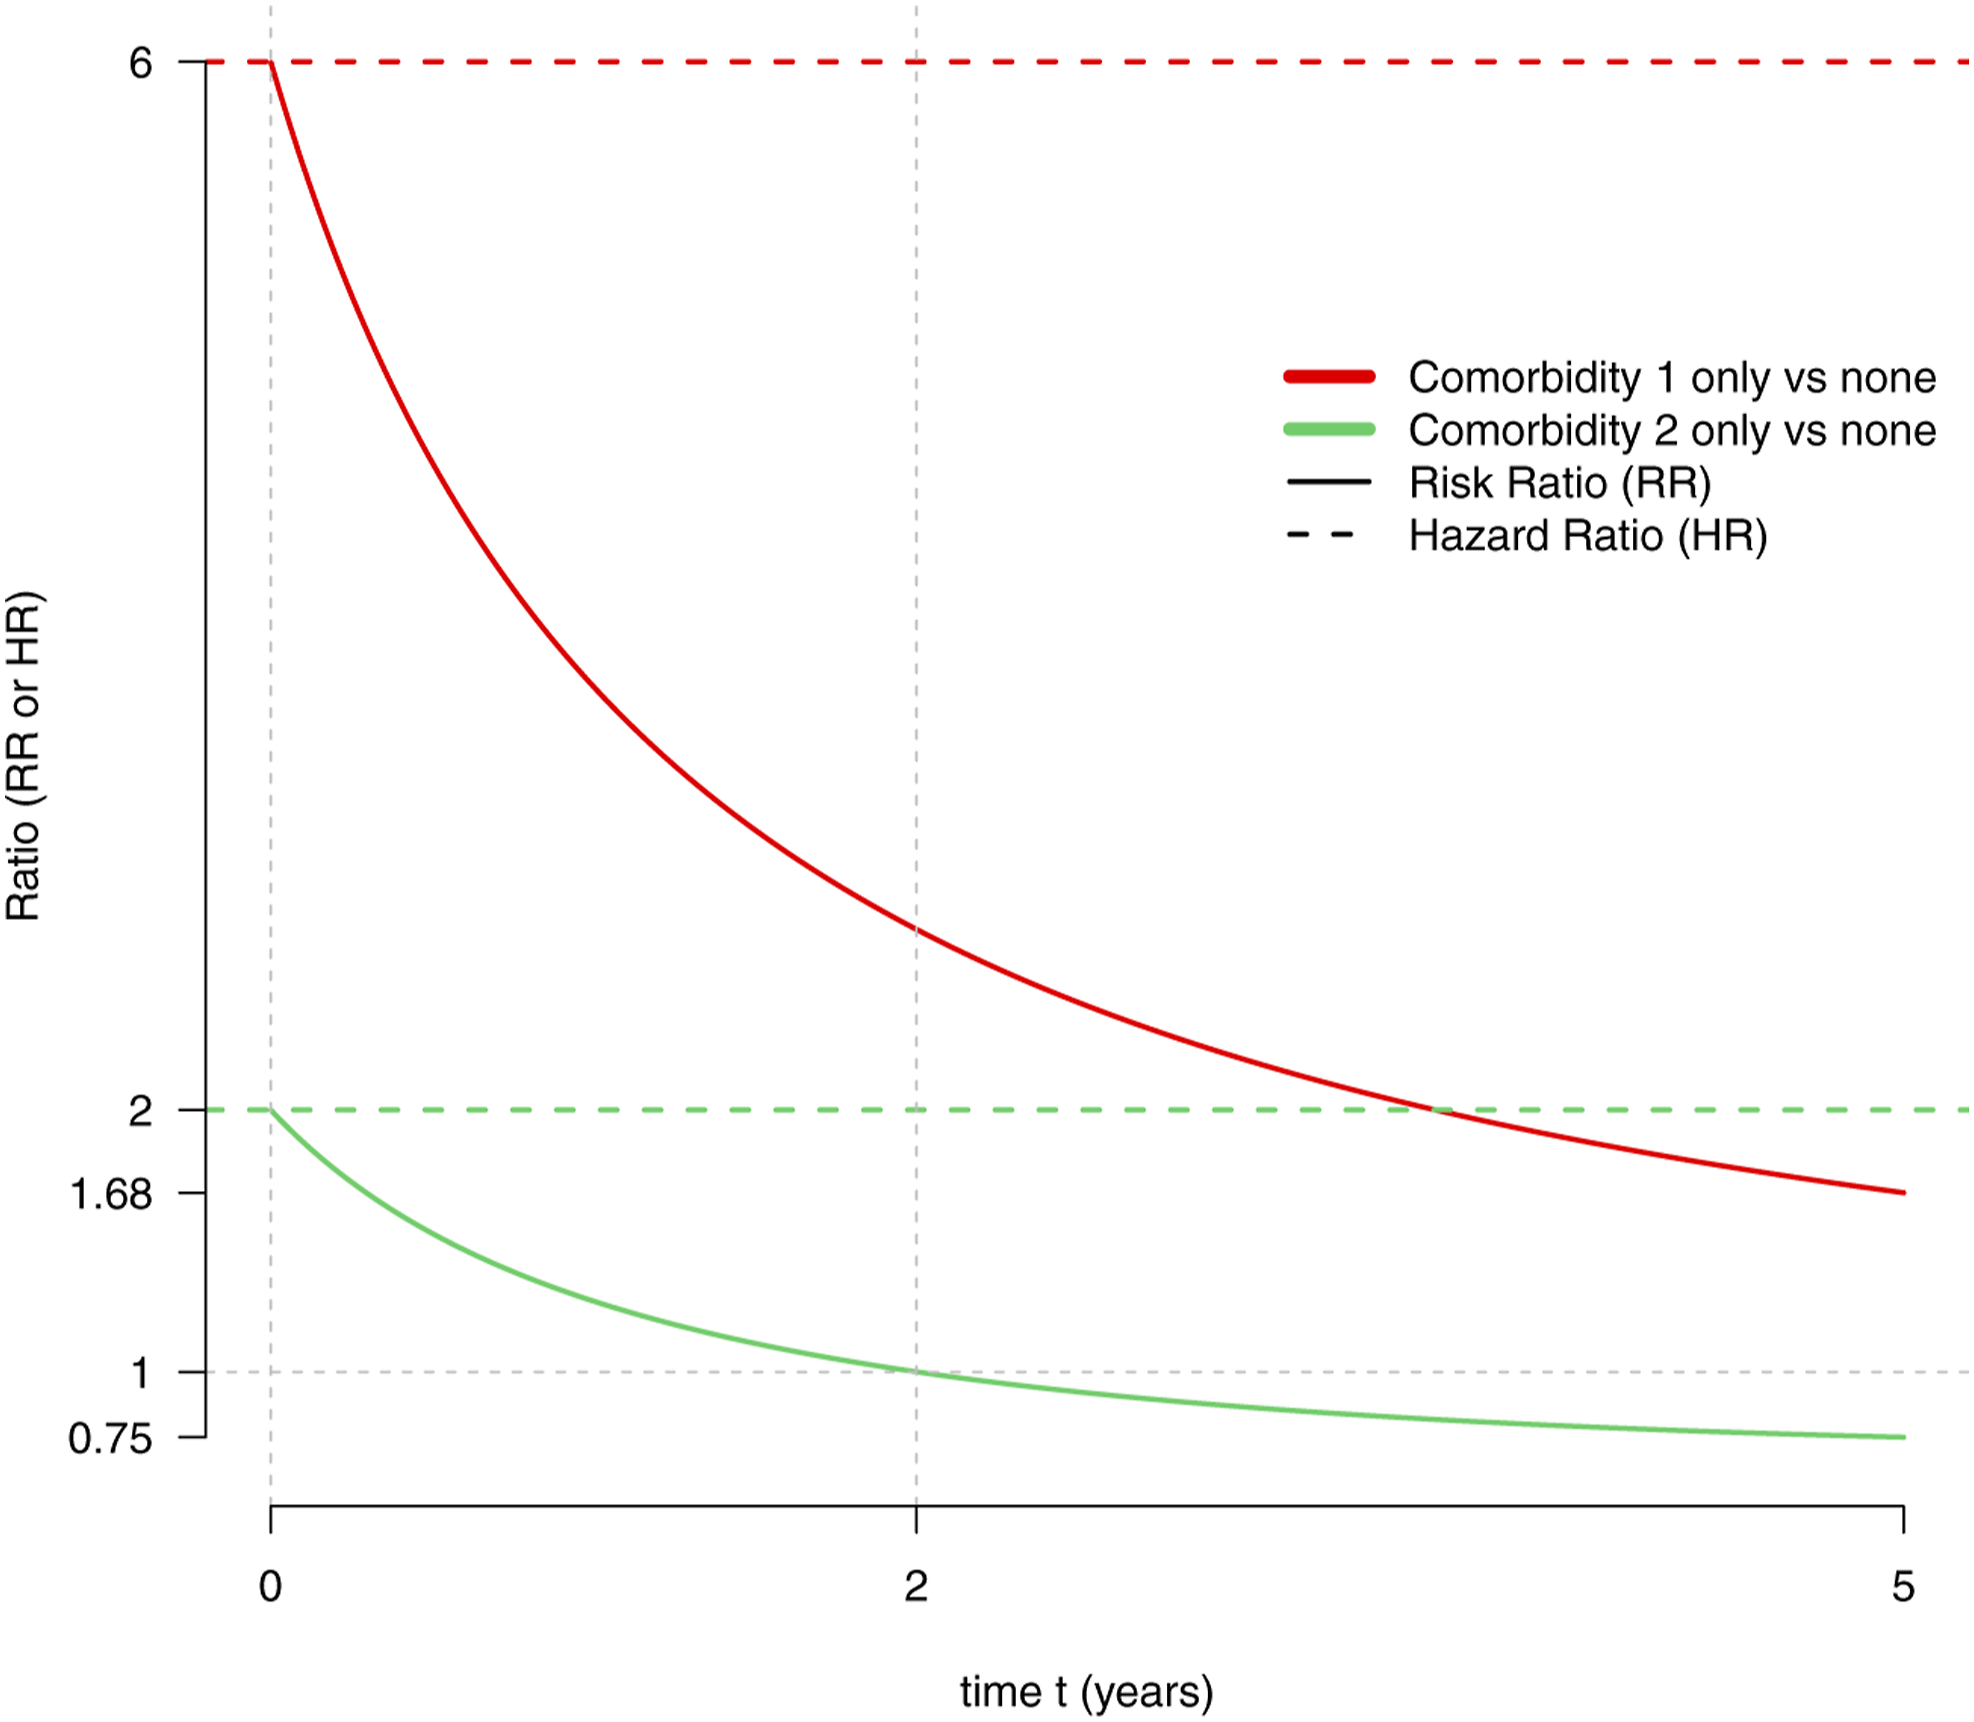
A hypothetical medical context
To make the example more concrete and facilitate the understanding of what follows, it can be useful to think of a study population of European citizens in their 60s, of X1(t) as a variable indicating that a diagnosis of coronavirus disease (covid-19) has been made prior to time t, and of X2(t) as indicating that a diagnosis of diabetes has been made prior to time t. Hence, the explanations that follow in the rest of the manuscript are presented in that context.
With this medical context in mind, the interpretation becomes that i) both diabetes and history of covid-19 increase the rate of death—covid-19 doing it more than diabetes, ii) but, although the 5-years risk of death is increased for patients with history of covid-19, this is not the case for patients with diabetes only. For those, the risk is lower than that of patients without diabetes nor history of covid-19.
We believe that the directions of these associations are plausible, as the consequences of plausible mechanisms detailed below. However, we can only speculate and this example have been constructed for pedagogical purpose, without the aim to closely resemble what could be observed in real life in all aspects. For instance, the magnitudes of the associations and all the numerical values have been chosen to facilitate the presentation, not necessarily to closely resemble real life data.
The essential components for a thorough understanding
To understand why the discrepancy between hazard ratio and risk ratio happens, Figure 1 should be examined in conjunction with Figures 2 and 3. Figure 2 presents the multi-state model from which the data have been generated. Each box corresponds to a state in which a subject can be at any time t. Each state describes whether the subject is still alive or not at a specific time and, if alive, which comorbidities he or she has been diagnosed so far. A subject will be in the state “healthy” at time t if still alive with no history of any of the two comorbidities at that time (no history of covid-19, no diabetes). He will be in the state “Death” at time t if he has passed away by that time and either in the state “Comorbidity 1 (hist. of covid-19),” “Comorbidity 2 (diabetes),” or “Comorbidities 1 and 2 (hist. of covid-19 and diabetes)” at time t, if alive with history of covid-19 only, diabetes only or both history of covid-19 and diabetes at that time, respectively. The arrows represent the hazards corresponding to the transition from one state to another, also called intensity transitions. Informally, they can be interpreted as follows. For any (very) small interval from time t to time t + dt, the intensity for the transition from state A to state B multiplied by the time duration dt is approximately the conditional probability of reaching the state B before time t + dt, given that a subject is in state A at time t. Mathematically, αA,B(t) = lim
dt
→ 0 (t ≤ U < t + dt | U ≥ t)/dt, where U denotes the time of reaching state B from state A. In our example, all intensities have a constant value over time, which corresponds to a time-homogeneous Markov multi-state model.
7
Hence, here we can simplify the notation λ0(t) as λ0. The time-homogeneous Markov multi-state model from which the data have been generated. The time-dependent Cox model models the hazard rates (intensity transitions) depicted in red. The width of each arrow is proportional to the value of the corresponding hazard rate. The t-year risks given the diagnosed comorbidities. More formally, shown are R (s, t|X1(s) = x1, X2(s) = x2), for any s > 0, all 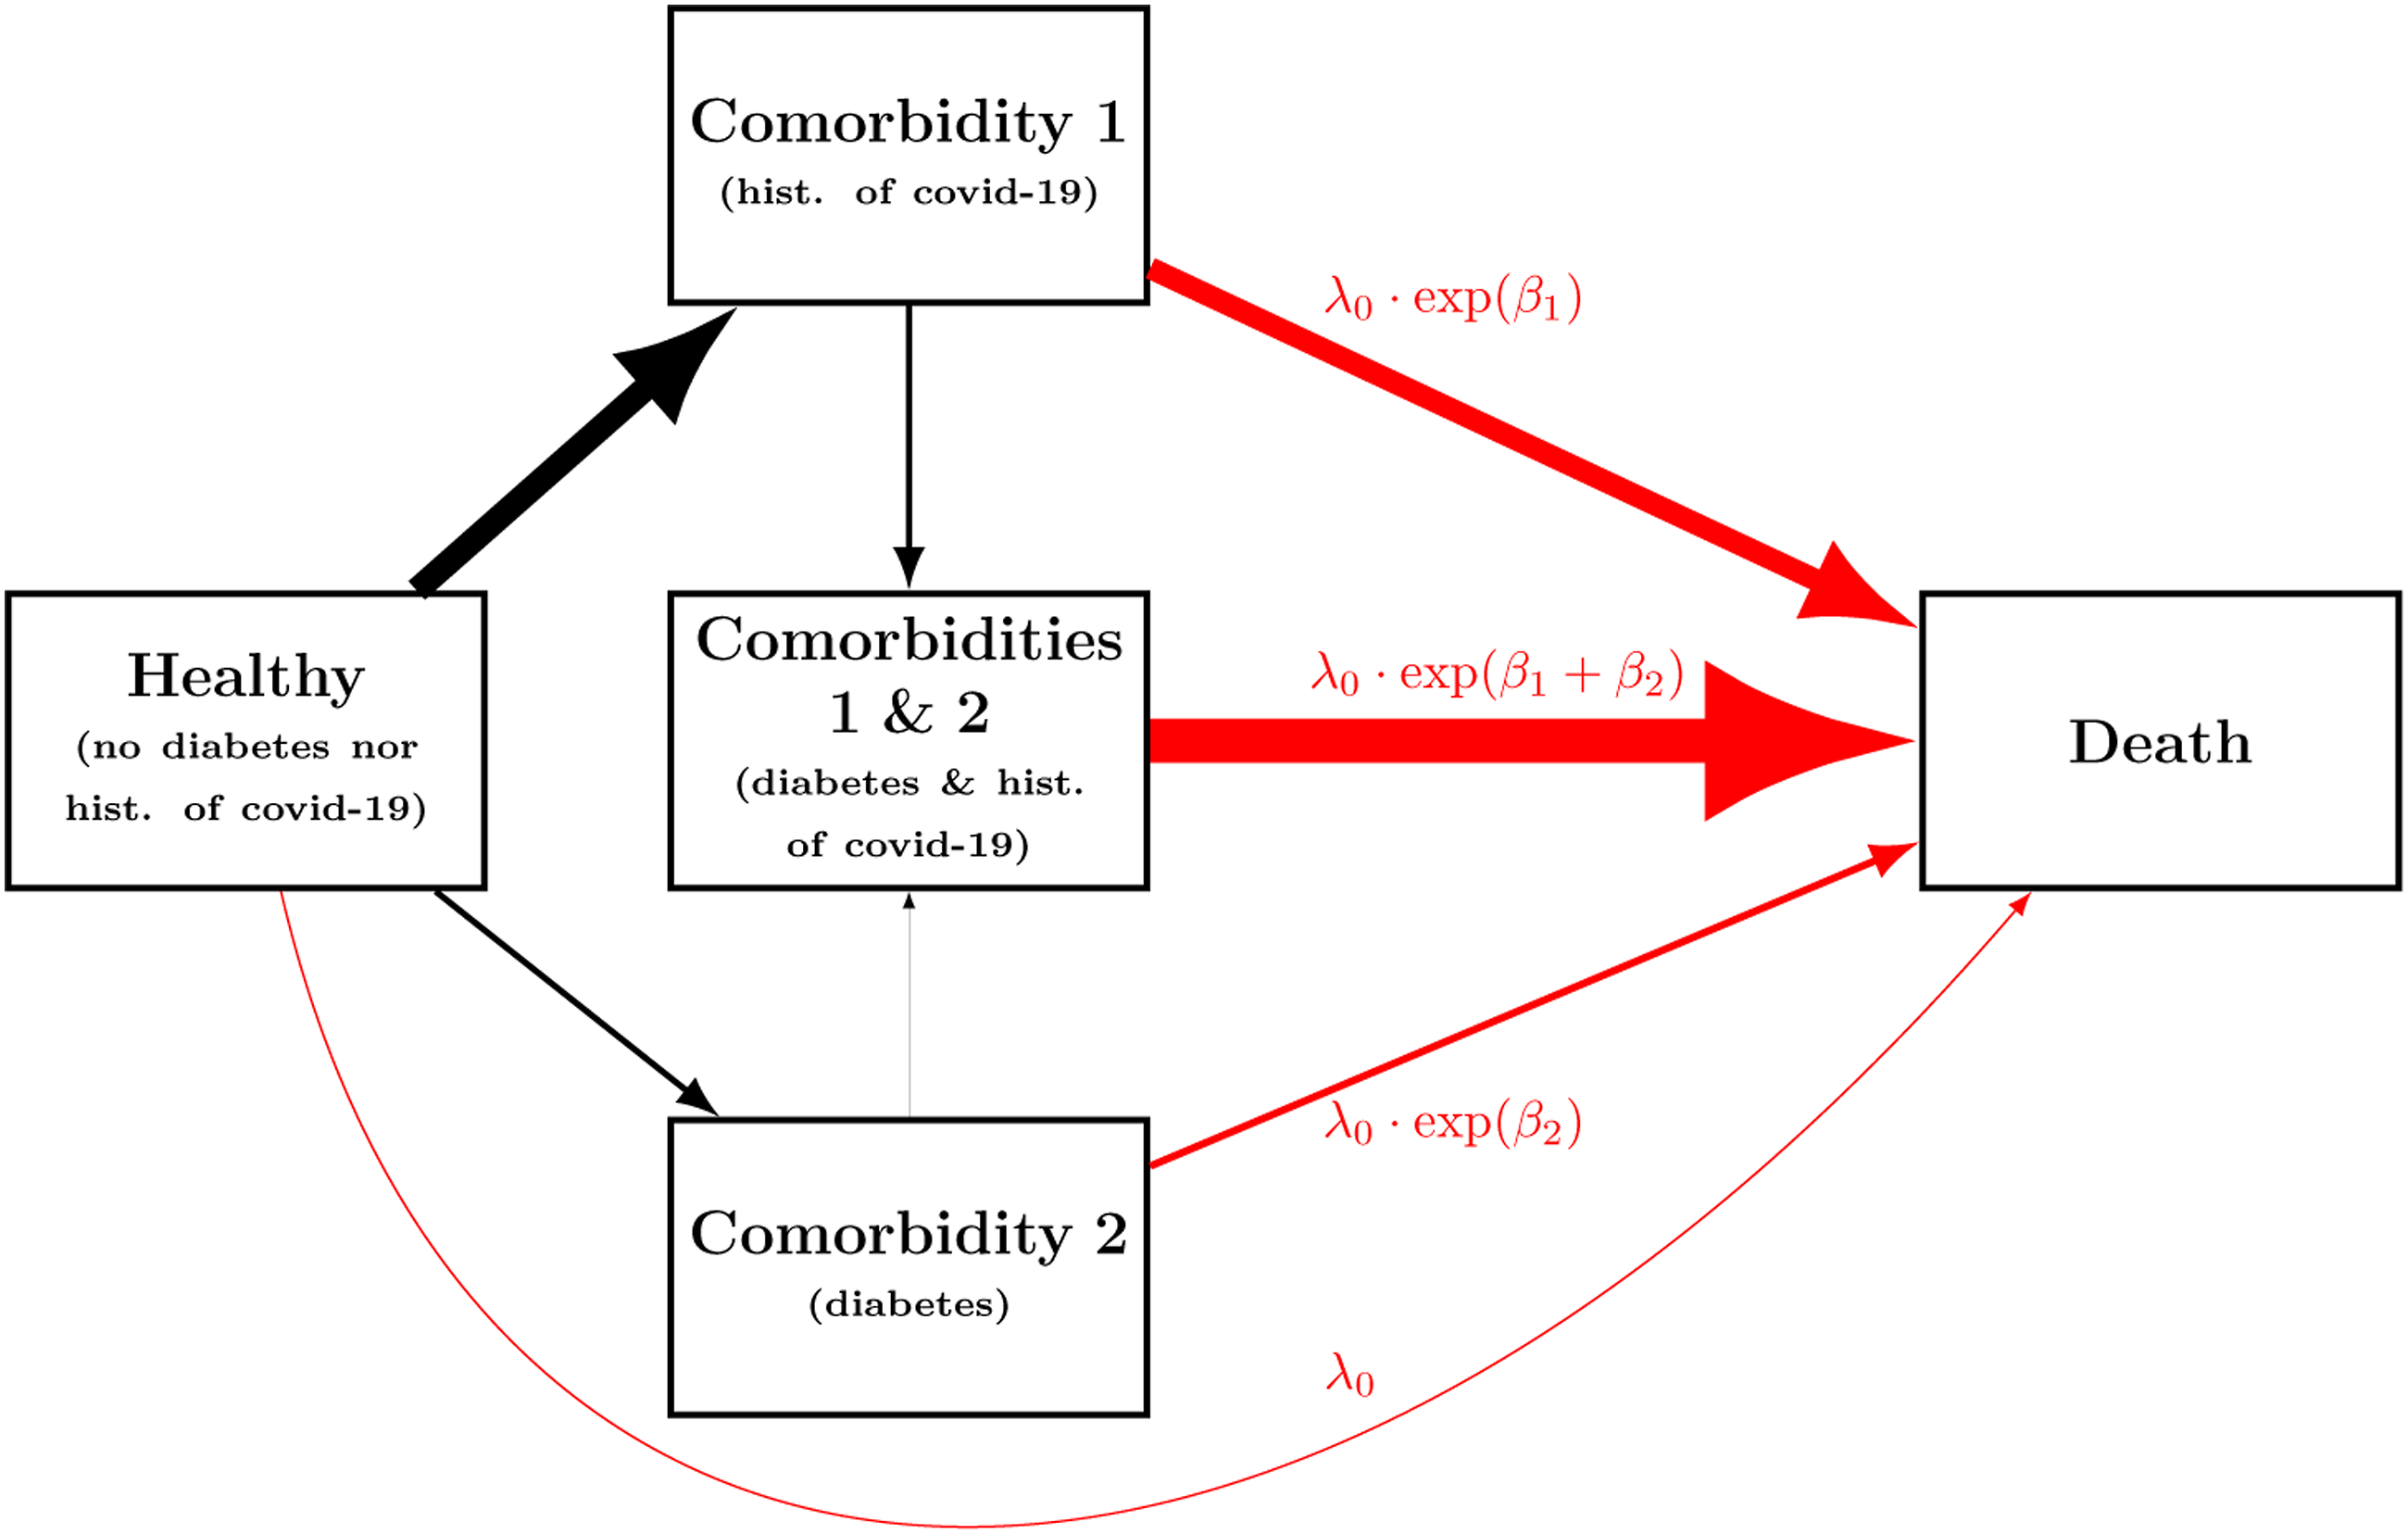
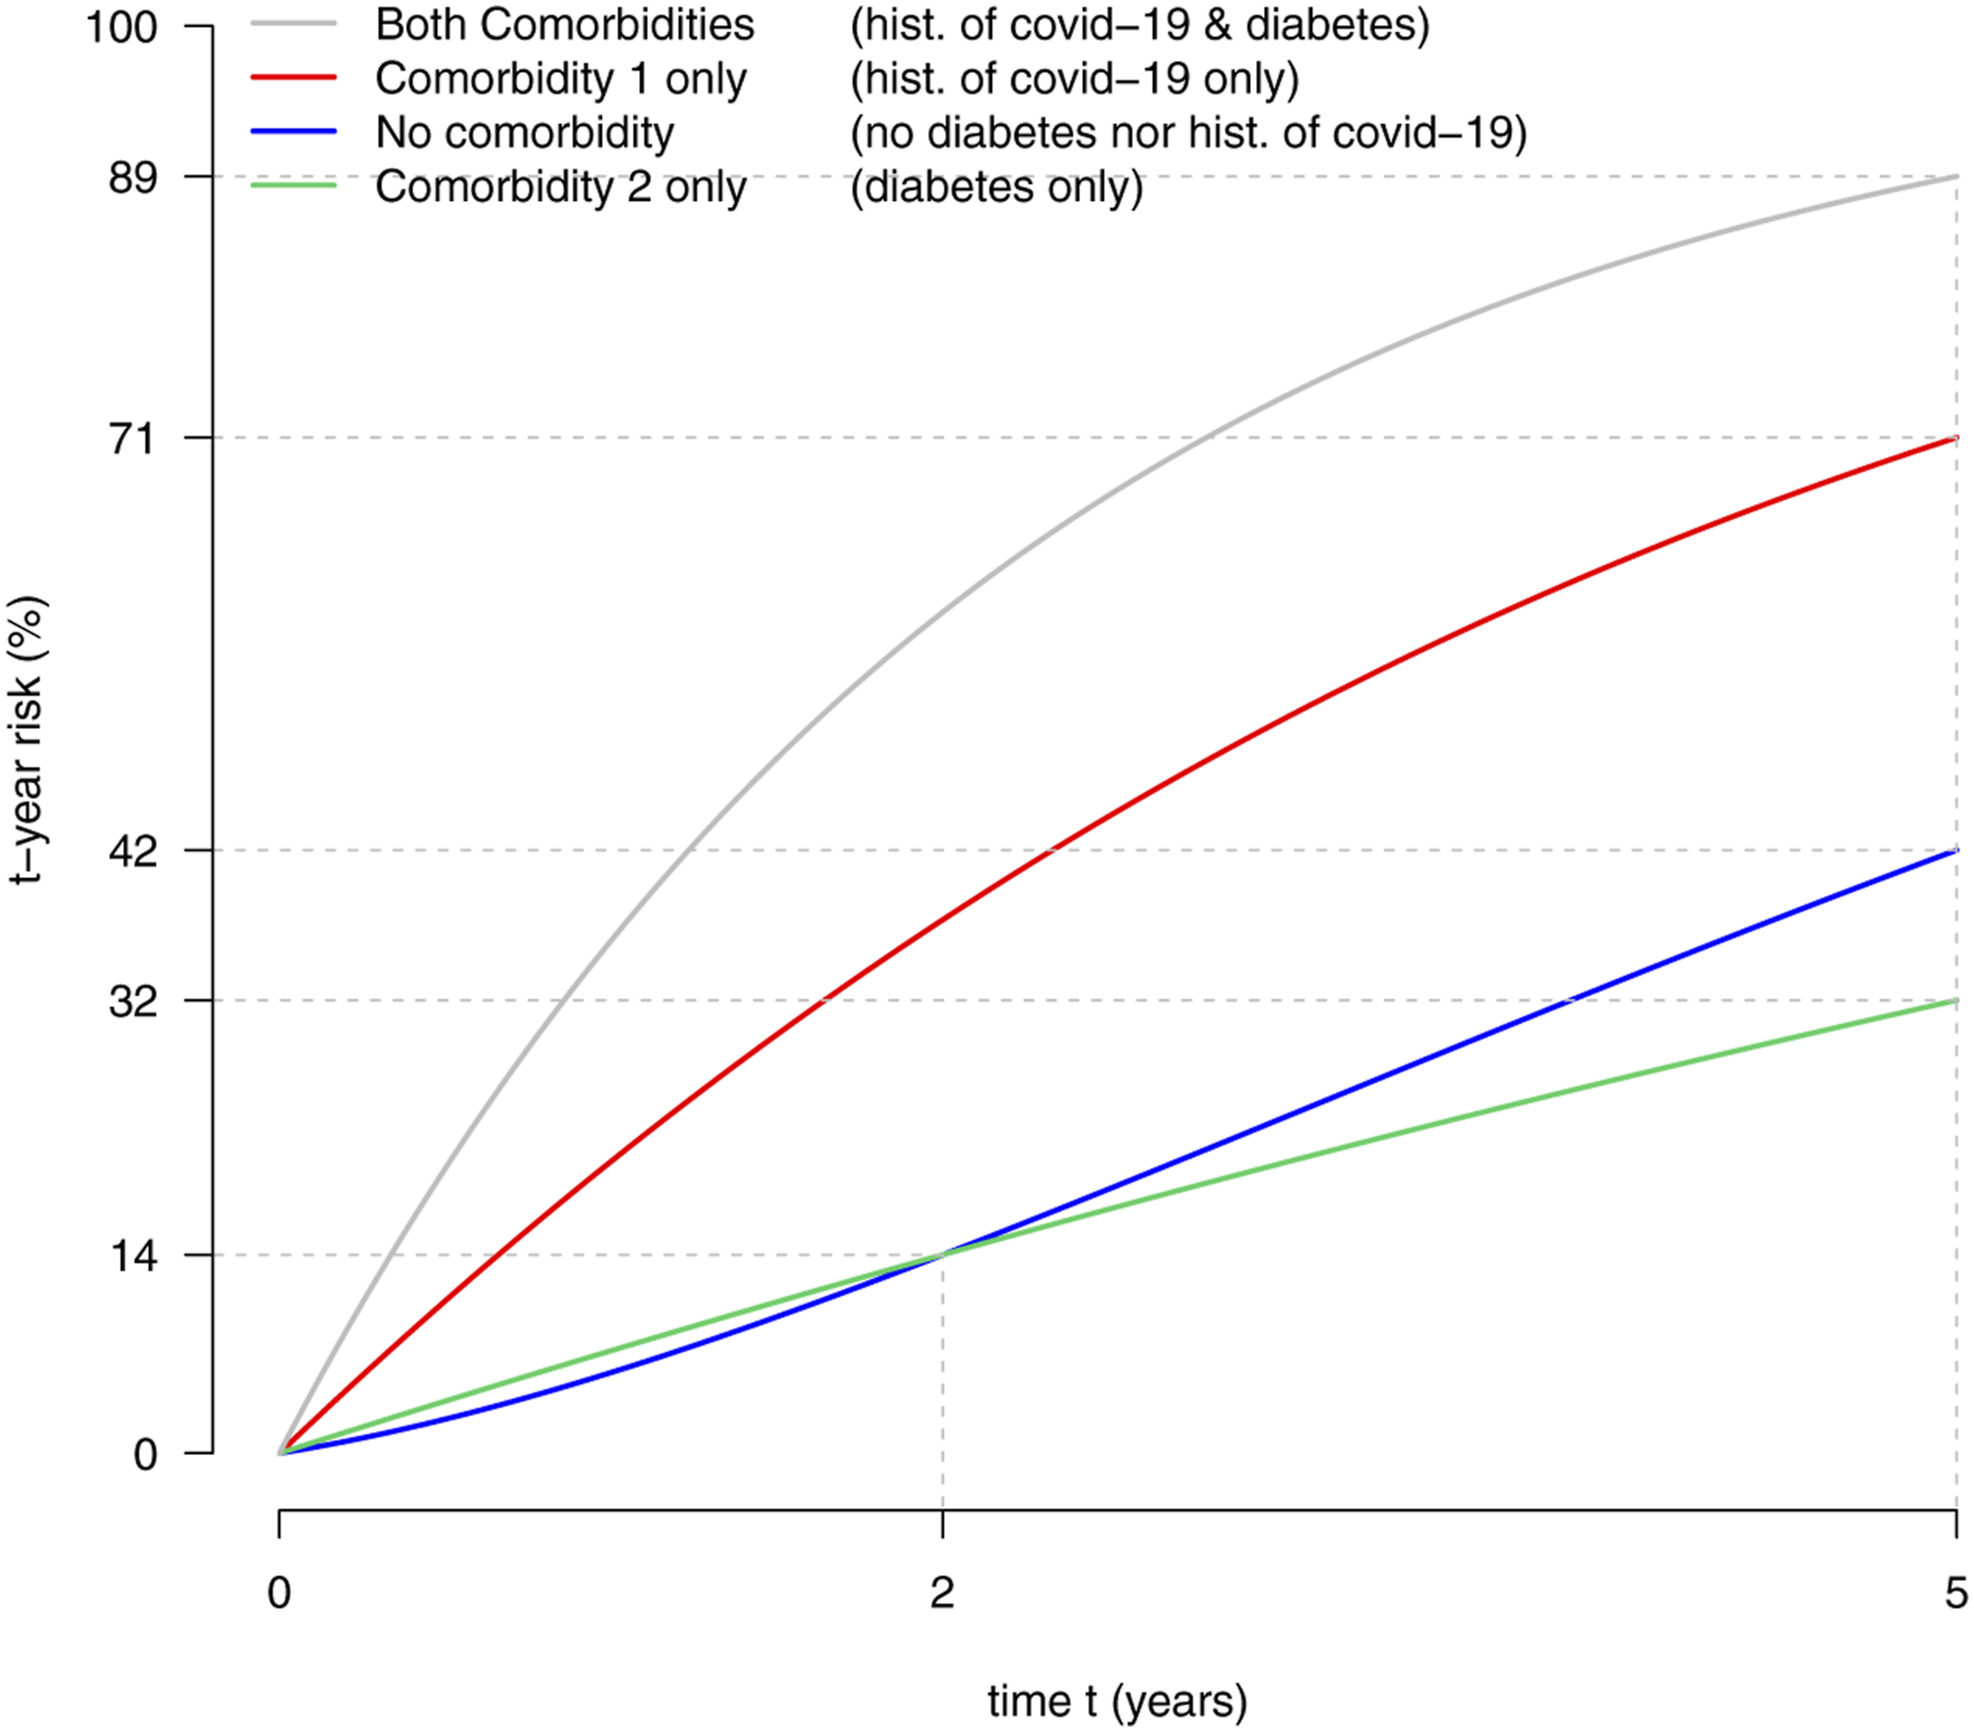
Figure 3 presents the risks R (s, t|X1(s) = x1, X2(s) = x2), for any time t and previous diagnosis of comorbidity known at a given time s > 0, encoded via the values x1, x2 ∈ {0, 1}. It can be shown that, in this example, the t-year risk given the information known at time s, that is, R (s, t|X1(s) = x1, X2(s) = x2), is the same for all times s > 0. Hence, Figure 3 displays the risk for any prediction horizon t and time s at which the risk is computed given the available information. Note that in the literature the time s at which the risk is computed is often referred to as the “landmark” time.8,9
Figure 3 shows that for any prediction horizon t, the t-year risk is always the highest for subjects with both diabetes and history of covid-19. Then comes the t-year risk for subjects with history of covid-19 only. The risk for these subjects is always higher than the risk of subjects with either no covid-19 history and no diabetes or diabetes only. But, when comparing the t-year risks of subjects with diabetes only to that of those without covid-19 history nor diabetes, it appears that which one is the highest depends on the prediction horizon t. For “short-term” prediction with t < 2, the risk is lower for subjects with no comorbidity, but for “long-term” with t > 2, the risk is higher. Consequently, the risk ratio
The explanation of the discrepancy between the hazard ratio and the risk ratio
To explain why the risk ratio
For instance, the t-year risk of a subject with diabetes only also depends on the hazards of subsequently developing covid-19 and of dying with both diabetes and a history of covid-19. To explain why, we first note that the risk of dying within the next t years can be thought as the sum of the risks of dying at each day during the next t years. As long as the subject is alive and has not developed covid-19 yet, the risk of dying during the current day is essentially driven by the hazard of dying with diabetes only. But, during the same day, the subjects is at risk of developing covid-19 instead and, if it happens, for all subsequent days, the risk of dying during the current day will be driven by the hazard of dying with both diabetes and history of covid-19. Mathematically, this translates into a calculation presented in detail in the Supplementary material.
Figure 2 emphasizes that the hazard of developing covid-19 is, in this example, much lower for subjects with diabetes. This can be seen when comparing the thickness of the arrows from “Healthy” to “Comorbidity 1 (hist. of covid-19)” and from “Comorbidity 2 (diabetes)” to “Comorbidities 1 and 2 (hist. of covid-19 and diabetes).” This happens in real life when patients with diabetes are more likely to change their lifestyle to limit their risk of developing covid-19 and are more likely to receive a vaccine, as compared to subjects without diabetes. Of note, during the covid-19 pandemic, comorbid European patients, including diabetes patients, were encouraged to reduce their social interactions even more than healthier subjects and had easier access to vaccination.
Figure 2 also emphasizes that the hazard of dying is much higher for any subject with history of covid-19 than for the others. This can be seen by noticing that the two thickest arrows which point to “Death” originate from “Comorbidity 1 (hist. of covid-19)” and “Comorbidities 1 and 2 (hist. of covid-19 and diabetes).” Put together, this fact, the decrease rate of covid-19 among patients with diabetes, plus the following one explain why the risk ratio
In other words, in our example, it is unlikely that a subject with diabetes only will develop covid-19, which is by far more dangerous than diabetes, for both short and long term predictions. By contrast, a healthy subject without diabetes nor history of covid-19 is much more likely to develop this dangerous covid-19. Hence, if the prediction horizon t is large enough to make it likely enough that a subject will develop covid-19, it makes the prognosis (i.e., the risk) of a healthy subject worse than that of a subject with diabetes only. However, for a small prediction time t it is unlikely that the subject can develop the dangerous covid-19 history within this time frame and therefore the increased hazard of dying due to diabetes results into an increased short term risk. This is especially pronounced for very short term prediction because the t-risk is approximately proportional to the hazard for a very short prediction horizon t, as already mentioned earlier. This is apparent from the enriched Figure 1 provided in the Supplementary material, by noticing that all t-year risk curves are well approximated by a straight lines that pass through the origin and have slopes equal to the hazards, for small values of t.
Discussion
We have presented what might go wrong when one draws conclusions on the risk based on the hazard ratio of a time-dependent Cox model. We hope that this will promote more caution in the interpretations of some results to be published in medical journals.
But, let us be clear. We are not especially negative about the time-dependent Cox model in itself. It has proved useful in the past and will definitely still be useful in the future, as long as its limitations are well known and acknowledged.
It is also good to know that in some very specific contexts the limitation that we have described vanishes. This is, for example, the case when there is only one binary time-dependent covariate which can only increase over time. That is, in the context of the irreversible illness-death multi-state model, as pointed out by Putter and van Houwelingen. 10 We also believe that it is quite uncommon to collect data for which an increase (or decrease) in hazard rate does not match that of the risk, as in our example. Hence, we do not think that most publications drawing conclusions on the risks based on hazard ratios of time-dependent Cox models are wrong, but only that such conclusions are generally insufficiently supported by the data analysis.
When the interest lies on the risk, we think that it is usually better to directly model the risk instead of the hazard, whenever possible. To do so, an interesting and simple approach is to fit a direct binomial regression model through landmarking and either inverse probability of censoring weighting or pseudo observations.11,12
Other limitations that might not be obvious to all users of the Cox models include those due to competing risks 4 and causal interpretations.13,14 The competing risks setting also makes the connection between the risk ratio and the hazard ratio disappear. In our example, the two events of dying without developing an additional comorbidity and of developing a comorbidity can actually be thought as competing events. From this observation, it can be noted that several of our explanations parallel those to explain the loss of connection between the hazard ratio and risk ratio in the competing risks setting.
We support the recommendation of Sutradhar and Austin 15 that “The hazard ratio should be described as a relative rate, not as a relative risk.” We agree with their observation that the terminology used to describe estimates of hazard ratios is often too loose and source of misunderstandings. We too discourage using the wide-spread terms “risk ratio” to refer to “hazard ratio” in general. As illustrated in this note, this becomes even more important when using time-dependent Cox models because not only the effect sizes but also the directions of the associations do not necessarily match (as can also happen with competing risks).
It might be especially important to be aware of the limitation discussed in this manuscript now, at a time when “big data” from nationwide registries are increasingly made available, see for example, Schmidt et al. 16 Indeed, it is not rare that they are analyzed with time-dependent Cox models, via nested-case control designs which can efficiently tackle the computational challenges of such big data .17,18
Supplemental Material
sj-pdf-1-rmm-10.1177_26320843211061288 – Supplemental Material for A hazard ratio above one does not necessarily mean higher risk, when using a time-dependent cox model
Supplemental Material, sj-pdf-1-rmm-10.1177_26320843211061288 for A hazard ratio above one does not necessarily mean higher risk, when using a time-dependent cox model by Paul Blanche, Bochra Zareini and Peter V Rasmussen in Research Methods in Medicine & Health Sciences
Footnotes
Declaration of conflicting interests
The author(s) declared no potential conflicts of interest with respect to the research, authorship, and/or publication of this article.
Funding
The author(s) received no financial support for the research, authorship, and/or publication of this article.
Supplemental Material
Supplemental material for this article is available online.
References
Supplementary Material
Please find the following supplemental material available below.
For Open Access articles published under a Creative Commons License, all supplemental material carries the same license as the article it is associated with.
For non-Open Access articles published, all supplemental material carries a non-exclusive license, and permission requests for re-use of supplemental material or any part of supplemental material shall be sent directly to the copyright owner as specified in the copyright notice associated with the article.