
Abstract
Objective
We evaluate data agreement between an electronic health record (EHR) sample abstracted by automated characterization with a standard abstracted by manual review.
Study Design and Setting
We obtain data for an epidemiology cohort study using standard manual abstraction of the EHR and automated identification of the same patients using a structured algorithm to query the EHR. Summary measures of agreement (e.g., Cohen’s kappa) are reported for 12 variables commonly used in epidemiological studies.
Results
Best agreement between abstraction methods is observed among demographic characteristics such as age, sex, and race, and for positive history of disease. Poor agreement is found in missing data and negative history, suggesting potential impact for researchers using automated EHR characterization. EHR data quality depends upon providers, who may be influenced by both institutional and federal government documentation guidelines.
Conclusion
Automated EHR abstraction discrepancies may decrease power and increase bias; therefore, caution is warranted when selecting variables from EHRs for epidemiological study using an automated characterization approach. Validation of automated methods must also continue to advance in sophistication with other technologies, such as machine learning and natural language processing, to extract non-structured data from the EHR, for application to EHR characterization for clinical epidemiology.
Keywords
Highlights
Discrepancies may appear when comparing automatic versus manual EHR characterization. Discrepancies may introduce bias to measures of association such as odds ratios. Poor agreement for unstructured (free-form) EHR data may explain variable quality. Automatically abstracted EHR data may require validation with manual methods. Policy affecting clinician EHR editing may improve underlying data quality.
Introduction
Background and significance
Use of electronic health record (EHR) data in clinical epidemiological research has grown explosively. 1 Transition from paper charts to EHR systems enabled electronic search and abstraction of clinical data for manual chart review studies.2,3 Increasingly, EHR characterization involves automated search algorithms employing International Classification of Diseases (ICD) codes, billing claims and patient demographics, or other characteristics from structured (template-like) vs unstructured (free-form) EHR sources. Accuracy of data obtained through automated EHR characterization versus manual searches has been studied in diverse contexts, with heterogeneity of the EHR and variable agreement between abstraction methods being common themes.4-6
Manual EHR abstraction, while considered a gold standard, 7 compares to automated abstraction in its susceptibility to quality issues due to clinical or administrative coding errors and also missing data. However, despite common limitations due to underlying data quality, potential advantages of automated, standardized search techniques are numerous, including more timely results, reduced labor intensity, reduced likelihood of data entry errors, unbiased queries, larger sample sizes, and capacity to define search parameter ranges precisely. 8 Manual chart review may have additional limitations of lack of rigorous quality control and increased subjectivity in collection techniques.9-11
Study setting and aims
The setting of this study is a single academic health center, the Medical University of South Carolina (MUSC). Like multiple other academic health centers, MUSC maintains EHR warehouses, which are populated by clinical data (The automated chart review method) and which may be queried for research.12, 13 To improve accuracy of automated searching algorithms, it is crucial to understand the contexts in which EHR searches produce reliable data. We compute measures of agreement for 12 variables commonly assessed in clinical epidemiology studies; we evaluate the impact of agreement measures on the attenuation in true odds ratios due to error; and finally, we analyze how measures of agreement between automated and manual methods improved due to national policy changes.
Materials and methods
Study population and patient privacy and protection
The Medical University of South Carolina (MUSC) Institutional Review Board (IRB# Pro00007139) approved all activities. The study population comprised patients with histologically confirmed advanced adenomatous colorectal polyp diagnosed between October 2012 and 30 June 2016. All cases were selected from the MUSC pathology laboratory information system CoPath (Cerner Corporation, Kansas City, MO). Specifically, we identified patients who underwent a sigmoidoscopy or colonoscopy with polypectomy of
Data collection
The manual chart abstraction (MCA)
A trained data abstractor blind to the study intent performed the MCA according to a short procedural manual. No sources of information within the EHR were explicitly excluded; patient histories, progress notes, and pathology reports were all searched to obtain the defined demographic and medical criteria (see Supplementary Table A). Study data were stored at MUSC using REDCap (Research Electronic Data Capture). 14 We reviewed patient encounter dates, problem lists (summary of all active diagnoses), histories (medical and family), progress notes, procedure notes, office notes, narrative and impression documents, and pathology results. Additionally, the EHR of each patient was manually queried using text search within patient records using these terms: colon, colectomy, flexible sigmoidoscopy, colonoscopy, diabetes, BMI, hypertension, hyperlipidemia, smoking, and cancer (Supplementary Table A). Manual review directly searched EHR records for medical history since 2004; however, manual chart review captured both smoking status and BMI only if assessed at a contact date within ±30 days of the procedure date, a cutoff constructed for increased relevance to colorectal cancer prognosis.
The automated chart review method
International Classification of Disease (ICD) codes and current procedural terminology (CPT) codes were used to define a structured query language (SQL) for EHR characterization. In this work, EHR characterization refers to the development and use of algorithms needed to capture an accurate digital impression of observed patient characteristics documented within the EHR.15-17 Algorithms for automated chart review were defined to match date ranges and subjects from the MCA. Patient medical record numbers (MRNs) from the MCA and query parameters were supplied to an honest broker who performed the automated EHR characterization within the Research Data Warehouse (RDW) at MUSC. 18 The RDW supports longitudinal research by sourcing data from the EHR, legacy systems, and patient registries on campus. Contact dates were used to limit medical history to May 2012, when the first outpatient contacts were documented in the EHR. However, history assessed at those contact dates could reflect, for example, a colonoscopy performed prior to May 2012. ICD codes C18, C20, Z85, and C34 were queried for cancer history, and numerous ICD codes such as I10-15, E78, and E08 were queried to identify patients with a history of hypertension, hypelipidemia, or diabetes. In addition to ICD codes, CPT codes were used to identify family history of cancer among patient and provider records (Supplementary Table A).
Statistics
Percent agreements were calculated for the data obtained using each of the two abstraction methods: the numerator is the number of patients who were classified identically by both sources and the denominator is the total number of cases evaluated by both sources. The summary agreement for each variable is the total number of agreeing results divided by the total number of results.
Cohen’s kappas with their 95% confidence intervals (CIs) were calculated to assess agreement for each categorical variable. 19 Landis and Koch 20 cutoffs were used to interpret kappas: a score of 0.00–0.20 indicates slight agreement, 0.21–0.40 is fair, 0.41–0.60 is moderate, 0.61–0.80 is good, and 0.81–1.00 is very good. For continuous variables, the coefficients of Pearson product-moment correlations (PCCs) were calculated as a measure of interclass reliability. 21 Pearson correlations have been interpreted similarly: negligible (0.00–0.30), low (0.30–0.50), moderate (0.50–0.70), high (0.70–0.90), and very high (0.90–1.00) correlation. 22 Bland-Altman mean-difference plots were also included to improve interpretation of agreement for the continuous variables age and BMI. 23 We employed Pearson correlations, Bland-Altman plots, and Cohen’s kappa methods to compare agreement trends over time for smoking history.
Finally, we estimated the potential impact of the rates of agreement over a range of true odds ratios for colorectal polyps and comorbidities using methodology from White et al.
21
The attenuation factor for kappa assumes non-differential measurement error and uncorrelated errors between the manual and automated techniques. For the reliability estimates (i.e., PCC), we assumed a parallel test methodology and assessed the attenuation in ORs using the formula
Analyses were performed in SAS v 9.4 (Cary, NC), with the exception of Figure 4, prepared in R (Vienna, Austria) using the tidyverse ggplot2 package. 24
Results
Patient characteristics
Comparison of patients in manual and automated reviews.
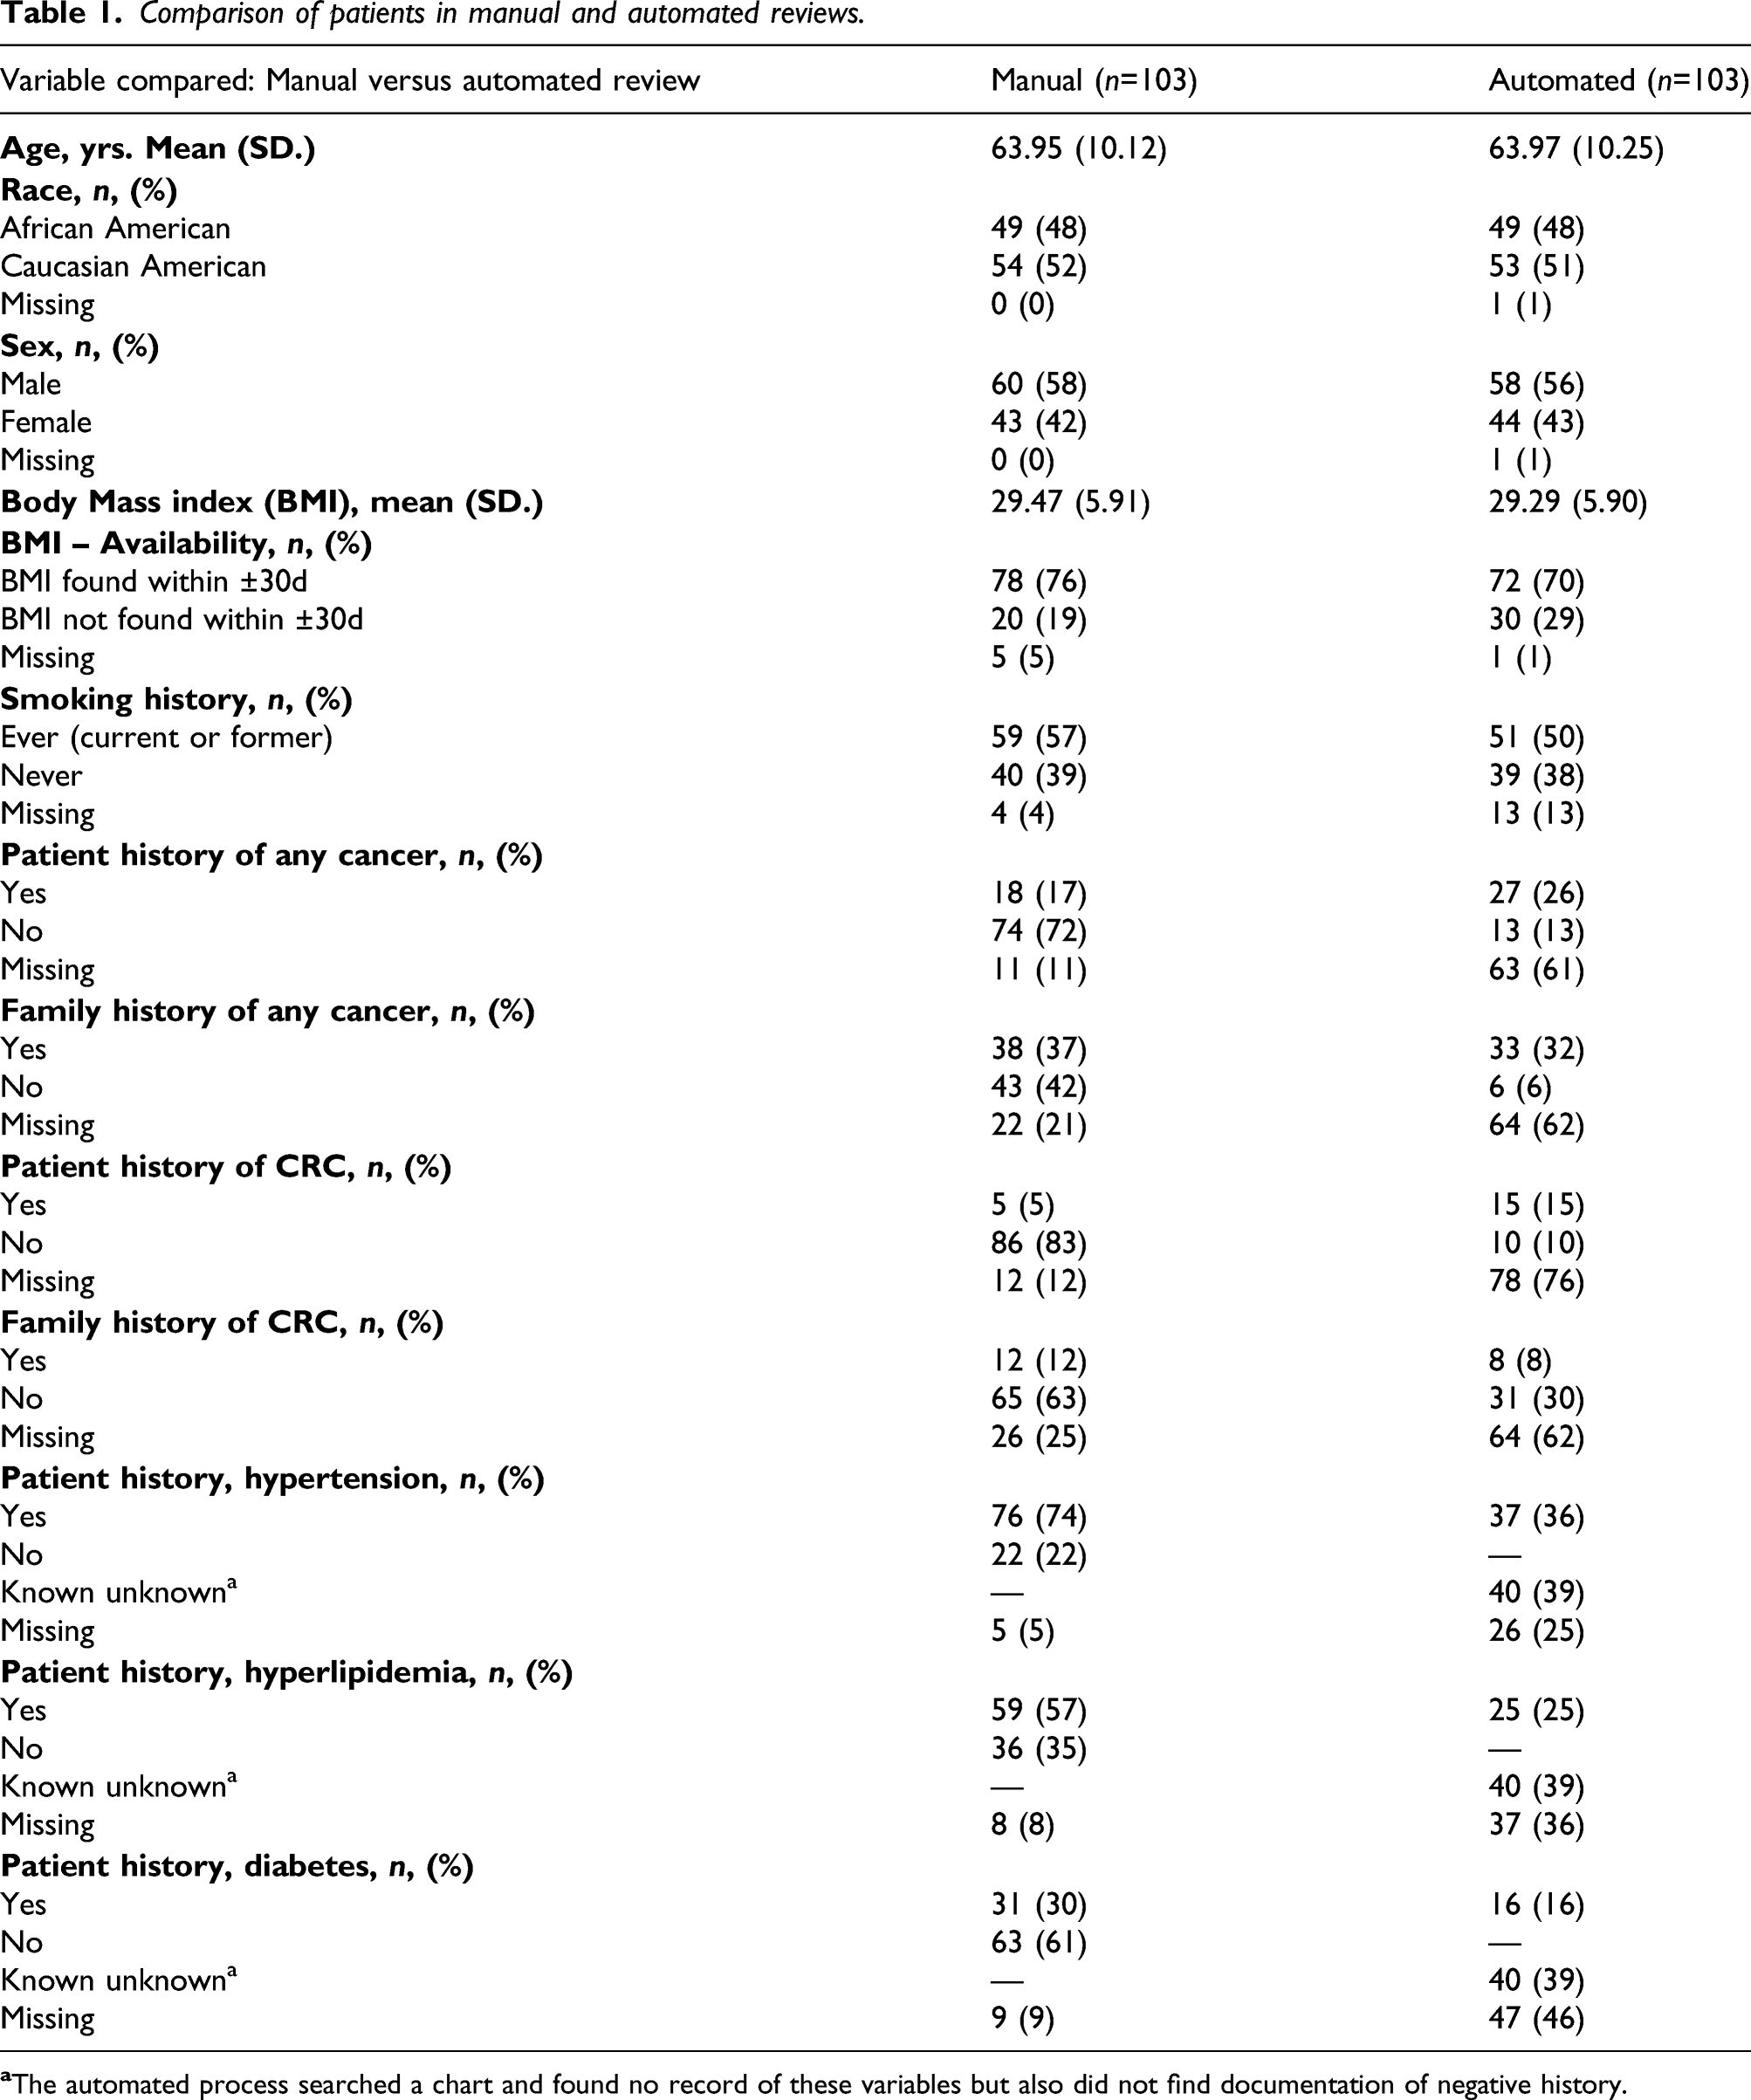
Patient history of cancer excepted, point estimates reveal that automated compared to manual review detected fewer cases of chronic diseases (hypertension, hyperlipidemia, and diabetes). Automated review also detected lower absolute percentages of patients with family history of colorectal cancer. Manual chart review was missing 0–25% of records, whereas automated EHR characterization was missing 1–76% of records.
Measures of agreement
Measures of Agreement for individual responses: percent agreement, Cohen’s Kappa and Pearson Correlation Coefficient (PCC).
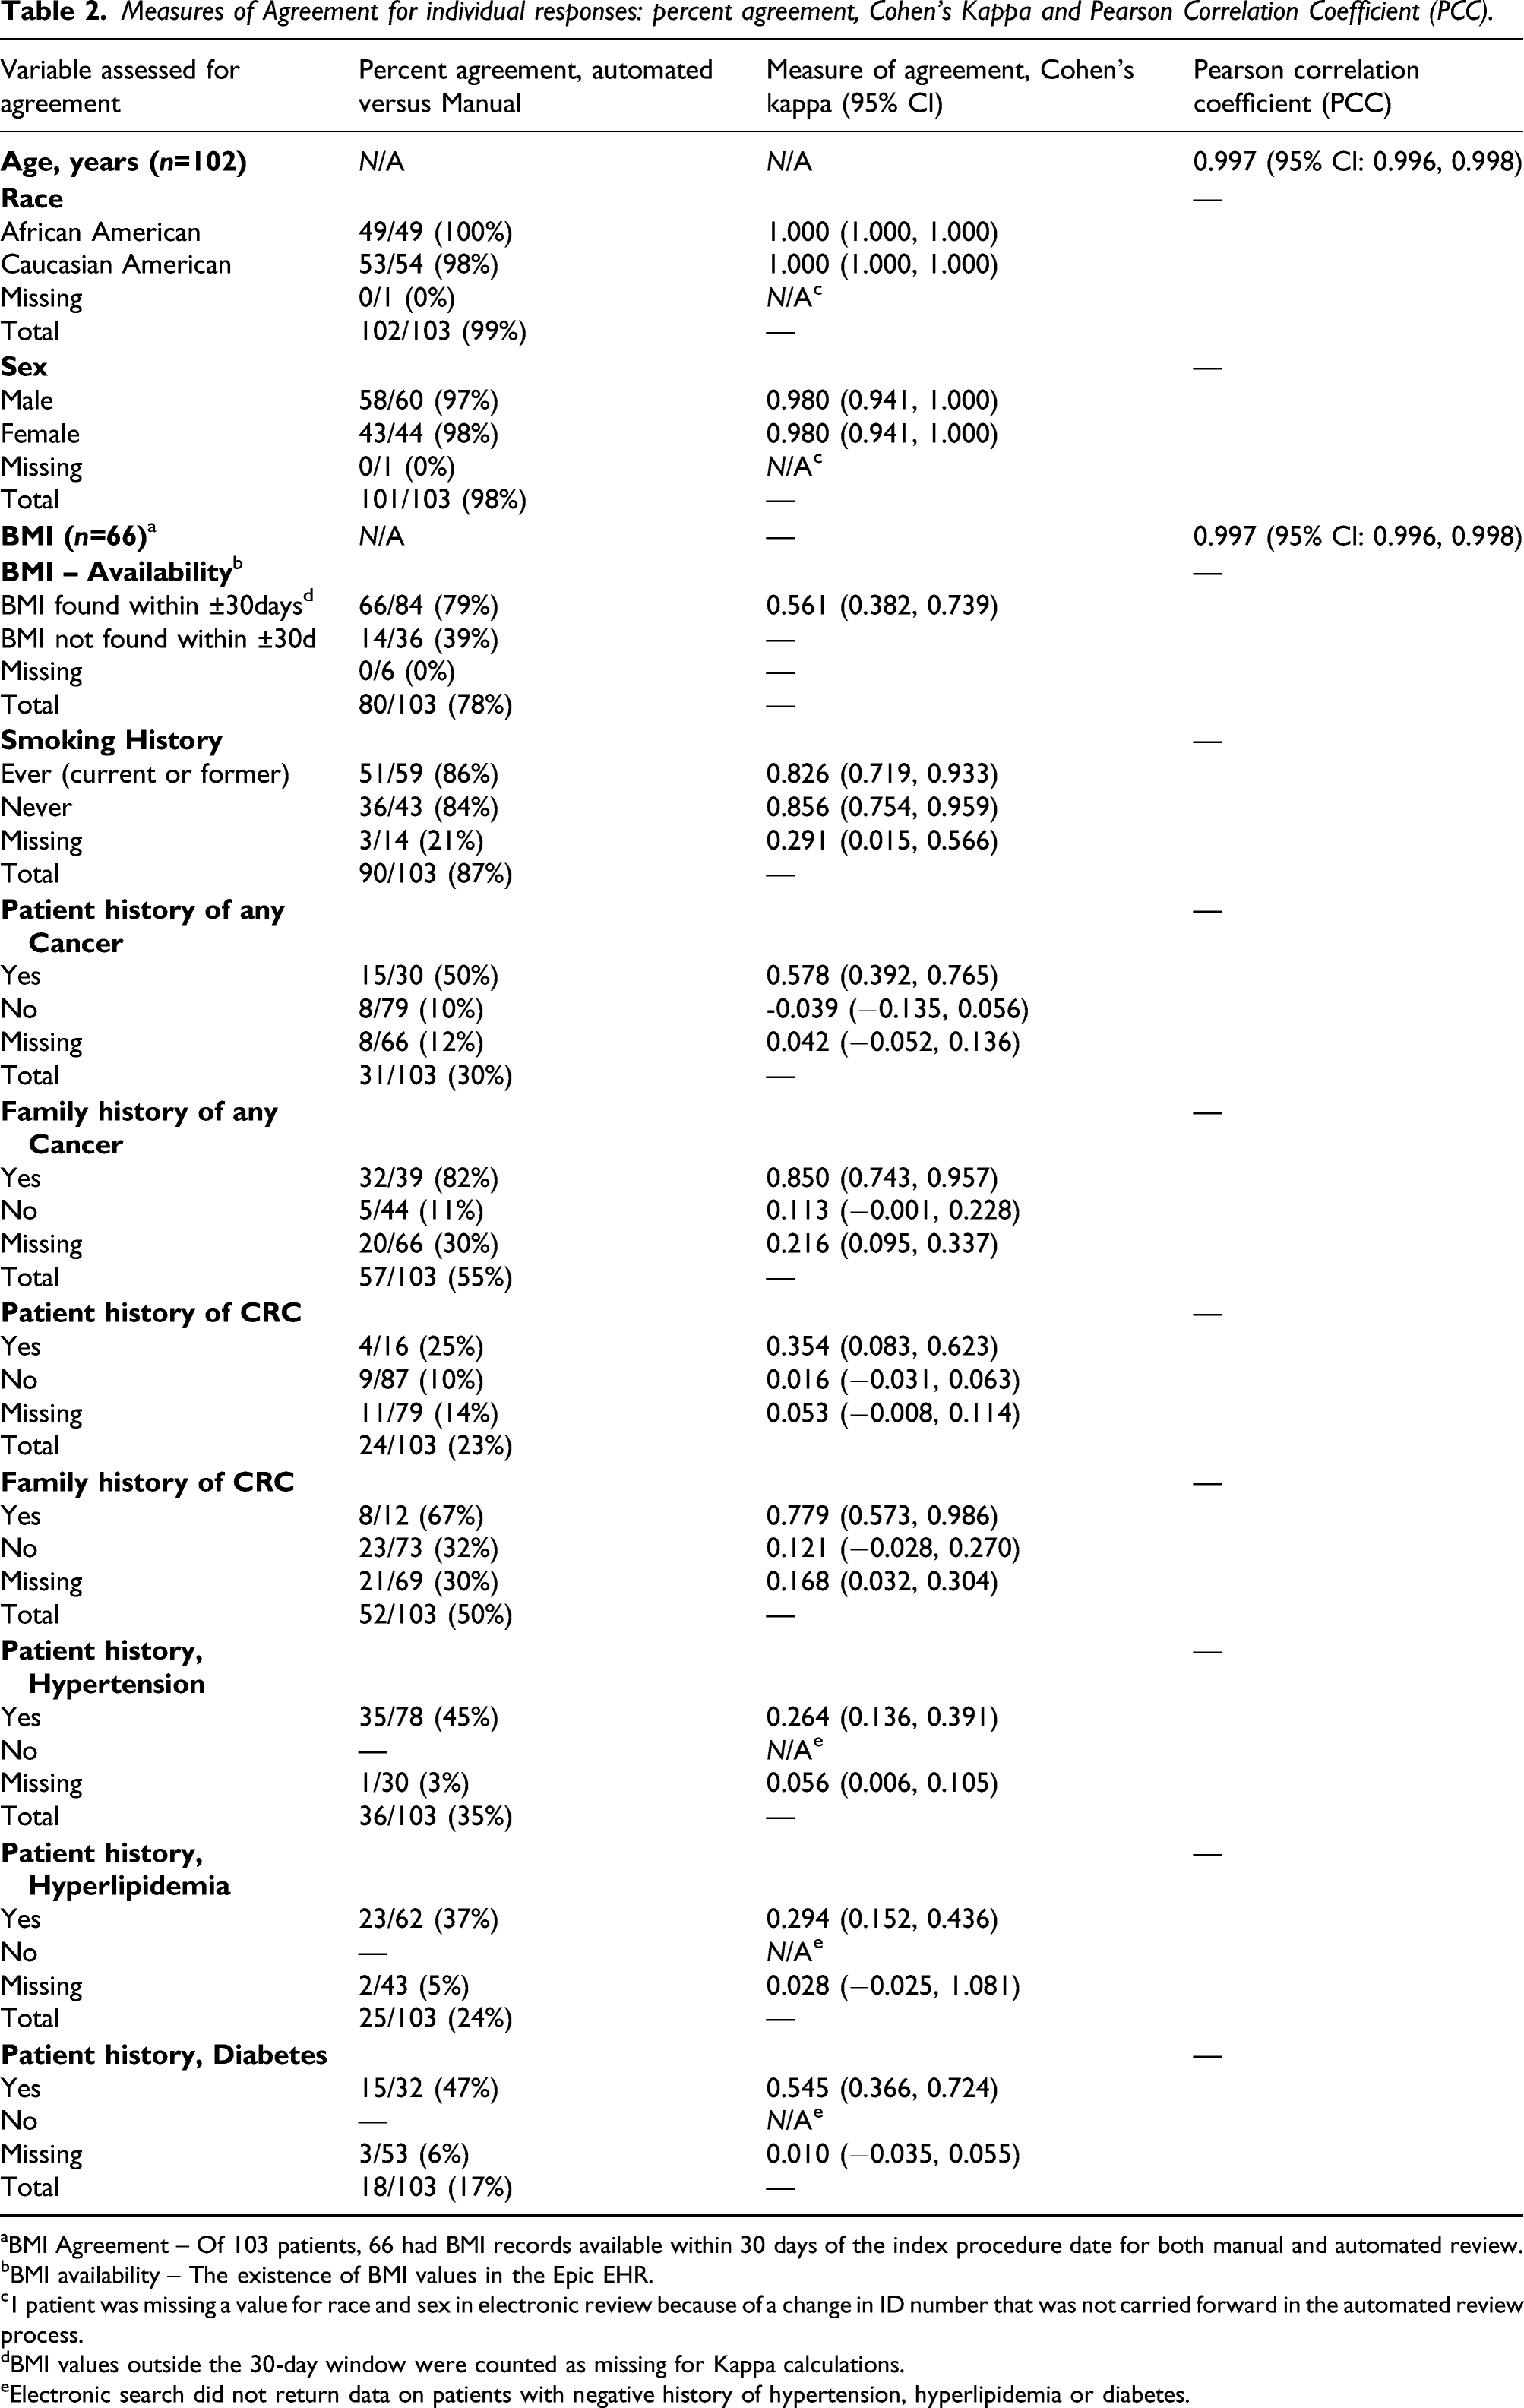
aBMI Agreement – Of 103 patients, 66 had BMI records available within 30 days of the index procedure date for both manual and automated review.
bBMI availability – The existence of BMI values in the Epic EHR.
c1 patient was missing a value for race and sex in electronic review because of a change in ID number that was not carried forward in the automated review process.
dBMI values outside the 30-day window were counted as missing for Kappa calculations.
eElectronic search did not return data on patients with negative history of hypertension, hyperlipidemia or diabetes.
Personal characteristics
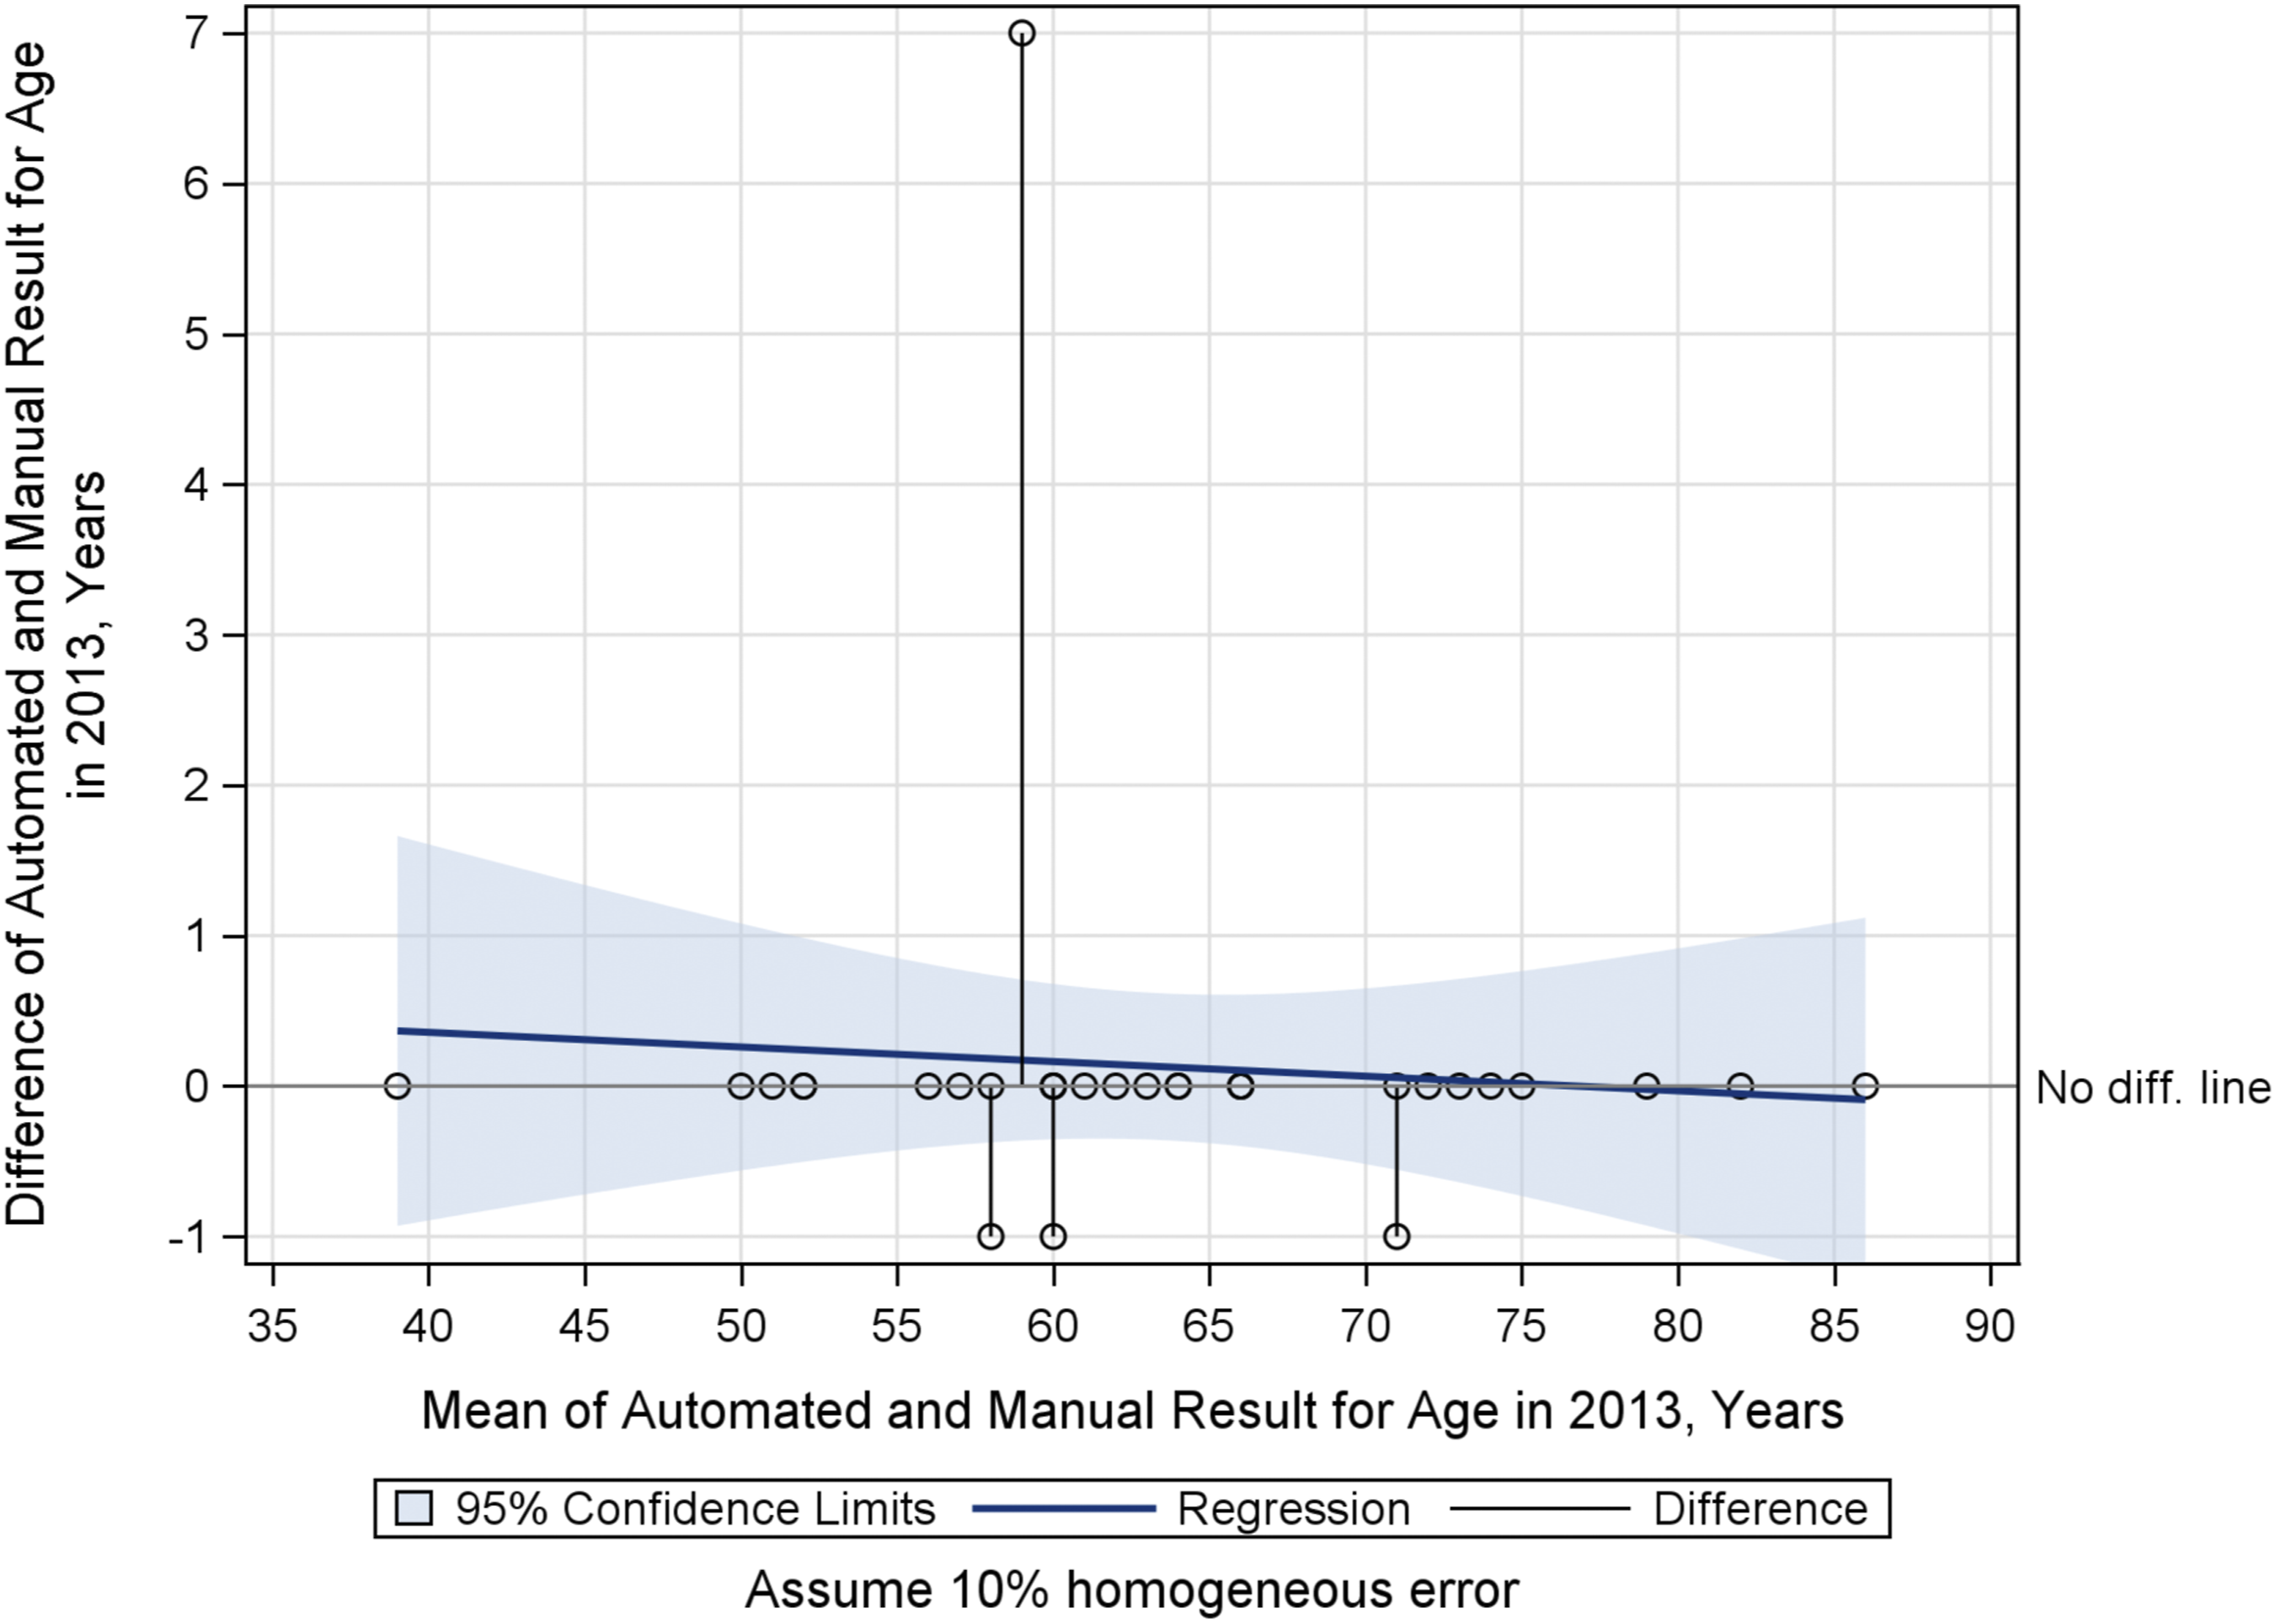
Agreement for age, race, and sex is “very good” or “very high.” Of 103 total subjects, 93 (90%) agreed between methods (Table 2). For age, automated results agree exactly with 90% of the manual review results (Figure 1). Agreement between methods for race and sex was nearly perfect (Tables 1 and 2 and Supplementary TableB2). Overall Age: Bland-Altman Mean-Difference Plot. 1-Year differences represent that Epic rounds when a patient’s birthday is upcoming; manual chart review did not round to nearest birthday. A 7-year difference outlier represents a manual transcription error.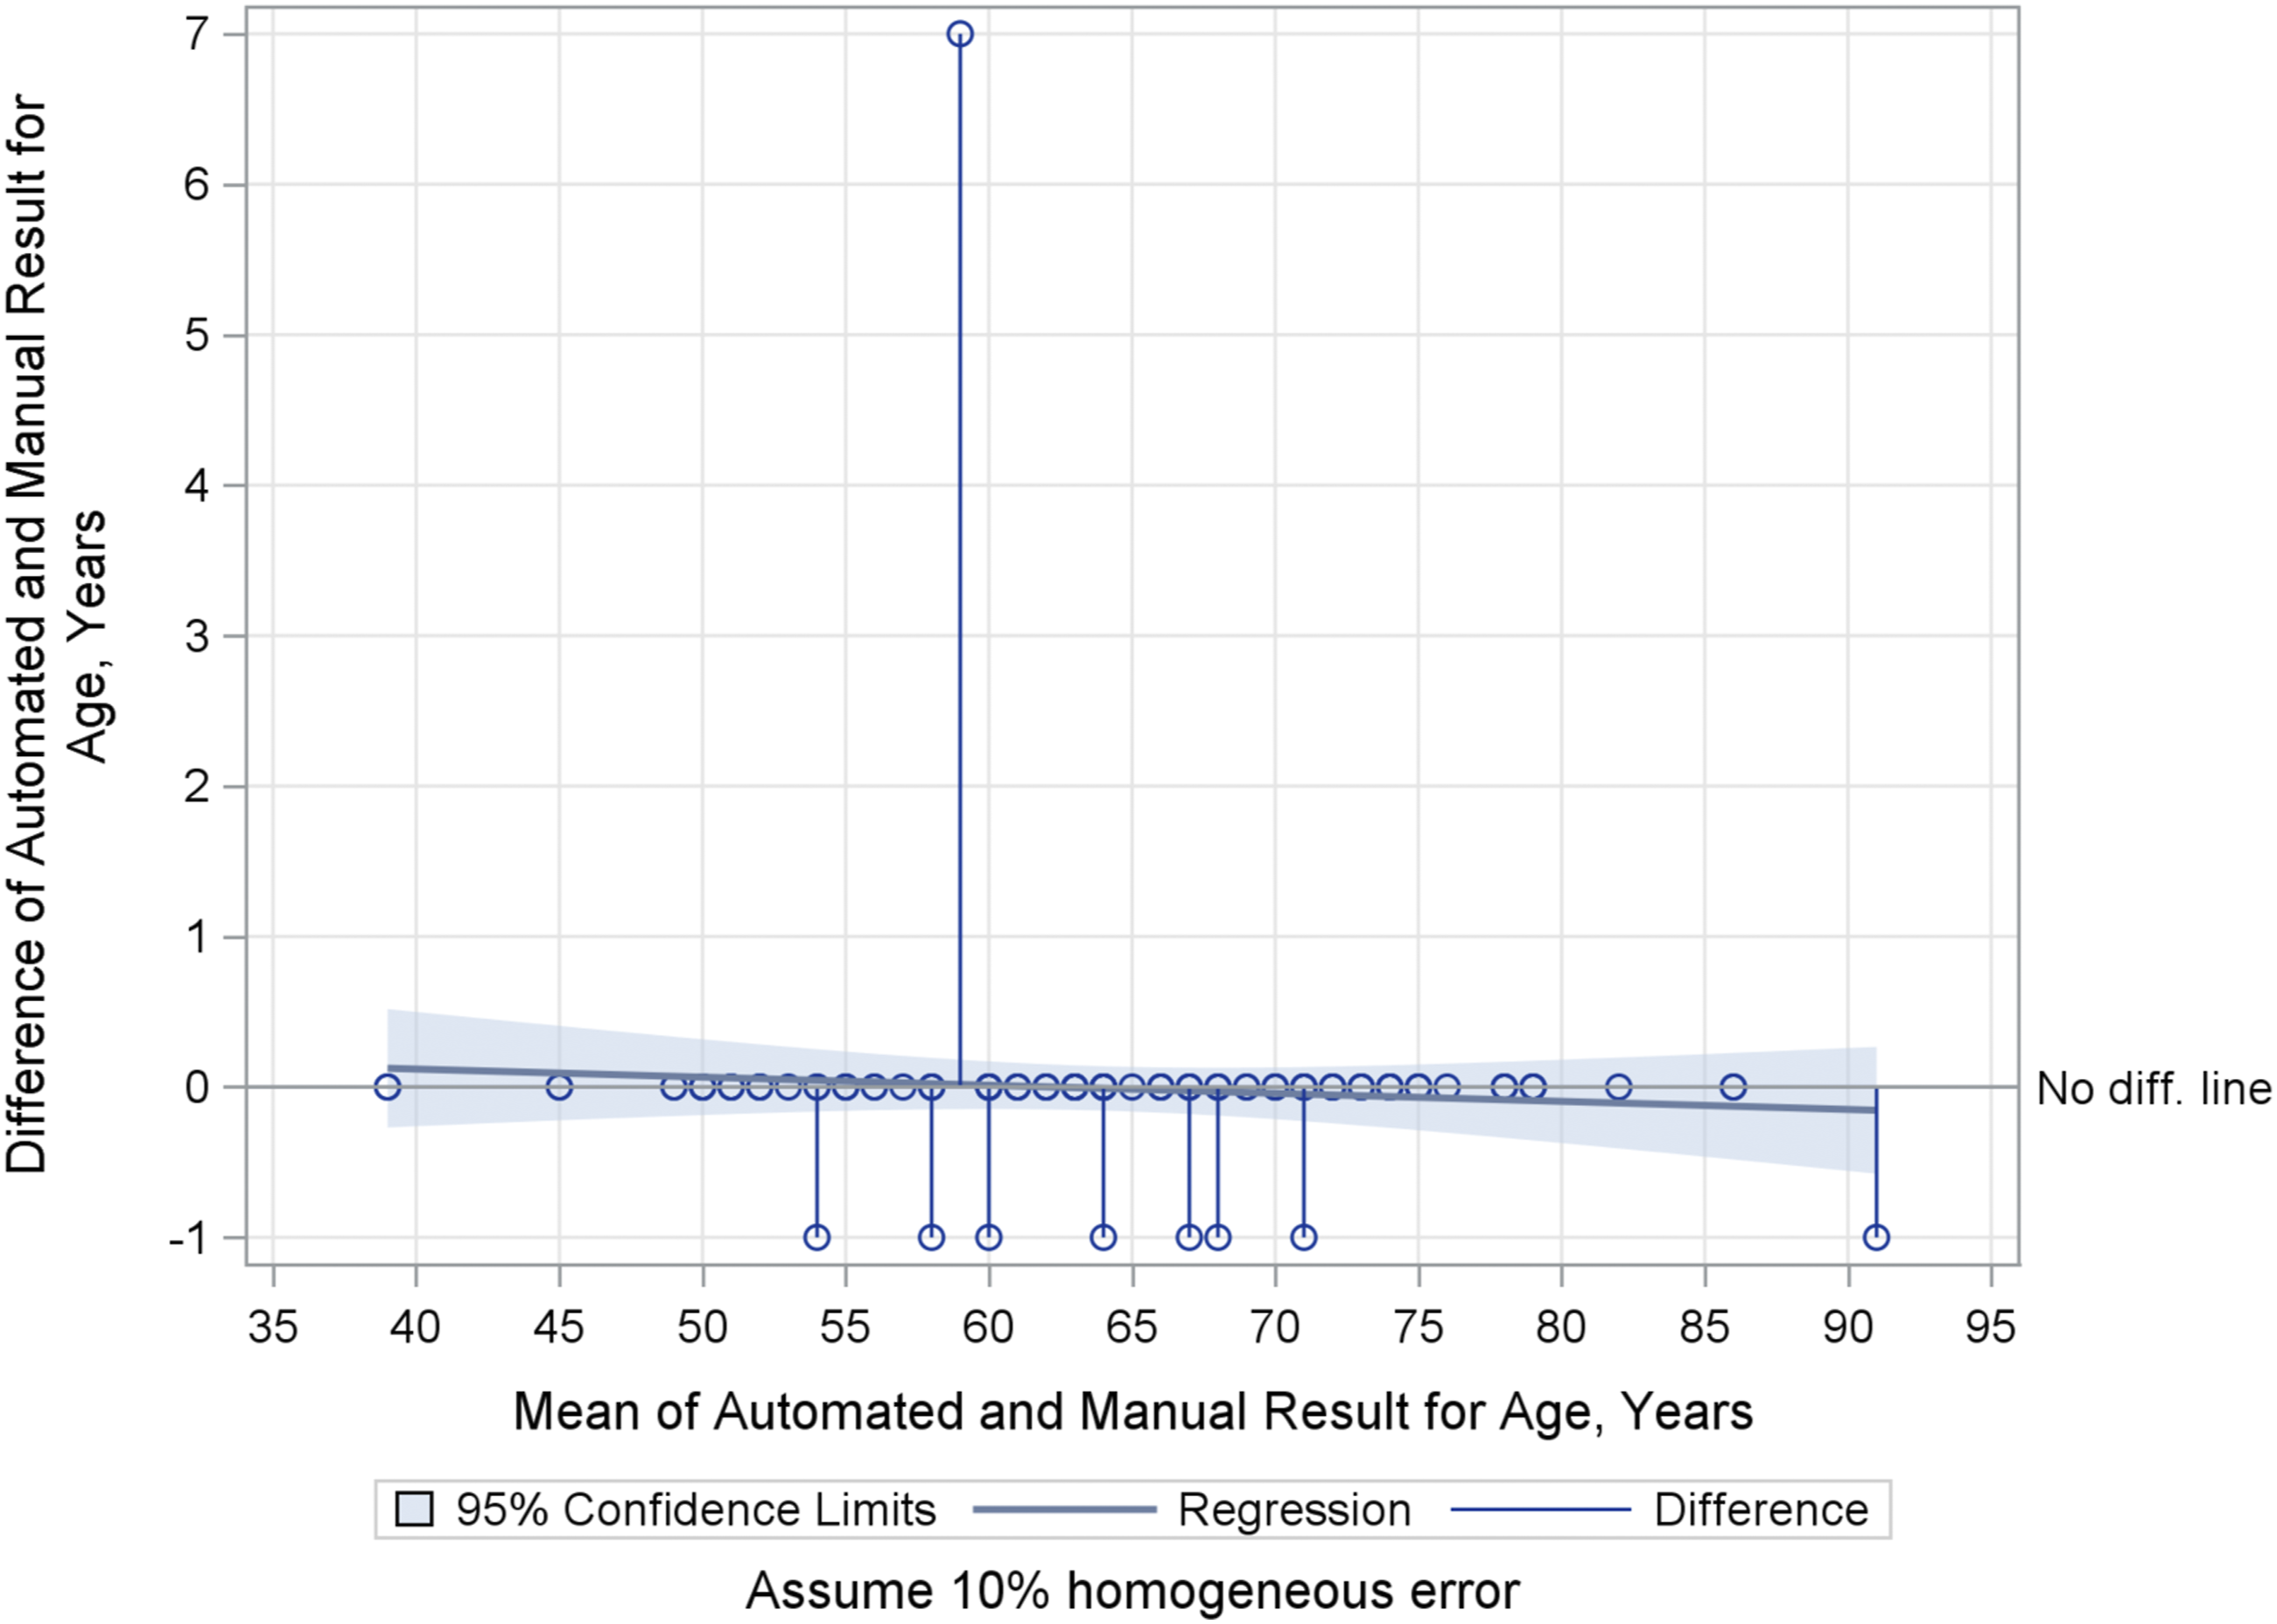
Body mass index (BMI)
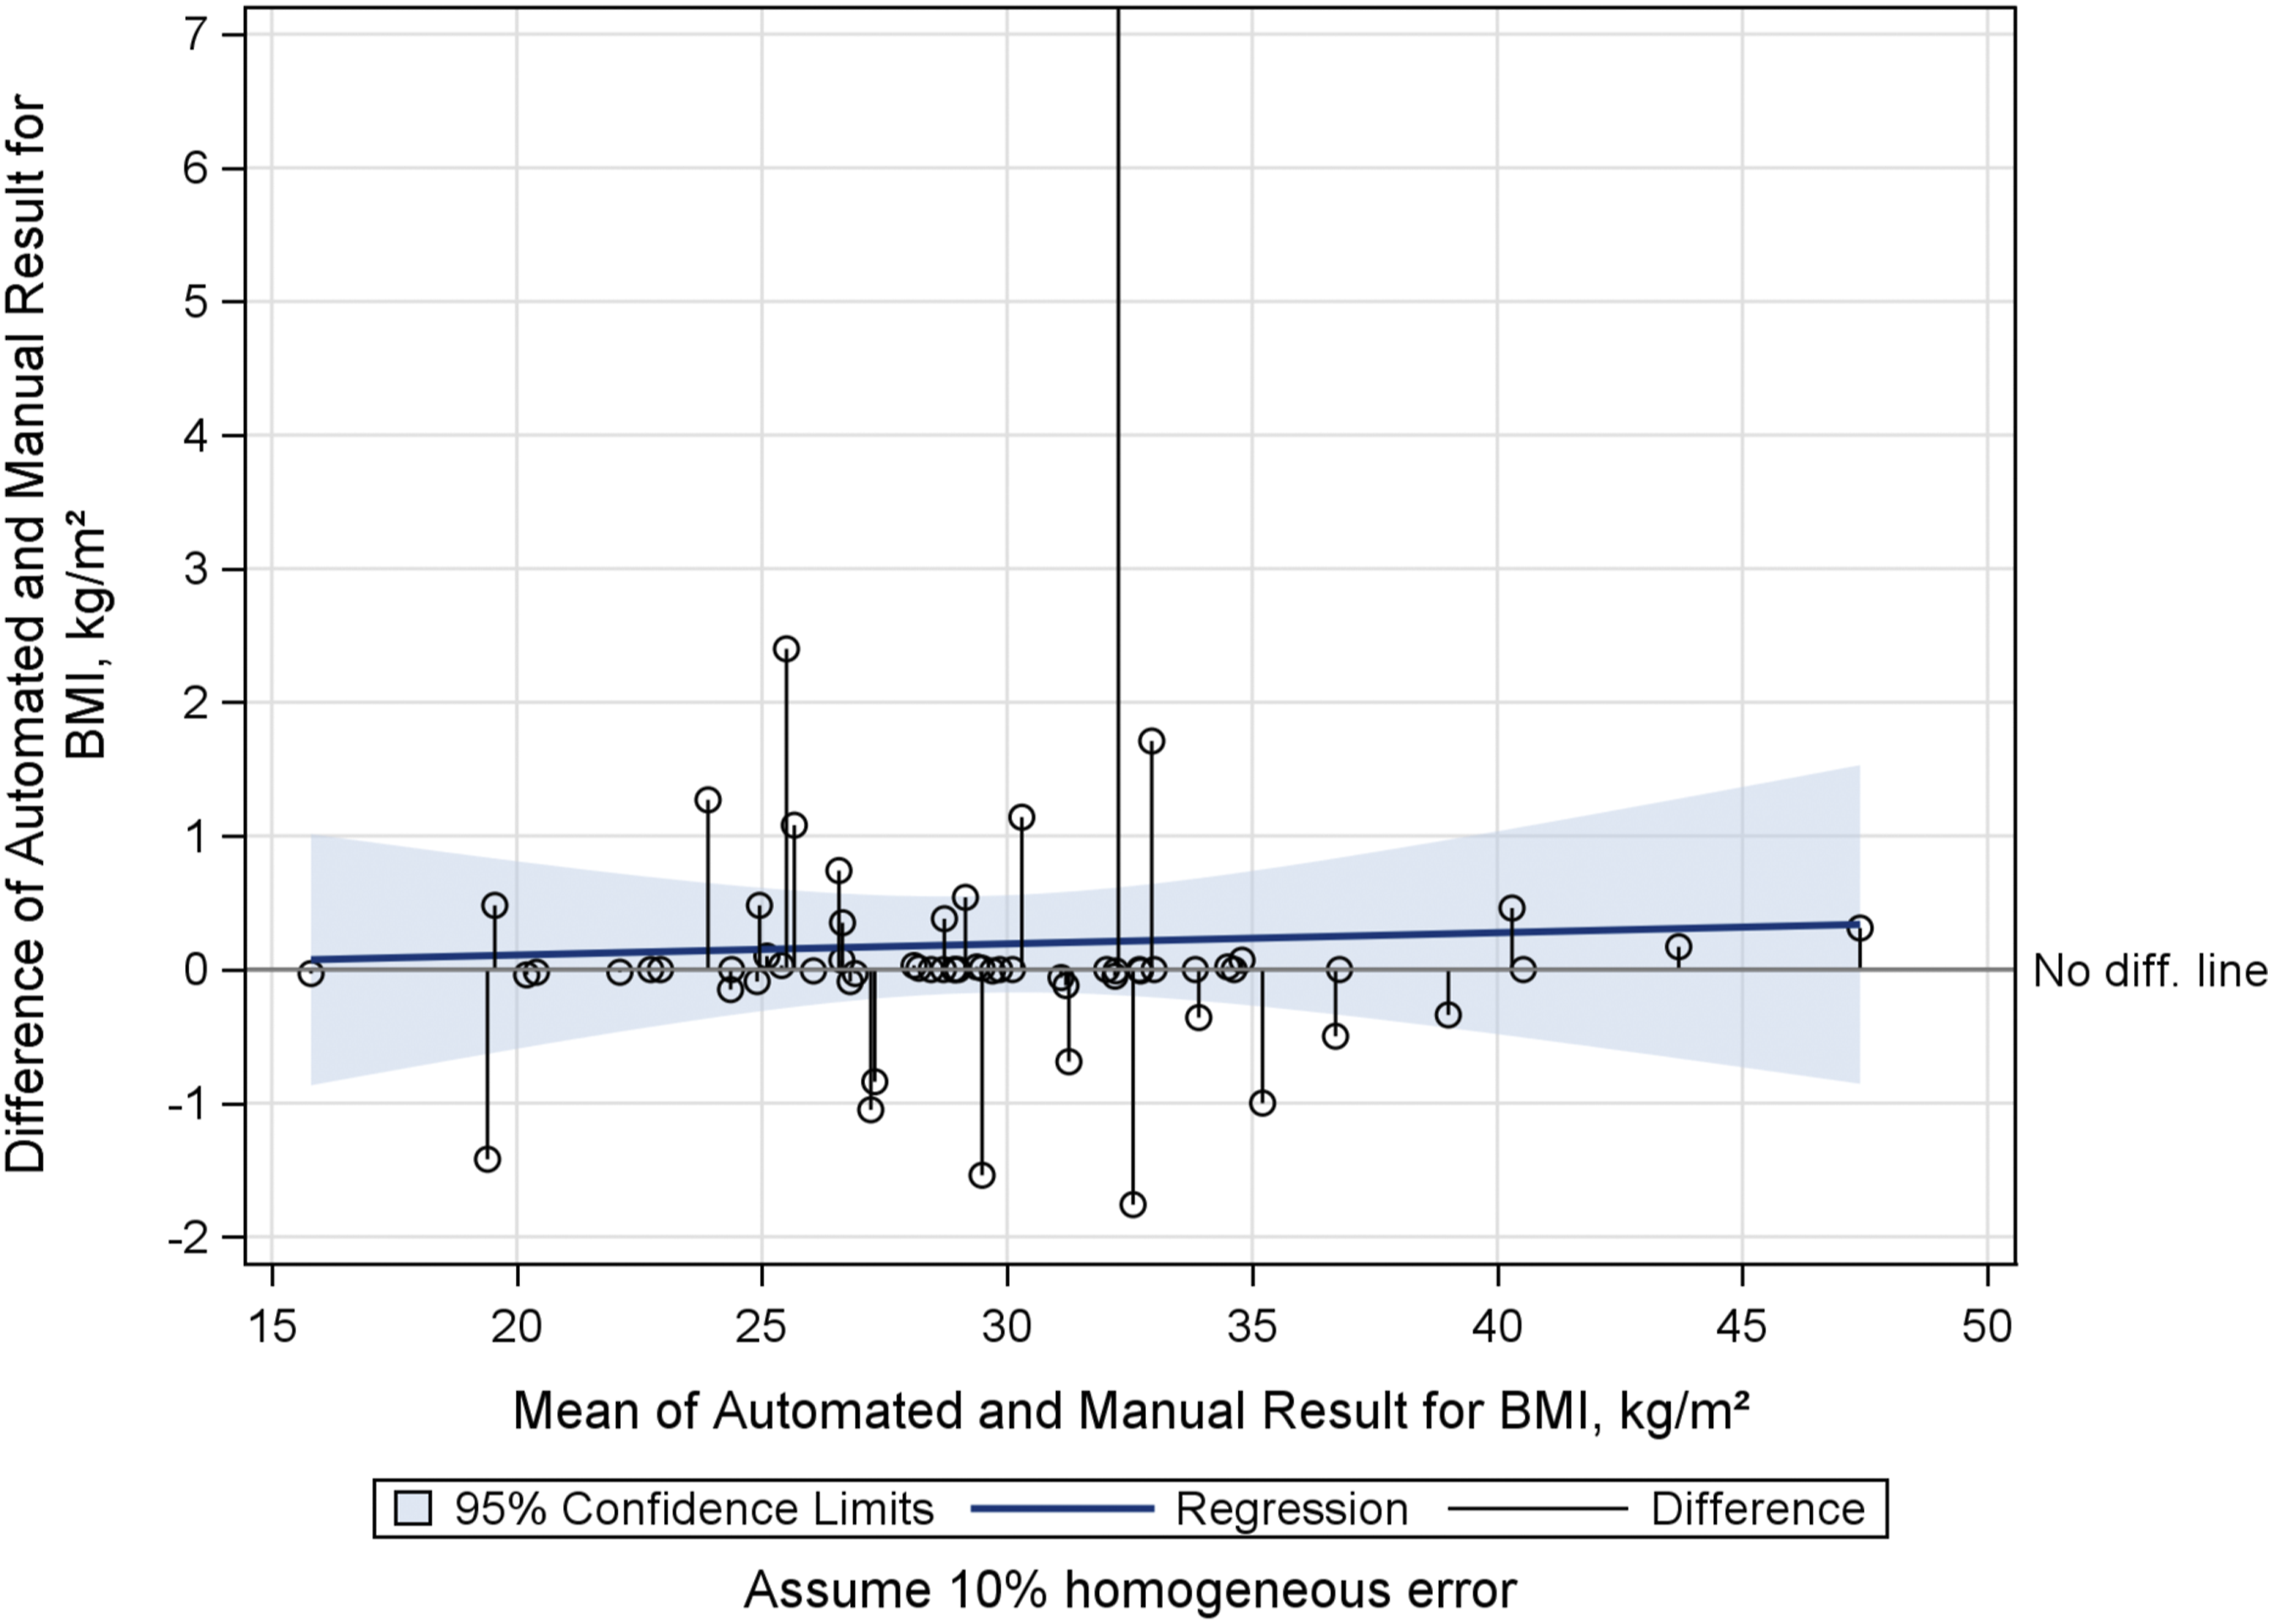
Of 66 patients whose BMI values were available from both automated and manual review within 30 days of the index procedure date, agreement was very good (PCC = 0.997, 95% CI: 0.996, 0.998). Manual review returned BMI values for 11 patients within the 30-day window that were not found by automated EHR characterization. Conversely, BMI values obtained through the automated approach within the 30-day window detected values for 6 patients that were not found by manual chart review. No systematic explanations for these differences were apparent, apart from the existence of multiple BMI values in most patients' charts (Figure 2).
Overall BMI: Bland-Altman Mean-Difference Plot.
Smoking
Overall, agreement between the automated and manual search methods for ever smokers (current and former smokers) and never smokers was good, with Cohen’s kappa >0.8. The sources show poor agreement (kappa = 0.291) on the question of which patients are missing data on smoking; the methods agreed on 3 out of 14 total missing records identified by both processes.
Cancer history
Overall agreement (average of positive, negative, and missing) between manual and automated reviews was poor for cancer history, from 23% overall agreement for patient history of colorectal cancer to 55% overall agreement for family history of any cancer. The greatest agreement between methods for cancer history was for positive family history of any cancer, at 82%, exemplifying the trend that positive history of cancer showed better agreement compared to negative history or missing history. Of note, raw results from the automated EHR characterization returned some patients with both a positive and negative history of cancer. Whereas a patient might be positive for colorectal cancer, the same patient could also be listed as negative for “cancer,” as well as negative for many other specific cancers. Thus, depending on which results were viewed after automated characterization, contradictory observations could be made about the cancer history of a patient. We assumed that indication of a positive history for a specific cancer superseded a general negative for cancer.
Chronic disease history
Statistical agreement for chronic diseases (diabetes, hypertension, and hyperlipidemia) is poor, with positive history of each disease agreeing in 37–47% of cases. Discrepancies were greatest for negative and missing history of these diseases, with agreement as low as 3% on missing data for hypertension. The automated query returned minimal data for negative history of disease, and thus agreement with manual review is very poor for negative history.
Time trends in agreement
Time trends in automated versus manual chart review agreement for age, smoking and family history: 2013 and 2016.
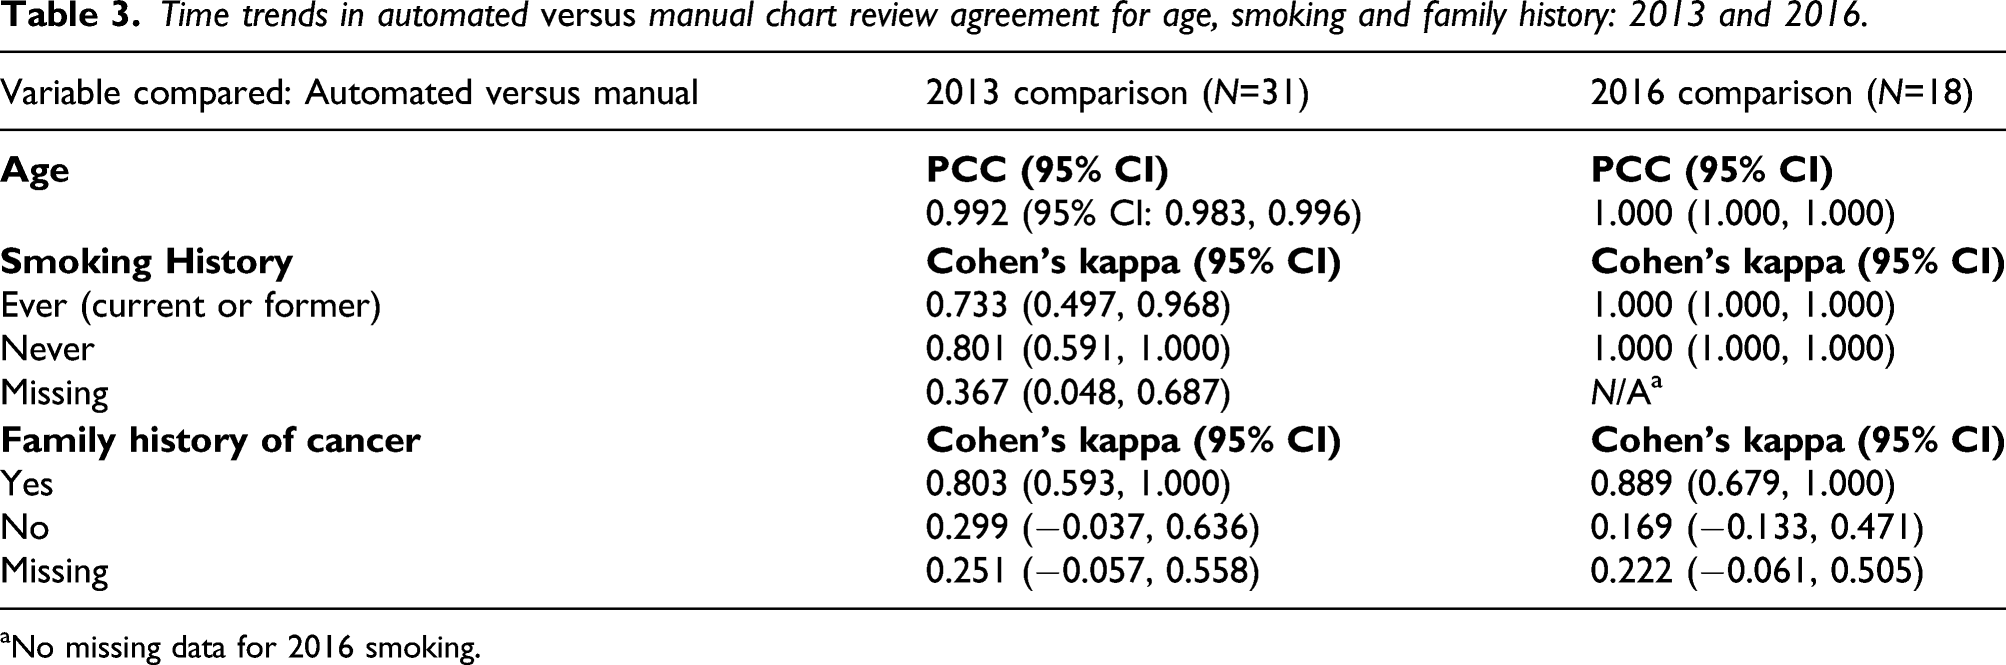
aNo missing data for 2016 smoking.
Agreement for age remained very high over time in 2013 compared to 2016 (Table 3 and Figure 3). From Table 3, agreement in smoking history improved significantly in 2016 compared to 2013, but was unchanged for family history of cancer over the same time points. Unlike smoking history, from 2013 to 2016, no statistically significant change was observed in agreement for family history of cancer. The confidence intervals, however, have shrunk in 2016.
Age in 2013: Bland-Altman Mean-Difference Plot.
Attenuation of odd ratios
We estimated a range of attenuated values, from an approximate 5% attenuation to ORs for demographic characteristics age, race, and sex, to a greater than 90% attenuation in the OR for negative patient history of colorectal cancer (Figure 4). Our data suggest potential attenuation of 11–58% in ORs for positive patient or family history of cancers and chronic disease. Attenuation of Odds Ratios at Several Values of Cohen’s Kappa. True OR increases with Kappa (2.1.4, Statistical Methods).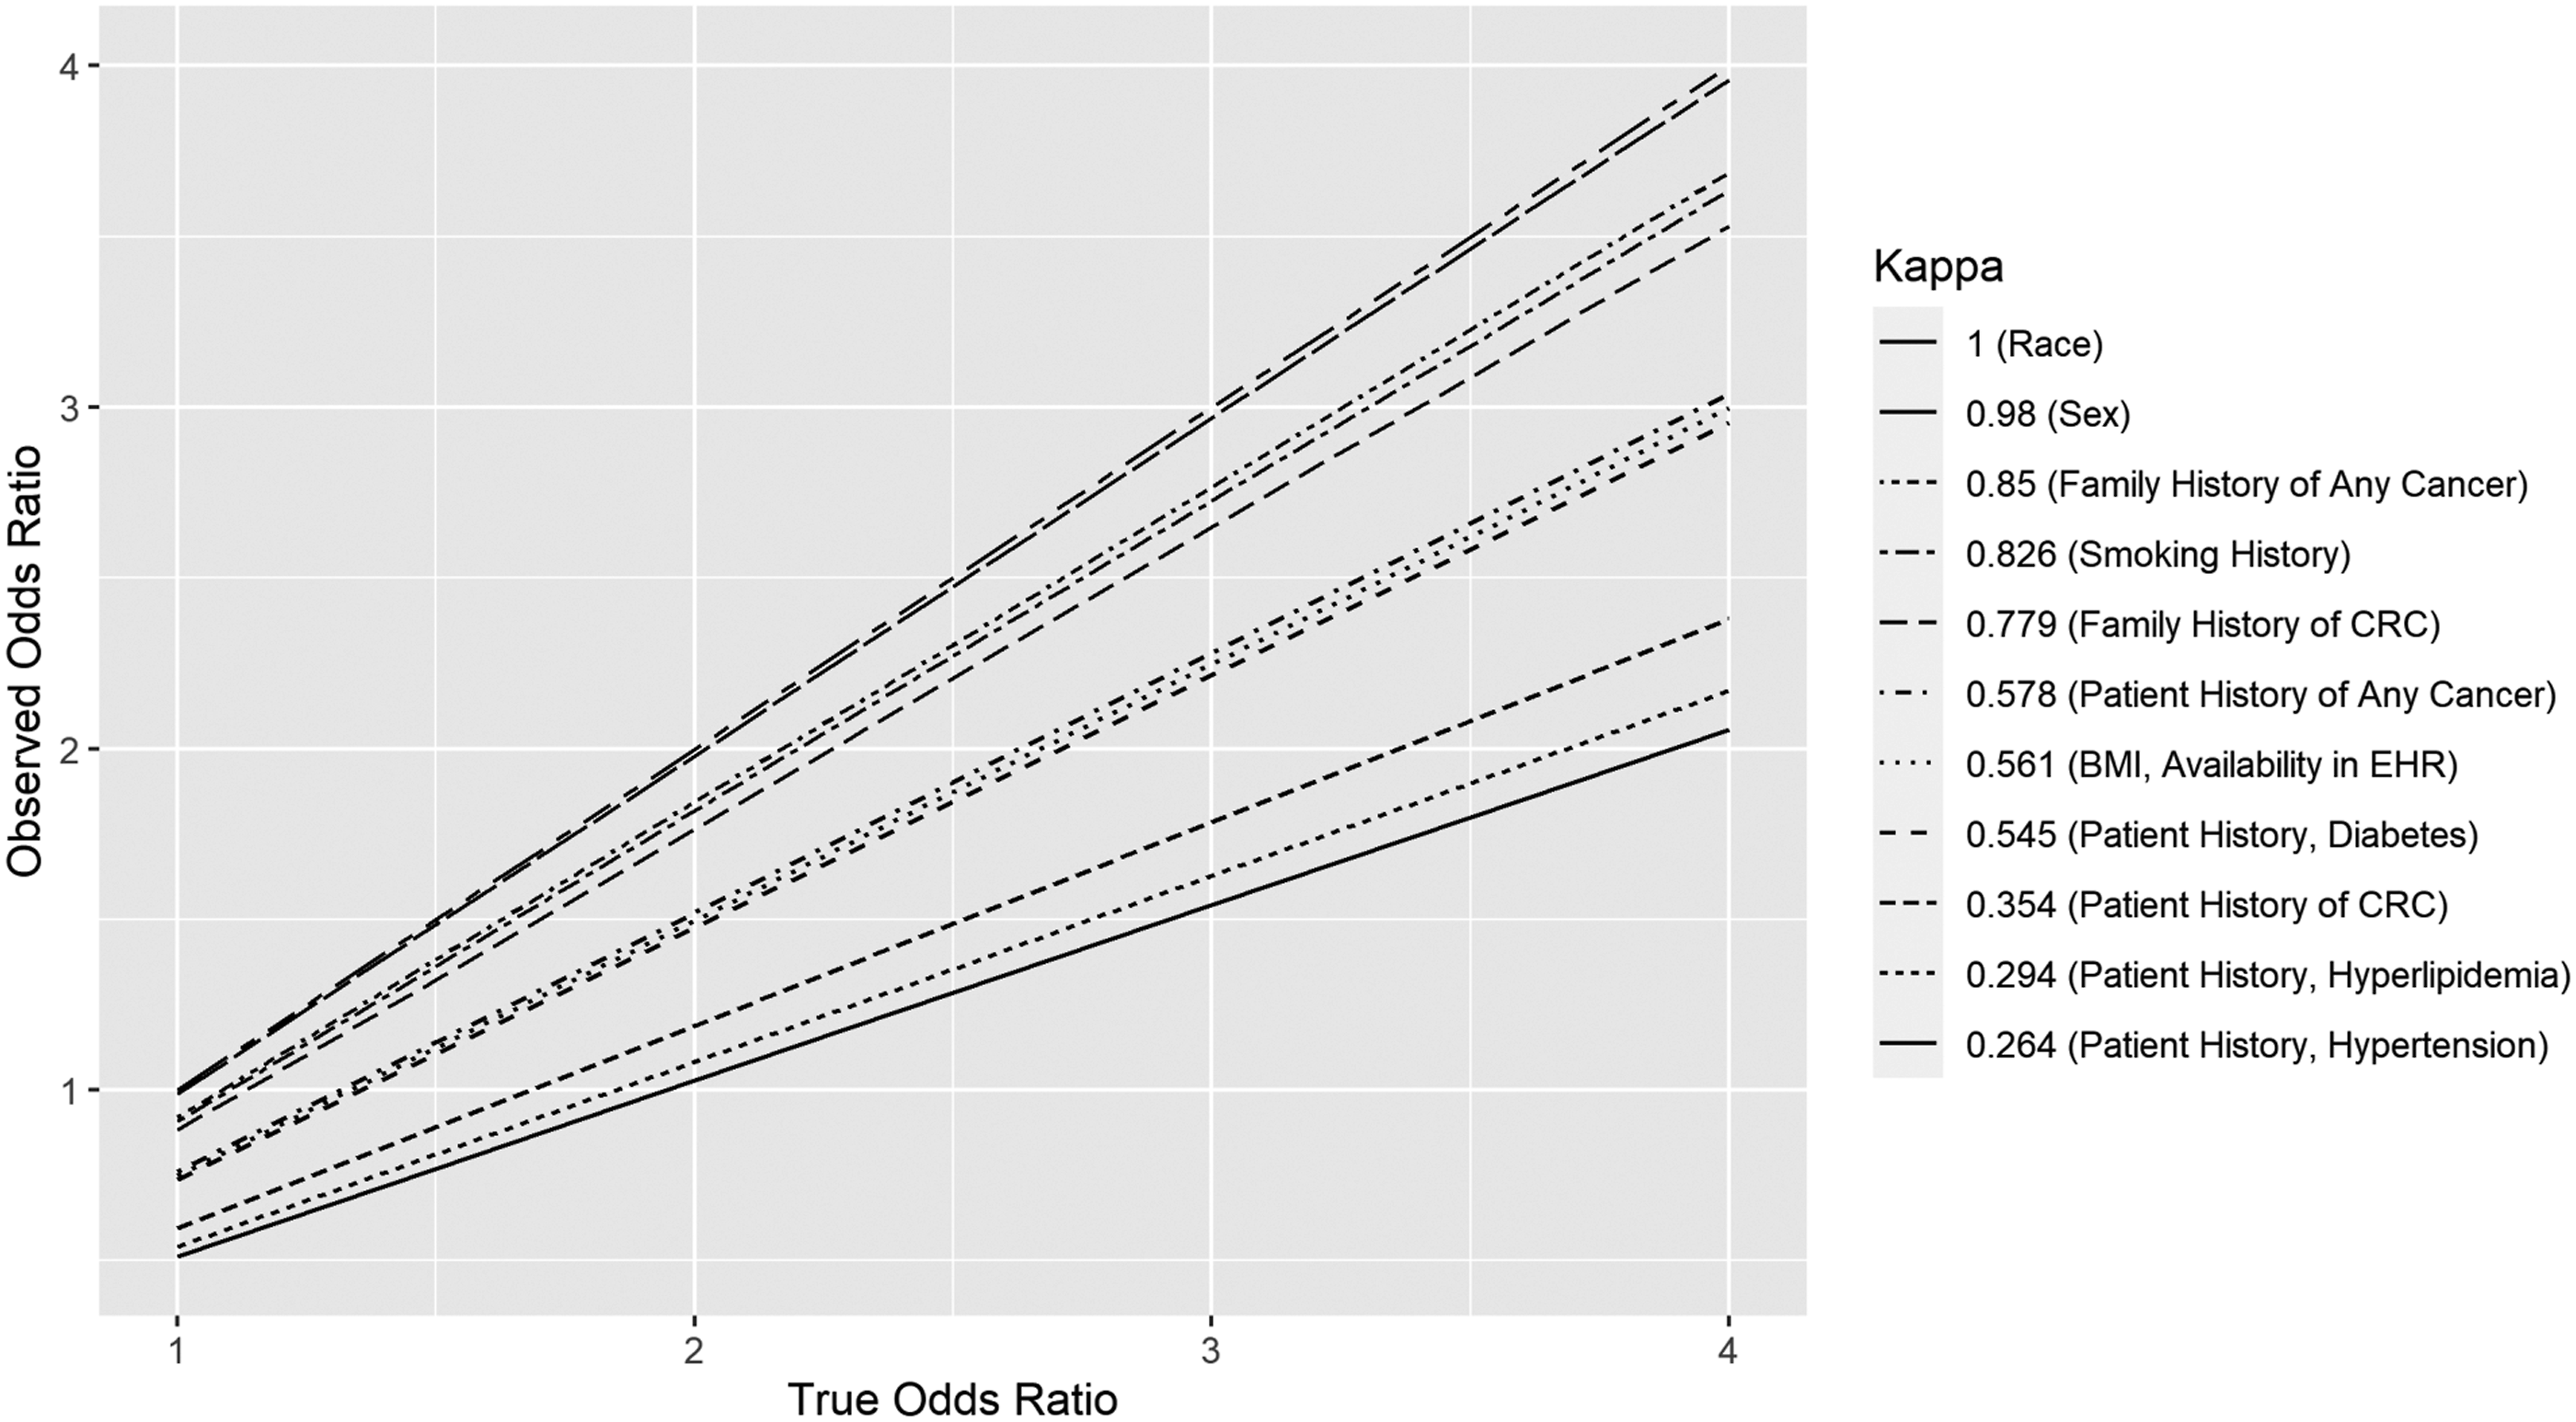
Discussion
Discrepancies between automated and manual methods may have minimal or profound impact upon the reliability of odds ratios (ORs) (Figure 4). We estimated an approximate 5% attenuation to ORs for age, race, and sex, and greater than a 90% attenuation to the OR for negative patient history of colorectal cancer. We estimated attenuation of 11%–58% in ORs for positive patient or family history of cancers and chronic disease. A recent study 25 examining the risk of venous thromboembolism in elderly, hospitalized internal medicine patients compared automated and manual abstraction techniques, finding that automatically abstracted data may be inconsistent with manual abstraction. For example, the study found that sensitivity of the automated tool to detect acute conditions (such as myocardial infarction) is “suboptimal,” but provides better agreement in sensitivity for chronic conditions, such as obesity. 25 The authors attributed the discrepancy to their EHR search algorithm, which depended largely on specific ICD codes and structured data fields. 26 Another recent study compared obstetrical EHR data obtained through automated versus manual review and also found a range of reliability. 27 The authors found good agreement for mode of delivery (i.e. vaginal vs. Caesarian), but only fair agreement for the acute conditions of vertex presentation and post-partum hemorrhage. They explain that some discrepancy could arise from the extent of interpretation made by a clinician to determine a qualitative finding such as “hemorrhage.” They further described discrepancies in reliability as a “serious limitation” to the utility of automated chart reviews and recommended that measures of reliability be reported with automatically abstracted data. 27
Both these examples and our original findings suggest that automated chart review is able to capture some EHR variables more reliably. Variables could be divided into many conceptual classes, such as acute versus chronic, 25 active problem versus historical, severity versus non-severity of condition, personal versus family history, or positive versus negative history. 28 However, not all variation in agreement between automated and manual methods is predicted by these classes. In our results and in the examples from Pavon et al. 25 and Altman et al., 27 variability seems to be best explained by the definition of structured versus unstructured data fields in the EHR, and by how meticulously and consistently the structured fields are populated by accurate ICD codes.
“Meaningful Use” and policy
EHR data quality depends upon providers, who may be influenced by both institutional EHR quality standards and Centers for Medicare and Medicaid Services (CMS) guidelines for documentation.29,30 CMS requires of its reimbursed clinicians that “specific abnormal and relevant negative findings of the examination of the affected or symptomatic body area(s) or organ system(s) should be documented” in the medical record. Additionally, “pertinent negatives” should be documented for the history of the present illness. 31 That is, pertinent negative findings are not explicitly defined by CMS, and thus compliance with CMS guidelines does not necessarily require uniformity in documentation of negative findings. Furthermore, it has been shown that clinicians may avoid obtaining or documenting a full family history for some visits. 32 Although policymakers should avoid excessive documentation requirements on clinicians, the effectiveness of meaningful use criteria for improving clinical data quality has been demonstrated, such as at Intermountain Healthcare. 33
Data quality over time
In assembling data for longitudinal cohorts, an important feature to consider is consistency in the reliability of exposures over time. 34 Noted increased agreement of automated EHR characterization and manual abstraction of smoking history between 2013 and 2016 likely reflects initiatives at our institution in the intervening period investigating techniques to help inpatients to quit smoking. These studies coincided with improved completion of smoking data in the EHR system, which was adopted for inpatients at MUSC during that time.35-37 In addition to these initiatives at MUSC, the CMS criteria for meaningful use were in place prior to 2013, and documentation of patient smoking status, in addition to age, race, sex, ethnicity, and BMI, were already of high quality. 30 In contrast to the significant improvement observed in the quality of smoking data over time as shown in Table 3, no statistically significant improvement occurred over the same interval for Age (Figure 3) or Family History of Cancer, although the point estimate of agreement for positive family history of cancer appears to be higher in 2016 with more narrow confidence intervals. The greater point estimate could be interpreted as improved agreement, but the point estimate for negative family history of cancer was lower in 2016. We conclude that age, previously a meaningful use variable recorded in a structured data field, remained at very good quality, while family history of cancer, recorded with inconsistent ICD codes or in unstructured fields in the EHR, remained at lower quality.
Limitations
Study data were obtained from a single academic health center using the Epic EHR. Manual extraction is limited by the accuracy of a human reviewer. However, we further acknowledge the limitation that a single human extractor performed the manual chart abstraction, whereas this process is more typically completed by multiple extractors. Because the study aims to identify agreement between the manual and automated sources, “Missing” was treated as an additional response category to allow meaningful interpretation. Future comparisons of manual and automated techniques should include validity controls that estimate the impact of systematic error.
Conclusion
Future work to validate these methods must keep pace with application of automated technologies to clinical epidemiological data. Use of natural language processing and machine learning is increasing in application to phenotyping of electronic health records for research.38-40 Our results indicated poor quality among chronic disease variables. Future studies may detect more chronic diseases from clinical narratives using natural language processing methodologies.
Supplemental Material
sj-pdf-1-rmm-10.1177_26320843211061287 – Supplemental Material for Assessing quality and agreement of structured data in automatic versus manual abstraction of the electronic health record for a clinical epidemiology study
Supplemental Material, sj-pdf-1-rmm-10.1177_26320843211061287 for Assessing quality and agreement of structured data in automatic versus manual abstraction of the electronic health record for a clinical epidemiology study by J Grant Brazeal, Alexander V Alekseyenko, Hong Li, Mario Fugal, Katie Kirchoff, Courtney Marsh, David N Lewin, Jennifer Wu, Jihad Obeid and Kristin Wallace in Research Methods in Medicine & Health Sciences
Footnotes
Acknowledgments
Many thanks to Kathleen Cartmell, Graham Warren, Jonathan Beall and Michael Cummings for their professional consultation.
Declaration of conflicting interests
The author(s) declared no potential conflicts of interest with respect to the research, authorship, and/or publication of this article.
Funding
The author(s) disclosed receipt of the following financial support for the research, authorship, and/or publication of this article: This study was partly funded by grants from the National Institutes of Health, National Cancer Institute (R03 CA156668, K07 CA151864, U54 CA210962) and National Library of Medicine (R01 LM012517); the Biostatistics Shared Resource, Hollings Cancer Center, Medical University of South Carolina (P30 CA138313); South Carolina Clinical and Translational Research (SCTR) Institute NIH Grant Number UL1 TR001450.
Supplemental Material
Supplementary Material for this article is available online.
References
Supplementary Material
Please find the following supplemental material available below.
For Open Access articles published under a Creative Commons License, all supplemental material carries the same license as the article it is associated with.
For non-Open Access articles published, all supplemental material carries a non-exclusive license, and permission requests for re-use of supplemental material or any part of supplemental material shall be sent directly to the copyright owner as specified in the copyright notice associated with the article.