
Abstract
Introduction:
The current ordinal fibrosis staging system for nonalcoholic steatohepatitis (NASH) has a limited dynamic range. The goal of this study was to determine if second-harmonic generated (SHG) quantifiable collagen fibrillar properties (qFP) and their derived qFibrosis score capture changes in disease progression and regression in a murine model of NASH, in which disease progression can be induced by a high fat sugar water (HFSW) diet and regression by reversal to chow diet (CD).
Methods:
DIAMOND mice were fed a CD or HFSW diet for 40 to 52 weeks. Regression related changes were studied in mice with diet reversal for 4 weeks after 48 to 60 weeks of a HFSW diet.
Results:
As expected, mice on HFSW developed steatohepatitis with stage 2 to 3 fibrosis between weeks 40 and 44. Both the collagen proportionate area and the qFibrosis score based on 15 SHG-quantified collagen fibrillar properties in humans were significantly higher in mice on HFSW for 40 to 44 weeks compared to CD fed mice. These changes were greatest in the sinusoids (Zone 2) with further increase in septal and portal fibrosis related scores between weeks 44 and 48. Diet reversal led to decrease in qFibrosis, septal thickness, and cellularity with greatest changes in Zone 2. Specific qFPs associated with progression only, regression only, or both processes were identified and categorized based on direction of fibrosis change.
Conclusion:
Complementing recent human studies, these findings support the concept that changes of disease progression and regression can be assessed using SHG-based image quantification of fibrosis related parameters.
Keywords
Introduction
Nonalcoholic fatty liver disease (NAFLD) is a major cause of liver-related morbidity and mortality. 1 NAFLD has 2 clinical-histological phenotypes: nonalcoholic fatty liver (NAFL) and nonalcoholic steatohepatitis (NASH). NASH is a more aggressive phenotype and has a higher likelihood of progression to cirrhosis. The burden of end-stage liver disease due to NASH is expected to increase 2 to 3 fold by 2030.2,3 Despite the public health significance of NASH, there are still no drugs approved for its treatment.
The hallmark of disease progression in NASH is fibrosis, which defines its proximity to cirrhosis and thus liver outcomes.4 -6 It is therefore a key endpoint for clinical trials of NASH and the preclinical assessment of drug benefits.7-10 Fibrosis is evaluated by conventional trichrome or Sirius red stains of paraffin embedded liver sections. The NASH CRN fibrosis staging system is currently the reference standard for the assessment of fibrosis improvement or deterioration.4,11,12 This method is, however, limited by a small dynamic range and the potential errors generated by ordinal classification of fibrosis severity, which extends over a continuous range.
In clinical trials of drug therapy for NASH, a large proportion of participants have unchanged histological stage based on the NASH CRN staging system, creating a challenge for interpretation of drug benefit. 13 This could be partly due to its limited dynamic range and the need for large amounts of fibrosis change in both distribution and quantity to lead to a one-stage or greater change in fibrosis. Recently, second harmonic generated-two photon excitation fluorescence (SHG/TPEF) images of unstained liver sections have allowed quantification of the physical properties of collagen fibrils.14 -17 These quantifiable collagen fibrillar properties (qFPs) track conventional fibrosis stages and have been used to develop a continuous fibrosis scale that may allow more sensitive assessment of changes in fibrosis in short term clinical trials. In a recent treatment trial of the drug tropifexor, the majority of patients demonstrated no change in conventional fibrosis states. 18 However, based on changes in the qFPs evaluated using SHG technology, many of these patients were found to have changes suggestive of either progression or regression. Whether these findings truly reflected improving or worsening fibrosis, however, could not be ascertained because additional follow up biopsies were not available.
The aim of this study was to determine if the qFPs associated with higher fibrosis stage in humans were also increased in a mouse model of NASH, in which the severity of fibrosis progression could be modulated by a high fat diet with ad lib administration of sugar water, and by diet reversal with resumption to a chow diet. We also evaluated additional histological characteristics such as septal thickness and cellularity, as well as determined the specificity of the changes associated with progression and regression in this diet induced animal model of NAFLD (DIAMOND) that has been previously validated against human disease.19,20
Methods
Animal preparation/tissue section
Ethical approval for this study was obtained from the Virginia Commonwealth University Institutional Animal Care and Use Committee (#AM10154). All animal procedures were performed according to the approved protocol and guidelines of the Institutional Animal Care and Use Committee. Diet-induced mouse model of NASH (DIAMOND) derived from mouse strains 129S1/SvImJ and C57Bl/6J were used in this study. Up to 52 weeks, male mice (n = 21) of ages 8 to 12 weeks were fed ad libitum a high fat (HF) diet, high carbohydrate diet with 42% kcal from fat and containing 0.1% cholesterol (Harlan TD.88137) with a high fructose-glucose solution (SW, 23.1 + 18.9 g/L d-glucose). 19 These mice represented the progressive disease cohort. Mice fed a HFSW for 40 to 52 weeks has been previously demonstrated to correlate with human NASH fibrosis stages 2 to 3 19 and thus was of interest for this study. Concomitantly, a cohort were fed chow diet (CD) with normal water as controls (n = 4).
In another cohort, mice were fed a high fat diet with sugar water for 48 to 60 weeks; these mice were then either euthanized or had diet reversal to CD (n = 8) and subsequently euthanized 4 weeks later. These latter mice represented the disease regression cohort (Figure 1). Mice weight, AST, ALT, bilirubin, and blood glucose were obtained as previously described (Supplemental Table 1). 21

Study Design and Timeline of Mice in Baseline, Progression, and Regression Cohorts. A total of 3 cohorts comprised of 25 mice were given different diets for various weeks. Sample size indicated at respective time points. Abbreviations: DIAMOND, diet-induced mouse model of nonalcoholic steatohepatitis.
Liver tissue samples were sliced into sections of 4 to 5 μm thickness. Unstained slides were used for SHG/TPEF imaging, while others were stained with Sirius red for histological assessment. Liver fibrosis was staged using the NASH CRN scoring system as described previously.16,21
Image acquisition
SHG/TPEF microscopy was utilized to visualize collagen properties and cell structures. Image acquisition parameters were standardized: samples were laser excited at 780 nm, SHG signals recorded at 390 nm, and TPEF signals recorded at 550 nm. Image tiles were acquired at 20× magnification with a dimension of 200 μm × 200 μm and a pixel resolution of 512 × 512. Multiple adjacent image tiles were captured to encompass the entirety of the tissue in each slide. Images were processed and evaluated by machine-learned analysis using imaging software as previously described. 14
Image quantification
The software measured collagen fibril characteristics in operator-defined regions of the liver samples. Regions included (1) general, the entire overall liver section, (2) portal tract (PT), collagen fibrils directly connected to the portal tract, (3) peri-PT or peri-portal, 100 µm circumferentially around the portal tract, (4) Zone 2, area between Zone 1 and Zone 3, (5) central vein (CV), collagen fibrils directly connected to the vein itself, and (6) peri-CV or peri-central, 100 µm circumferentially around the CV. These are aligned with the approach in human studies. 15
The collagen parameters captured quantifies individual collagen fibrils and their physical characteristics including number, area, diameter, length, width, perimeter, contour, and intersection. A total of 184 collagen morphological parameters were utilized in this study (Supplemental Table 2). These included ones initially identified from accurate fibrosis assessment in chronic hepatitis B patients and in thioacetamide-induced rats 14 as well as other parameters developed later specifically for NASH related studies. Examples of parameters include collagen fibrillar properties such as string and collagen connectivity-related measurements, and septal thickness and cellularity. Of note, collagen proportionate area (CPA) was measured separately for different regions. Defined as the total collagen area divided by total tissue area, CPA was measured in the 6 regions defined above. The calculation for qFibrosis score utilized 15 previously computer-selected parameters in human studies. Mean septal thickness and cellularity were quantified as previously described. 18
Statistical analysis
qFPs were measured in the 6 regions listed above for control mice on chow diet normal water and in the progressive and regressive cohorts. Progression was assessed from conventional histology staging and comparisons of qFPs and the qFibrosis scores in mice fed chow diet for up to 40 weeks. Absolute and relative changes in fibrosis over time on HFSW diet were compared to control mice fed CD. Progression related changes were determined from qFPs in mice fed HFSW diet for longer versus shorter durations. Finally, the fibrosis related parameters in the mice who had diet reversal for 4 weeks after 48 weeks of HFSW diet were compared to mice fed HFSW diet for this duration to evaluate changes related to disease reversal.
Absolute values for the parameters and the qFibrosis scores in controls on CD, at 48 weeks of high fat sugar water diet, and after diet-reversal were normalized into a scale of 0 to 1 and then displayed as a heatmap. Amongst the 184 parameters, 28 common parameters that were relevant for human studies were further analyzed in 5 different regions (PT, periportal, Zone 2, pericentral, and CV regions). The relative average changes in parameters in the progressive cohort were compared to chow diet cohort. For regression, mice studied after diet reversal were compared to mice that had progressed to week 48 on HFSW. These relative changes were then visualized into a heat map between a scale of 200% increase and 100% decrease. Similar cohort comparison was conducted to analyze the changes in septal area, width, and cellularity (as defined by the ratio of inflammatory cells to acellular area).
Categorizing progression- and regression-associated parameters
We identified parameters that demonstrated a significant change between fibrosis progression or regression, as defined by a 10% or more relative increase or decrease. We have previously demonstrated only 5% variance of SHG based repeated qFP measures (unpublished data). Based on this, we assigned a 10% or greater change in qFP measures to be a significant change. While there is no gold standard for a specific value that defines a clinically significant change, a 10% cut off is the most accepted practice amongst the SHG/TPEF experts and community.
Parameters meeting the criteria of significant change were categorized based on their association with fibrosis progression, regression, or both processes. Depending on their relative increase or decrease with progression or regression, parameters were separated by their correlation, either direct or inverse, to the direction of fibrosis change. Direct correlation is defined as an increase in fibrosis progression or a decrease in regression. Inverse correlation is defined as a decrease in fibrosis progression or an increase in regression. All analytical tests were using Matlab software. Wilcoxon rank sum test was used to verify the changes of collagen parameters with the statistical significance level set to P < .05.
Results
Mice and their characteristics
A total of 25 male mice were studied (Figure 1). Of these, 4 mice were maintained on chow diet with normal drinking water and served as controls. A larger cohort of 21 mice were started on a HFSW diet at 8 weeks of age. Thirteen mice were maintained on this diet for 40 to 52 weeks and studied as part of the progression cohort. Eight mice had the diet stopped after 48 to 60 weeks and returned to chow diet with normal water. As expected, mice gained weight on a HFSW diet along with development of insulin resistance and increase in circulating AST and ALT (Supplemental Table 1). Upon diet reversal, weight decreased modestly along with a decrease in AST and ALT.
Conventional Histological Assessment of Fibrosis Progression and Regression
In the disease progression cohort, between weeks 40 and 52, bridging fibrosis was evident along with sinusoidal fibrosis (Figure 2). There were also features of steatohepatitis in these mice as described before 19 (data not shown). Figure 2a shows specific examples of Sirius Red stained sections and SHG-generated images of fibrosis at various stages of the disease in the progression cohort. Fibrosis stages continued to range between F2 and F3 after diet reversal (Figure 2b).

Histological features and second harmonic generation (SHG) images of mouse liver sections at various time points during (a) fibrosis progression and (b) fibrosis regression. Mouse liver samples stained with Sirius Red to demonstrate collagen deposition and distribution. SHG/2-photon excitation fluorescence (TPEF) imaging demonstrates fibrous collagen (green) and liver parenchyma (red). Fibrosis scoring F0 to F3 assessed using NASH CRN system. (a) Diet-induced mouse model of NASH (DIAMOND) mouse fed with high fat sugar water diet for 40 to 52 weeks. (b) DIAMOND mouse fed with diet reversal with chow diet normal water for 48 to 60 weeks. Abbreviations: SHG, second harmonic generation; TPEF, 2-photon excitation fluorescence.
Differential changes in collagen quantity in various regions with fibrosis progression versus regression
The overall collagen amount was assessed from the CPA and used to determine differential changes in collagen area and distribution at these time points (Figure 3). Compared to mice on chow diet, mice on a HFSW diet for 40 to 44 weeks demonstrated a 3.75-point absolute increase, or 137% relative increase, in overall collagen area (P = .02). The collagen load significantly increased most visibly in Zone 2 compared to mice on chow diet (P = .02).

Comparing absolute changes of machine-quantified total collagen parameters in various liver regions in diet-induced NASH mice and diet-reversed mice. Quantitative fibrosis-related parameters of total collagen in various regions were obtained from second harmonic generation/2-photon excitation fluorescence imaging of mouse liver samples, and then compared. Mice fed with high fat sweet water (HFSW) diet for 40 to 44 weeks were compared to mouse fed with chow diet 24 to 40 weeks (baseline cohort). Mouse continued with HFSW diet up to 48 to 52 weeks were compared with mice consuming similar diet for 40 to 44 weeks. Upon diet reversal for 48 to 60 weeks, these mice were compared to counterparts that were fed with 48 to 52 weeks of HFSW. P-values calculated via Wilcoxon rank sum test and are indicated on figure. Abbreviations: CV, central vein; PT, portal tract.
We further confirmed this trajectory of fibrosis burden change across various regions by comparing the fibrosis burden in mice on HFSW diet for 48 to 52 weeks versus 40 to 44 weeks (Figure 3). From weeks 40 to 44 to 48 to 52, overall collagen area continued to increase, with most evident increases in periportal septal collagen and significant increase in portal septal collagen by 165% (P = .02). Zone 2 fibrosis did not change significantly during this time frame.
Compared to mice on HFSW diet for 48 to 52 weeks, mice who had diet reversal, demonstrated a decrease in overall collagen burden by 1.77 point, or 22%, (P = .03) with a greater decrease in Zone 2 that in of periportal and portal areas and with very little change in pericentral and central vein regions.
Changes in qFibrosis score with fibrosis progression
A total of 184 qFPs were measured in liver sections in mice maintained on a high fat sugar water diet for 40 to 52 weeks (progression cohort). A subset of 28 common parameters in various regions increased consistently with disease progression compared to mice on chow diet and are shown as a heat-map in Figure 4b. This collection of 28 qFPs all increased especially in the portal and peri-portal regions in mice from the progression cohort. There was also an increase in many of these qFPs in Zone 2 as well, although not to the same extent as seen in the portal and periportal areas. In contrast, the qFPs were lower around the CV and peri-central veins than that of mice on chow diet.

Heat map of changes in (a) absolute qFibrosis scores and (b) relative quantitative fibrosis-related parameters (qFPs) in various liver regions in NASH mouse fibrosis progression and fibrosis regression. qFPs in various liver regions were obtained from second harmonic generation/2-photon excitation fluorescence imaging of mouse liver samples. (a) After normalizing to a scale of 0 to 1, the absolute values of the 15 qFPs utilized for the qFibrosis score calculation as well as the qFibrosis score itself are illustrated at baseline (mouse fed 24-40 weeks of chow diet), at 48 weeks of high fat sugar water, and then at 48 weeks of diet reversal with chow diet normal water. (b) On the left, averaged relative changes of 28 qFPs in 5 different liver regions were compared between mouse fed 40 and 52 weeks of high fat sugar water (progressive cohort) and mouse fed 24 to 40 weeks of chow diet (baseline cohort). On the right, averaged relative changes of the same qFPs were compared mouse with 48 to 60 weeks of diet reversal (regressive cohort) and the progressive cohort. Relative changes were visualized on a scale of 200% increase and 100% decrease. Red represents relative increase in parameter; green represents relative decrease in parameter. Abbreviations: CV, central vein; PT, portal tract.
To further relate changes in qFPs in this mouse model, the changes in qFibrosis scores used in humans and all 15 qFPs included its calculation are demonstrated in Figure 4a. The overall qFibrosis score were higher in mice of HFSW compared to chow-fed mice. Most parameters, although not all, increased with continuation of HFSW diet. Parameters associated with the PT and periportal collagen were strongly elevated at 48 weeks of high fat sugar water diet. Following diet reversal, there was a near universal decrease in all 15 qFPs that are included in the overall qFibrosis score, demonstrating concordance between human and mice data.
Changes in qFP following diet-reversal
Absolute changes in qFibrosis scores and most parameters included in the scores’ calculation decreased upon diet reversal (Figure 4a). Although these changes did not revert to those in control CD-fed mice, decrease in qFibrosis scores were mostly driven by the decrease in portal and periportal collagen. On the other hand, parameters associated with collagen around the peri-central and CV were numerically but not significantly higher.
Relative changes in the subsets of qFPs in various regions comparing the mice with diet reversal to mice on 48 to 52 weeks of HFSW diet are illustrated in Figure 4b. The greatest and most widespread changes were seen in Zone 2 followed by periportal and portal regions. Interestingly, at these time points, there was a modest increase in qFPs in peri-central and central vein regions. This increment was most notable in the peri-central regions.
Directional specificity of qFP with progression and regression of fibrosis
Next, the qFPs that demonstrated significant change were first separated by correlation direction, either direct or inverse, to the direction of fibrosis change, then categorized based on their association with fibrosis progression only, regression only, or both processes. There was a total of 71 qFPs that were altered in both fibrosis progression and regression (Table 1). These qFPs directly increased with fibrosis progression and decreased with fibrosis regression. The distribution of these qFPs varied by region. Examples included percentage of total collagen at overall region, percentage of aggregated collagen around periportal regions, and number of strings in Zone 2. Another group of 36 parameters demonstrated significant increase during fibrosis progression. These parameters did not exhibit significant changes during regression, nevertheless. There were no qFP that exclusively decreased in fibrosis regression.
Quantitative fibrosis-related parameters (qFPs) in diet-induced NASH mouse categorized based on direct association with fibrosis progression, regression, or both.
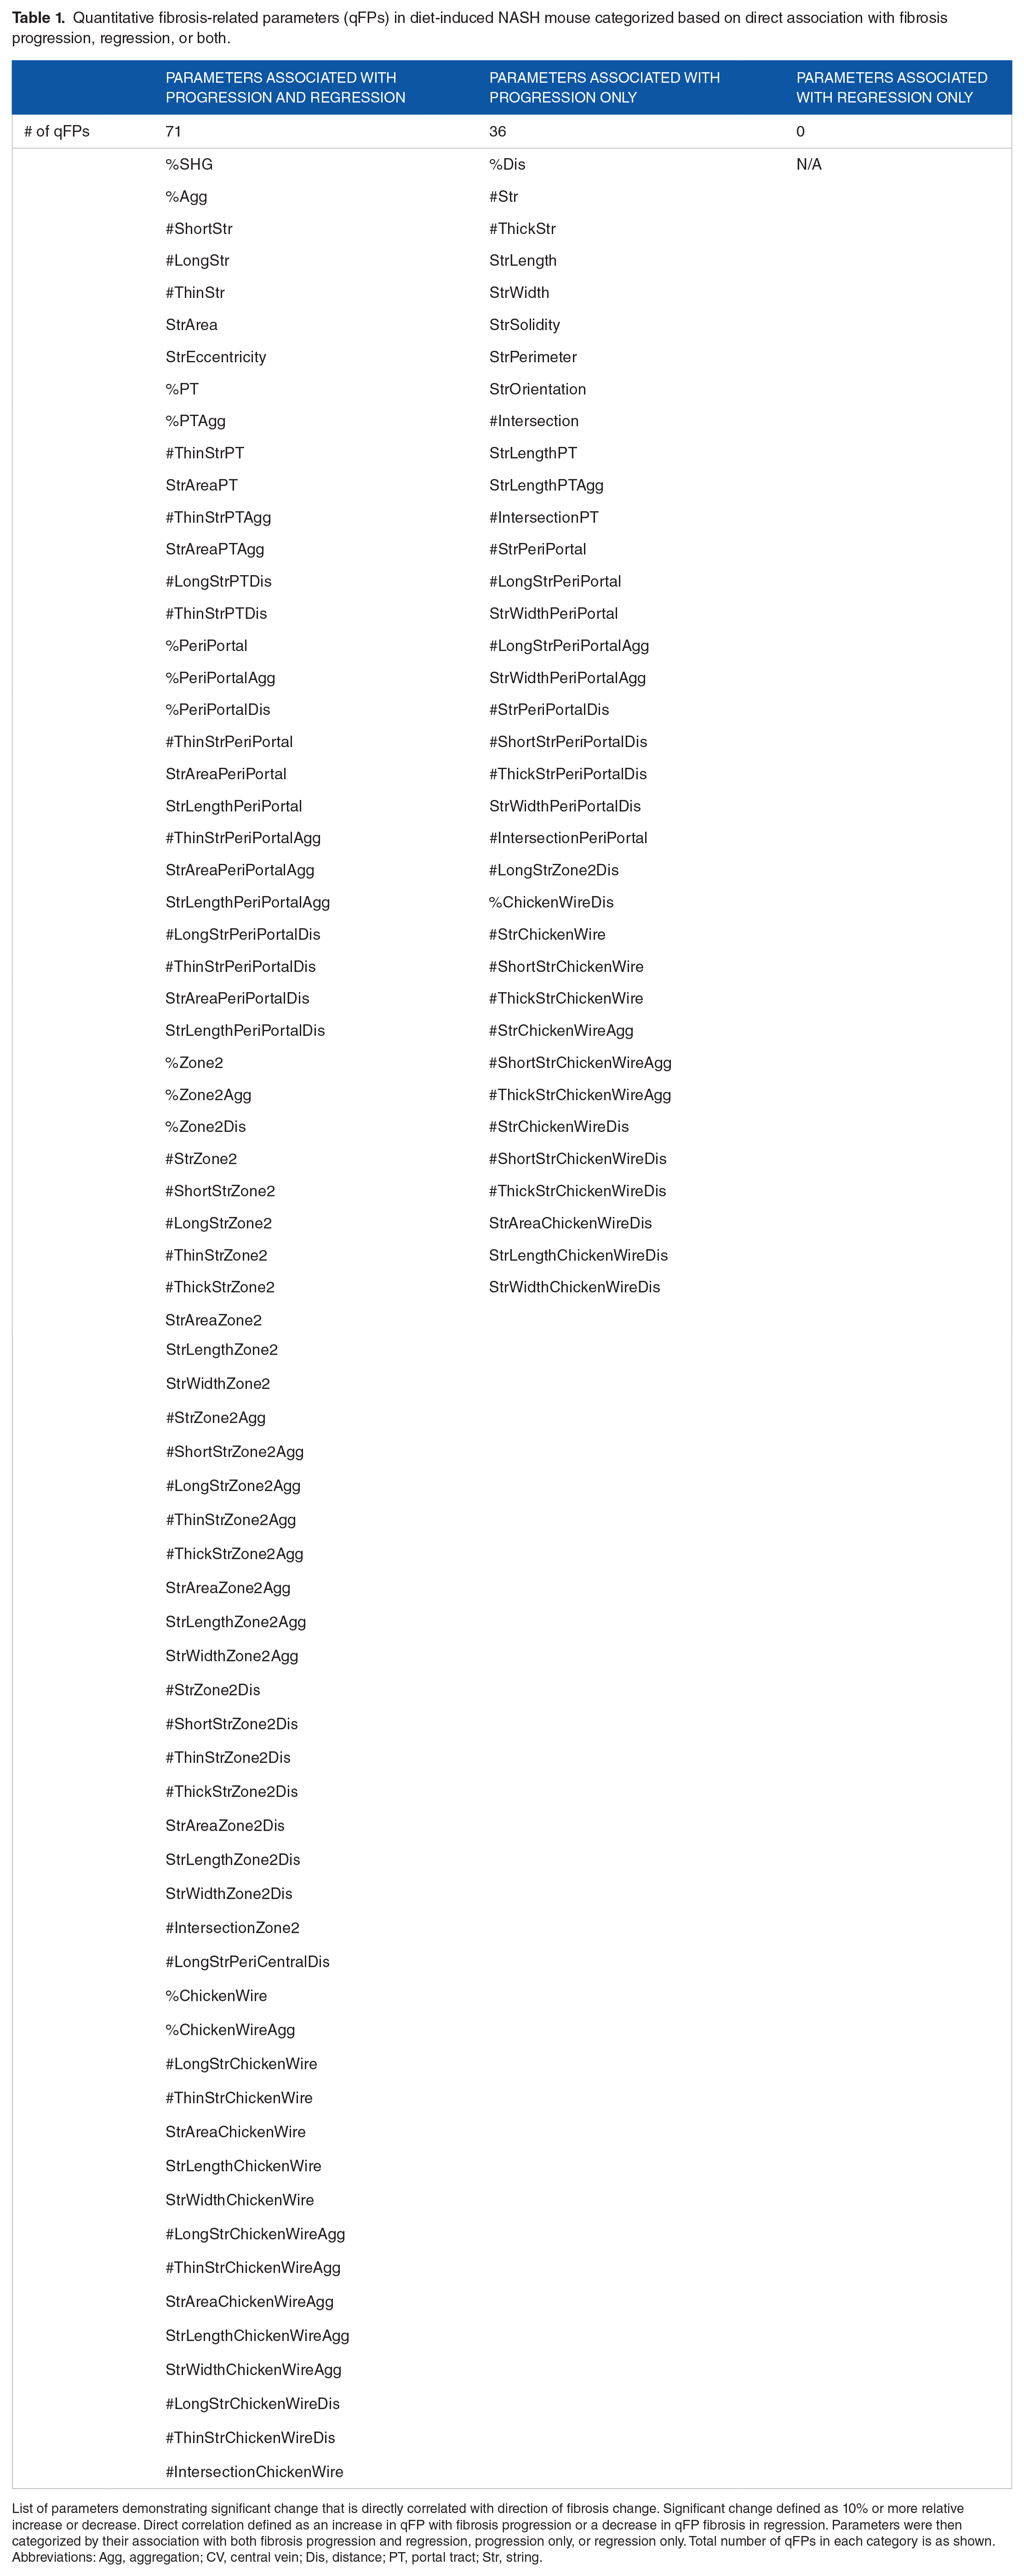
List of parameters demonstrating significant change that is directly correlated with direction of fibrosis change. Significant change defined as 10% or more relative increase or decrease. Direct correlation defined as an increase in qFP with fibrosis progression or a decrease in qFP fibrosis in regression. Parameters were then categorized by their association with both fibrosis progression and regression, progression only, or regression only. Total number of qFPs in each category is as shown. Abbreviations: Agg, aggregation; CV, central vein; Dis, distance; PT, portal tract; Str, string.
On the other hand, qFPs that demonstrated significant, inverse changes in the direction of fibrosis change were evaluated. A set of 31 parameters exhibited a significant decrease in progression and increase in regression (Table 2). Three other qFPs decreased only in fibrosis progression with no significant changes during regression, and 11 separate qFPs increased only during fibrosis regression.
Quantitative fibrosis-related parameters (qFPs) in diet-induced NASH mouse categorized based on inverse association with fibrosis progression, regression, or both.
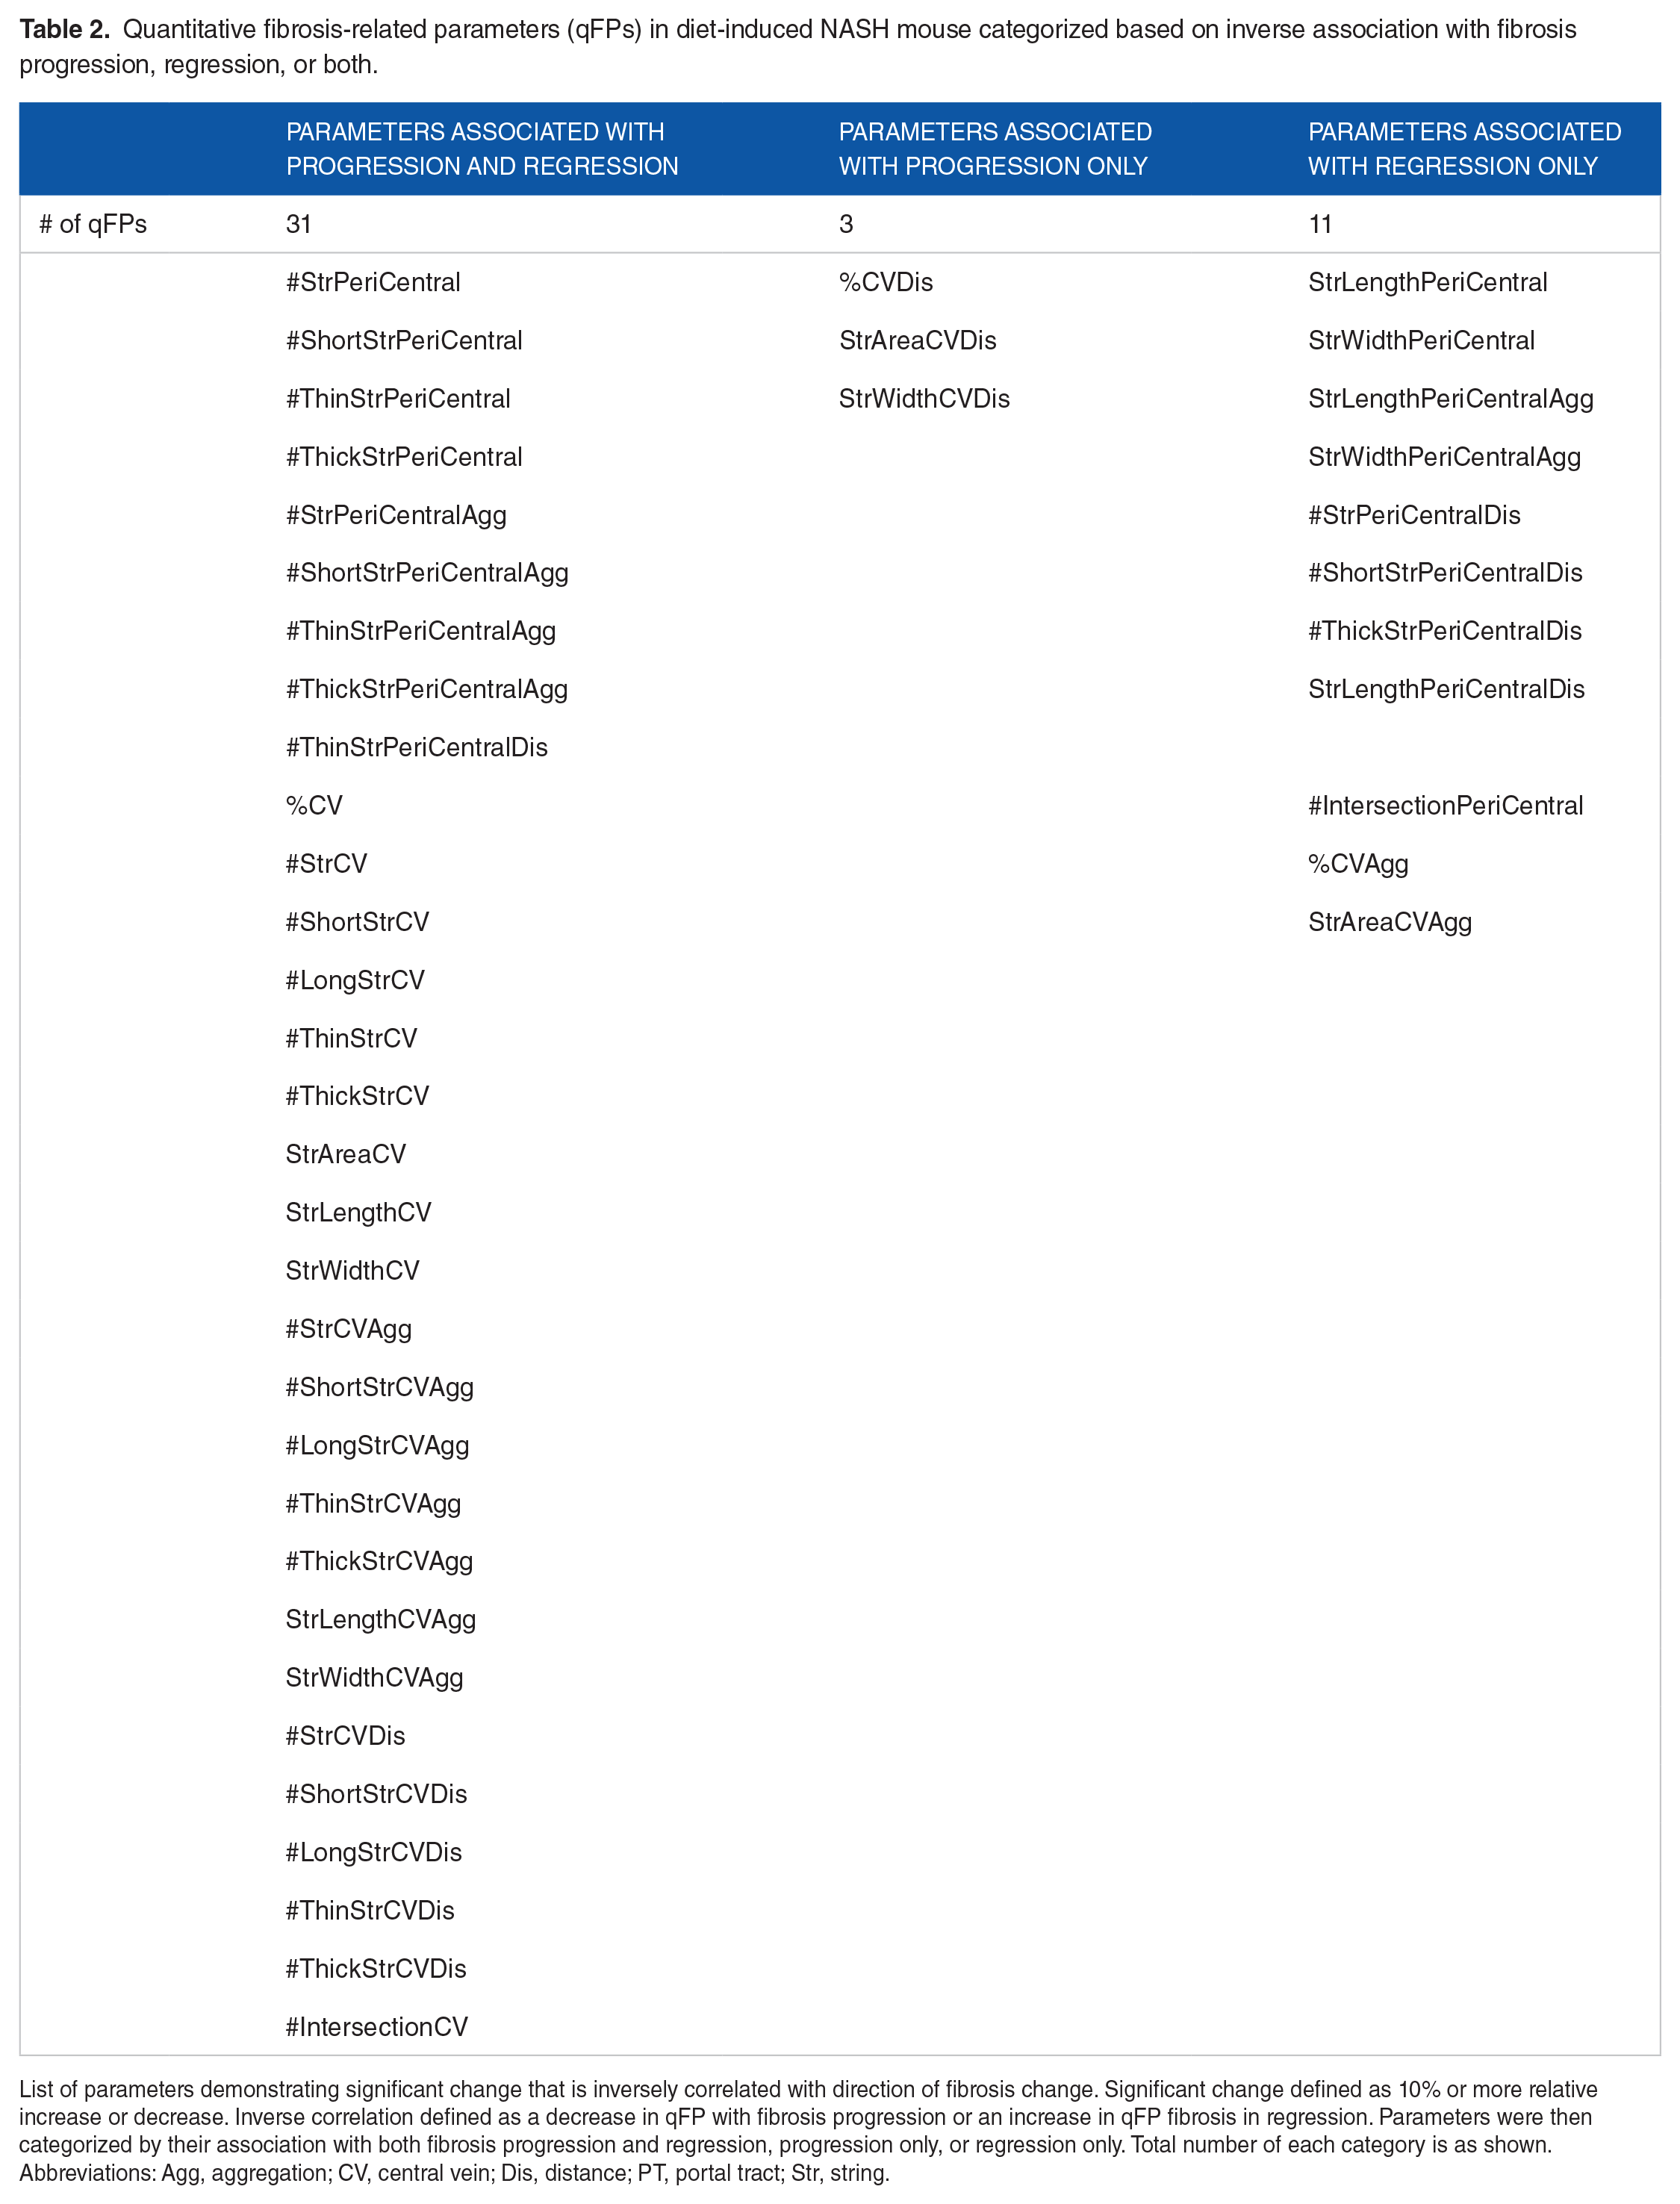
List of parameters demonstrating significant change that is inversely correlated with direction of fibrosis change. Significant change defined as 10% or more relative increase or decrease. Inverse correlation defined as a decrease in qFP with fibrosis progression or an increase in qFP fibrosis in regression. Parameters were then categorized by their association with both fibrosis progression and regression, progression only, or regression only. Total number of each category is as shown. Abbreviations: Agg, aggregation; CV, central vein; Dis, distance; PT, portal tract; Str, string.
Changes in septal area, width, and cellularity with disease progression and after diet reversal
The septal width and overall area were measured in liver sections from mice on HFSW diet for 40 to 52 weeks and compared to mouse on CD NW (Figure 5). Both septal area and mean septal width increased significantly at week 48 to 52 (P = .05 for both), but not before. Simultaneously, the cellularity of the septae (inflammatory cells/acellular area) increased to week 40 to 44 but not any further between weeks 48 and 52. However, in mice that had their diet reversed, there was a significant decrease in septal area, width, and cellularity compared to those fed HFSW diet for weeks 48 to 52 (P < .05 for all).

Changes in septal area, width, and cellularity in NASH mouse fibrosis progression and fibrosis regression. Septal area, septal width, and septal cellularity (as measured by cellular to acellular ratio) were obtained from second harmonic generation/2-photon excitation fluorescence imaging of mouse liver samples. Progressive cohort (mouse fed 40-52 weeks of high fat sugar water) was compared to baseline cohort (mouse fed 24-40 weeks of chow diet). Regressive cohort (mouse with 48-60 weeks of diet reversal) was compared to progressive cohort. Significance was demonstrated when mice on 48 to 52 weeks of high fat sugar water diet was compared to baseline, but not at 40 to 52 weeks. P-values calculated via Wilcoxon rank sum test and are indicated on figure.
Discussion
The current study demonstrates changes in multiple qFPs following a HFSW diet for 40 to 52 weeks in DIAMOND mice. These qFPs regressed upon diet reversal even at a point where a full stage fibrosis regression was not evident. There were also differential changes in different regions of the liver. Additional changes in overall mean septal area, septal width, and cellularity were noted with fibrosis progression and regression at 48 to 52 weeks. We also have previously shown increasing fibrogenic signaling with time on a HFSW diet in this model. 20 These findings provide credence to the biological relationship of these changes to fibrosis progression and regression, and support a more dynamic approach to fibrosis assessment beyond conventional ordinal staging approaches particularly in relatively short-term studies.
A critical element of this study is that progression of disease was induced by a HFSW diet similar in macronutrient consumption to that reported in the average American diet. 22 Furthermore, regression was induced by diet reversal. The induction of progression by exposure to the root cause of the disease, that is high fat and sugar intake, and regression by removal of the etiological exposures support not only the likelihood that the changes seen in the qFPs and other parameters are reflective of progression and regression, but also the interpretation of similar changes in clinical trial settings.
An important finding in this study is that the qFPs included in the qFibrosis composite score used in humans were differentially altered following 40 to 52 weeks of HFSW diet in the mice as well. These increased with progression to stage 3 fibrosis and demonstrated regressive changes upon diet reversal. The specificity of these were further corroborated by additional increments noted from weeks 40 to 44 to weeks 48 to 52. This supports the translatability of these changes from mice to humans and the construction of a model of disease evolution based on these findings.
There were, nevertheless, changes in additional qFPs across various regions. It is particularly interesting to note that there were differential changes in portal and periportal regions, especially at a time point where stage 2 to 3 disease was present. However, upon diet reversal which would be expected to decrease the lipotoxic-glucotoxic load to the liver, changes were maximal in Zone 2. In a recent human trial, 18 similar changes were noted further demonstrating that the region of fibrosis improvement is not a simple reversal of the progression from stage 3 to 2 to 1, and should be considered in the context of the mechanism of action by which the disease is reversed.
With progressive disease to stage 3, not surprisingly, septal area, width, and cellularity increased. Conversely, upon diet reversal, these decreased even when a full stage regression of fibrosis was not seen. Similar changes were recently reported in a human study, but it was not clear if this represented regression activity. 18 The current study supports the concept that these changes are reflective of early changes in regression of fibrosis related markers and could be used to assess such changes before one full stage fibrosis improvement is evident.
In the current system, one full stage or greater fibrosis regression is required for regulatory approval and hence serves as a yardstick to move therapeutic agents from phase 2B to phase 3 trials. Moreover, the European Medicines Agency requires both NASH resolution and a full stage or more regression of fibrosis even for conditional approval. 23 The logistical and financial hardships of doing large and long-term studies required to demonstrate such changes is a major barrier for therapeutic development at a time at which the burden of disease is growing. Indeed, many drugs have been considered as failed drugs based on such requirements.
Together with recent human data, the current study supports the use of SHG/TPEF imaging and quantification of qFPs and septal characteristics to complement conventional assessment of hepatic fibrosis in clinical trials, particularly in phase 2B or subpart H interim time points in phase 3 trials. These changes provide a continuous measure of various fibrosis related parameters and are sensitive to change. The current study supports the plausibility that these are reflective of changes in disease progression and regression.
As with any study, this study has limitations and several cautionary caveats. Mice models do not fully recapitulate human disease and this DIAMOND model used is no exception. Future studies will need to relate these early changes to the risk for development of cirrhosis in human trials to fully validate their clinical relevance. The studies were also relatively modest in size; however, given the effect size noted and the relationship to exposure to a high calorie, high fat, and high sugar diet, they appear to have the power and biological plausibility to provide confidence about the results and their interpretation. It would also have been ideal to further relate these changes to circulating biomarkers of fibrosis. Unfortunately, no biomarkers validated for murine models for this purpose are available. Each mouse was also euthanized on the day of liver harvest preventing longitudinal studies of blood biomarkers versus fibrosis change in the same mouse.
In summary, the current study complements recent human data and allows development of a model of fibrosis evolution with changes in fibrosis and septal parameters during progression and regression. These parameters change dynamically and differentially during progression and regression and may allow a more sensitive assessment of changes following therapeutic interventions in phase 2B and interim histological assessment of phase 3 trials for NASH. While more work is needed, this data supports the use of this model of fibrosis evolution to complement conventional approaches for assessment of fibrosis in clinical trials.
Supplemental Material
sj-docx-1-pat-10.1177_2632010X231162317 – Supplemental material for Second-Harmonic Generated Quantifiable Fibrosis Parameters Provide Signatures for Disease Progression and Regression in Nonalcoholic Fatty Liver Disease
Supplemental material, sj-docx-1-pat-10.1177_2632010X231162317 for Second-Harmonic Generated Quantifiable Fibrosis Parameters Provide Signatures for Disease Progression and Regression in Nonalcoholic Fatty Liver Disease by Nicole Ng, Dean Tai, Yayun Ren, Elaine Chng, Mulugeta Seneshaw, Faridoddin Mirshahi, Michael Idowu, Amon Asgharpour and Arun J Sanyal in Clinical Pathology
Footnotes
Acknowledgements
The authors do not have any acknowledgments to make.
Funding:
The author(s) disclosed receipt of the following financial support for the research, authorship, and/or publication of this article: This project was supported in parts by (1) NIH/NIAAA UAA026971A UH2/UH3 to Dr. Sanyal, (2) Stravitz-Sanyal Institute intramural support, and (3) Histoindex. Histoindex performed the image analysis for this study.
Declaration of Conflicting Interests:
The author(s) declared the following potential conflicts of interest with respect to the research, authorship, and/or publication of this article: Dr. Arun J Sanyal has served as a consultant to Histoindex. He has ownership interests in Genfit, Durect, Exhalenz, Tiziana, Inversago and Galmed. He has served as a consultant to Gilead, Pfizer, Merck, Novo Nordisk, Eli Lilly, Madrigal, Astra Zeneca, Bristol Myer Squibb, Intercept, Boehringer Ingelheim, Genentech, Alnylam, Regeneron, Amgen, 89 Bio, Poxel, Surrozen, Northsea Therapeutics, Blade, Akero, Hanmi, LG, Path AI. His institution has received grant funding from Intercept, Gilead, Merck, Bristol Myers Squibb, Novo Nordisk, Eli Lilly, Pfizer, Boehringer Ingelheim, Hanmi, Viking, Madrigal and Akero. The following have no conflicts of interest to report: Nicole Ng, Faridoddin Mirshahi, Mulugeta Seneshaw, Michael Idowu, Amon Asgharpour. The following are employees of Histoindex™: Dean Tai, Yayun Ren, Elaine Chng.
Author Contributions
Research Transparency and Reproducibility
Access to our research materials can be made available upon request.
Supplemental Material
Supplemental material for this article is available online.
References
Supplementary Material
Please find the following supplemental material available below.
For Open Access articles published under a Creative Commons License, all supplemental material carries the same license as the article it is associated with.
For non-Open Access articles published, all supplemental material carries a non-exclusive license, and permission requests for re-use of supplemental material or any part of supplemental material shall be sent directly to the copyright owner as specified in the copyright notice associated with the article.