
Abstract
Both India and ASEAN are characterised by dynamic market economies and have implemented extensive reforms to deepen their economic integration. Despite the existing economic links between them, this article acknowledges that the trade relations are significant but fall short of their full potential. In this context, the present study utilises a modified trade creation approach to estimate India’s export potential at the sectoral level with individual ASEAN member states for the years 2010 and 2021. The analysis has identified five most significant trading partners in the region, namely, Singapore, Thailand, Malaysia, Vietnam, Indonesia, which together represent substantial trading opportunities in the five broad sectors such as Machinery, Chemical products, Base metals, Plastics, Minerals. Additionally, this article explores ASEAN’s GVC linkages with India vis-à-vis world at an aggregate and sectoral level over the last decade. We base our analysis on the P&C using the UN Broad Economic Category (BEC) product classification, concorded with HS trade classification. The findings reveal a marginal decline in the region’s share of GVC trade with India relative to its global GVC trade.
Introduction
India’s emergence as one of the fastest-growing economies has led to its increasing integration with the world economy, particularly the East Asian region (Kumar, 2002). In 1991, the Indian government introduced comprehensive economic reforms and as part of these reforms, the ‘Look East’ Policy was announced, which later upgraded to the ‘Act East’ Policy in 2014. These policies have significantly influenced India’s economic relations with East and Southeast Asian countries, especially the 10-member Association of South East Asian Nations (ASEAN) (Das & Guha, 2022). Over the last three decades, the India-ASEAN relationship has evolved into a strong economic co-dependence, starting with a sectoral partnership in 1992 that culminated into signing of the ASEAN-India Free Trade Agreement (FTA) in goods in 2009. This integration further deepened as the India-ASEAN Comprehensive Economic Cooperation Agreement (CECA) became fully operational in July 2015, after the agreement on trade in services and investment entered into force.
The economic relationship between India and ASEAN has attracted considerable research interest, particularly in the context of trade relations. According to trade data obtained from the UN ComTrade Database (accessed using the WITS platform), it is evident that the LEP/AEP has had a substantial impact on trade outputs between India and ASEAN. Since the implementation of the LEP, bilateral trade has shown a remarkable rise, surging from US$ 2.7 billion in 1993 to US$ 133.4 billion in 2022. Further, India’s economic structure, which is predominantly service-oriented, complements ASEAN’s light manufacturing sector, which encompasses industries such as electronics, textiles, and automotive. This complementarity presents significant opportunities for mutual gain and collaboration (Asher & Sen 2005; Kumar, 2002). By leveraging each other’s strengths, India and ASEAN can enhance their prospects and strengthen their competitiveness in the global market.
ASEAN stands as a well-integrated region with deep regional trade linkages, especially within East Asian production networks (Tewari & Veeramani, 2016). The full operationalisation of the India-ASEAN CECA in 2015, following the agreement on trade in services and investments, has opened avenues for India’s integration into ASEAN’s highly integrated production networks (Nag, 2016). This integration offers India new prospects to become part of global and Regional Value Chains (RVCs), thereby enhancing its competitiveness and export potential. Despite established economic ties, this study recognises that the full potential of trade relations between India and ASEAN remains untapped. In this context, the present study endeavours to assess India’s export potential with individual ASEAN member states, taking a granular approach at the product level. We base our analysis on India’s export competitiveness, aiming to provide insights and recommendations to facilitate India’s more robust engagement with the ASEAN market.
India is keen on capitalising on the significant growth potential presented by Southeast Asian nations and reducing its import reliance on other countries, especially China (Singh, 2021). Recent scholarly literature emphasises that the integration of South Asia and East Asia could yield substantial economic benefits for both regions, particularly through deeper value chain integration. Chandra and Kumar (2010) argue that improved integration of South Asian countries with the rest of the world, particularly the East Asian region, would provide additional impetus for the growth of the South Asia region. Recent World Bank analysis (2022) also suggests that deeper integration between South Asian and Southeast Asian countries, involving tariff and non-tariff barrier liberalisation and trade facilitation, could result in substantial economic gains. Enhanced access to Southeast Asian markets for South Asian exporters not only presents new trading opportunities but also fosters participation in global value chains (GVCs). Moreover, for a country like India, which has till date not been a major player in GVCs (Nag et al., 2015; Tewari & Veeramani, 2016) but is seeing a renewed thrust on developing manufacturing capacity and incentivising FDI, these shifts present new opportunities (Chanda, 2023). In this regard, this study also aims to analyse the recent trends in ASEAN’s GVC linkages with India vis-à-vis world over the period 2011–2022. The analysis utilises the UN Broad Economic Category (BEC) product classification, providing a structured framework to identify intermediate products at a disaggregated level. The remainder of the article is structured as follows: a brief literature review in the second section, followed by the methodological approach in the third section. The fourth section presents the results, and finally, the fifth section concludes the article.
Literature Review
The current body of literature has extensively examined the implications of the ASEAN-India Free Trade Agreement (AIFTA), particularly emphasising its welfare impact and its impact on overall trade, especially trade in intermediate goods. Studies such as Athukorala (2011) have highlighted the increasing importance of regional production networks, particularly in industries like electronics, automotive, and machinery, with a focus on intermediate goods trade. This trend has played a pivotal role in connecting East Asia’s networks to global markets. For India, the imperative lies in strengthening RVCs in manufacturing, primarily through robust collaborations with ASEAN. Tewari et al. (2015) and Tewari and Veeramani (2016) highlight relatively low trade in intermediate inputs between India and ASEAN, signalling significant prospects for augmenting India’s engagement by expanding intermediate exports, especially in the machinery sector. The analysis by Mukherjee (2016) reveals that trade in intermediate inputs is increasing significantly between India and select ASEAN member states like Singapore and Malaysia in sectors such as fishing, textiles and wearing apparel and transport equipment. However, the study underscores considerable prospects for India to further its trade footprint in the ASEAN region, especially by expanding its trade in machinery items, speciality chemicals, pharmaceutical products, and telecommunication equipment. The importation of intermediate goods from ASEAN nations could potentially enhance India’s production of final goods at more competitive prices, thereby boosting its export competitiveness and overall exports (Bhattacharyya & Mandal, 2010).
Recognising the significance of ASEAN as an important trading partner, scholarly research has focused on India’s efforts to deepen its economic integration with the region through the Act East Policy, as highlighted by Banik and Kim (2020). Their study investigated the trade pattern between India and ASEAN, employing comparative advantage measures such as comparative advantage by country (CAC) and market comparative advantage (MCA). Their findings underscored certain sectors where India has the potential for competitiveness but faces obstacles due to domestic policies, impeding effective integration into ASEAN’s supply chain networks. Similarly, Chandran (2011) identified sectors and product groups exhibiting complementarities between India and ASEAN, suggesting potential areas for collaboration and trade expansion. The study highlighted sectors where India holds comparative advantage, such as food grains, minerals, chemicals, gems and jewellery, and manufactured products, while ASEAN countries exhibit strengths in electrical goods, electronic products, vegetable oils, rubber products, and agricultural products. Utilising the RCA index, Jain (2020) indicated India’s revealed comparative advantage in exporting intermediate goods to most ASEAN countries but identified a lack of such advantage in exporting capital goods, concluding that India has not fully utilised its comparative advantage in trade with ASEAN countries.
In an era where regional production networks, particularly in Asia, have witnessed a resurgence, the level of India’s integration in RVCs raises a question. To delve into this issue, Ando et al. (2022) examine the extent to which India has integrated with East Asia, focusing on machinery IPNs and ICT services. Their analysis reveals that India’s integration with East Asia, particularly in machinery IPNs, remains limited. While East Asian countries have well-established regional supply chains, India is yet to actively participate in these production networks. The study argues that by establishing stronger ties with East Asian economies, India can gain access to their well-established machinery IPNs, facilitating technology transfer, enhancing manufacturing capabilities, and fostering a more competitive industrial sector. However, several studies utilise gravity models to estimate potential trade flows between different regions (Brülhart & Kelly, 1999; Devadason & Chandran, 2019; Jagdambe & Kannan, 2020; Yang & Martinez-Zarzoso, 2014). Renjini et al. (2017) delve into agricultural trade potential between India and ASEAN, revealing trade surpassing potential in certain ASEAN countries while highlighting opportunities for further trade enhancement.
However, to the best of our knowledge, there remains a gap in studies quantifying India’s export potential with ASEAN at the product level using Viner’s modified trade creation model. Additionally, the study contributes to the analysis of GVC trade trends at the sectoral-level between ASEAN and India along with trade with rest of the world, offering insights into India’s integration into ASEAN’s production network.
Examining Trade Competitiveness: Methodological Approach
On the basis of latest trade data from the UN Comtrade database and using the modified Viner’s trade creation methodology, India’s trade potential is estimated with the 10 ASEAN countries individually at the sector level for the years 2010 and 2021.
Estimation of Export Potential: Viner’s Trade Creation
Within economic literature, the Vinerian approach (1950) holds a prominent position as a widely adopted method for assessing the competitiveness of an economy at the disaggregated product level. This framework is regarded as superior to other approaches, particularly in the examination of export competitiveness and the estimation of trade potentials, as noted by researchers such as Mohanty and Arockiasamy (2008), Kumar and Mohanty (2000), and Greenaway et al. (1989). Under the Vinerian approach, a product is categorised as trade creation when it is naturally competitive, typically due to a comparative cost advantage. Conversely, a product that lacks natural competitiveness but gains it through tariff adjustments within a preferential trade arrangement is classified as trade diversion. The cornerstone for estimating trade potential in this context lies in price competitiveness, whether it is naturally inherent or policy-induced.
Price Competitiveness
In our research methodology, we focus on estimating price competitiveness, where each product is individually evaluated at a disaggregated level, specifically at the six-digit HS classification level. This meticulous approach involves a thorough comparison of the export prices for each product group at the six-digit level originating from India with the corresponding prices offered by its competing counterparts in the destination market, which, in this case, corresponds to the ASEAN member states. In this analysis, trade potential of the
Competitive Products: Trade Creation
Let us assume that

Consider another competing supplier
For the

This is the case of the
Trade Potential
If
Suppose that

where,
Suppose that

where, á denotes the proportion of the market for the
The export potential of India (
where,
Decomposition of Potential Exports: Future and Presently Traded Products
As discussed earlier,
It is important to acknowledge a significant drawback of this approach, which lies in the omission of other factors that influence competitiveness, such as product quality and post-delivery services, among various other factors. These elements are not accounted for within the model and represent a constraint. Furthermore, this approach does not address scenarios where an Indian product exhibits global competitiveness but fails to capitalise on export potentials within a specific economy. The identification and exploration of the myriad economic and non-economic factors influencing this phenomenon extend beyond the scope of the current study. It is essential to note that international trade data can be subject to distortions, making it challenging to conduct a more precise analysis using existing databases.
Engagement of India and ASEAN in Global Value Chain
We analyse ASEAN’s GVC trade flows with India vis-à-vis world at an aggregate and sectoral levels over the period 2011–2022 in order to understand India’s participation in the ASEAN production network. While the concept of GVC has played a significant role in reshaping the landscape of global production and trade, tracking the intricate fragmentation of production and trade across various sectors has remained a challenging endeavour. Despite persistent efforts to establish a product classification that accommodates the complex production processes within GVC, using national trade statistics, progress in this regard has been limited. Discussions on the inclusion of GVC elements in the product classification began as early as the adoption of SITC Rev.1. In SITC Rev.3, some agreement was made to segregate products of the Parts and Components (P&C) sector, which was the single largest segment in the global trade of GVC. Therefore, GVC analysis can be pursued using disaggregated data for the P&C sector. Other studies have employed a similar approach to study GVC trade linkages between different trading nations/regions (Lemoine & Unal-Kesenci 2002; Mohanty, 2014a; Rahman & De, 2023).
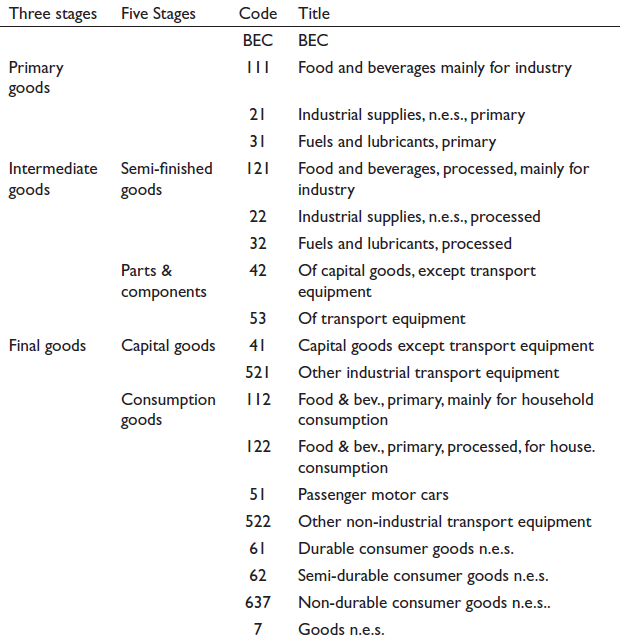
The UN BEC product classification provides a structured framework for identifying intermediate products at a highly disaggregated level. Intermediate products are categorised into two sets, encompassing semi-finished goods and P&C, based on the principal use of the products, as detailed in Appendix A. These products are concorded with the Harmonised System (HS) of trade classification to pinpoint the intermediate products used in the trade sector. For further clarity, Appendix B offers a mapping of these products between HS 2007 and BEC Rev.4. 1 Within this context, nearly 384 products at the six-digit HS classification level, primarily from capital goods, transport equipment, and the automotive sectors, are integral components of GVC. These products are distributed across nine HS sections and 15 HS chapters, with substantial trade activities occurring in sectors such as machinery and mechanical appliances, the automotive sector, and plastic products. Trade activities are comparatively limited in other sectors within the broader GVC category. This specific product classification serves as a comprehensive framework for analysing trade flows within the GVC sector.
Empirical Findings
Trends in ASEAN Trade with India and the World
ASEAN’s integration into the global economy has been remarkable in the recent decade, although it has weathered volatility due to fluctuations in the global business cycle. ASEAN total merchandise trade with the world economy registered more than 1.5-fold increase between 2011 and 2022, as evidenced in Table 1. Notably, ASEAN’s total exports surged from US$ 1.2 trillion in 2011 to US$ 2.0 trillion in 2022, while imports escalated from US$ 1.2 trillion to US$ 1.9 trillion during the same period. From 2012 to 2017, the average annual growth rates for exports and imports were 2.6% and 2.9%, respectively. The subsequent five-year period (2018–2022) exhibited robust growth, with exports expanding by 9.1% and imports by 8.9%. However, the region’s overall annual growth for exports and imports during 2011–2022 stood at 4.9% and 5.4%, respectively, despite a recessionary period, underscoring ASEAN’s resilience in maintaining trade surpluses.
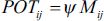
Trade Profile of ASEAN with India and the World (US$ Billion).
Bilateral trade between India and ASEAN has grown rapidly in the past few years and picked up significantly after the AIFTA came into force. From 2011 to 2022, ASEAN’s total merchandise trade with India rose from US$ 74.1 billion to US$ 113.8 billion, representing 3% of ASEAN’s total merchandise trade in 2022. Exports from ASEAN to India increased from US$ 45.7 billion to US$ 68.7 billion, comprising 3.5% of ASEAN’s total merchandise exports in 2022. On the contrary, ASEANߣs imports from India rose from US$ 28.3 billion to US$ 45.1 billion. However, ASEAN’s exports to India have grown at a faster pace than its imports from India, resulting in India’s trade deficit widening from US$ 18.7 billion in 2011 to US$ 28.8 billion in 2022, favouring ASEAN in terms of overall trade balance.
Contemporary global trade is defined by ‘global products’, manufactured across several countries at various production stages based on international division of labour. ASEAN’s trade structure predominantly centres on intermediate products, constituting nearly three-fifths of its bilateral trade with India. Notably, the share of primary goods in ASEAN’s bilateral trade with India has remained consistent at 15%–18%, while that of final goods decreased from over 26% in 2011 to around 20% in 2022. The share of intermediate products in ASEAN’s exports to India has remained stable at around 60% from 2011 to 2022. Interestingly, the share of intermediate imports from India surged from 54.4% in 2011 to 66.2% in 2022. These trends clearly indicate that ASEAN has become a very significant partner for India’s GVC trade. With these understandings and dynamics, this article investigates the ASEAN’s global trade flows and bilateral trade with India in the GVC sector recognising the evolving trade potential between India and ASEAN economies.
ASEAN’s ‘Parts and Components’ Trade with World and India
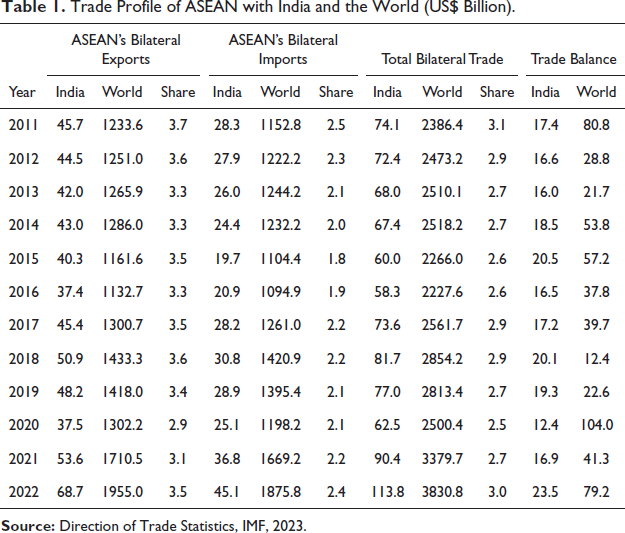
GVC exports and imports are a significant component of ASEAN’s total trade, accounting for approximately one-fourth of its total exports and imports. Over the years, the region’s share of GVC trade in its overall trade surged from 22.5% in 2011 to 32.4% in 2022. Notably, there was a substantial increase from 2018 to 2022, amounting to nearly US$ 278 billion. During different global economic regimes, the share of GVC trade in the total trade was experiencing insignificant level of fluctuations. However, the share of GVC exports in ASEAN’s total exports exhibited a remarkable increase, rising from 22% in 2011 to 26.1% in 2022, as shown in Table 2. In 2022, ASEAN exported US$ 518.7 billion worth of GVC products and imported US$ 526 billion, comprising 26.1% of ASEAN’s total exports and 27.7% of its total imports. The region’s GVC trade remained resilient during the second episode of recession (2012–2017), with GVC imports and exports recording positive compound annual growth rates (CAGRs) of 3.9% and 4.2%, respectively.
ASEAN’s GVC Trade with World: 2011–2022 (US$ Billion).
Throughout the period from 2011 to 2022, the region witnessed consistent growth in GVC trade, with imports experiencing a CAGR of 6.8% and exports achieving a positive CAGR of 6.1% over the last decade. Despite this growth, the region experienced a negative trade balance in GVC trade, with the total deficit increasing from US$ 1.4 billion in 2012 to a moderate high of US$ 7.3 billion in 2022.
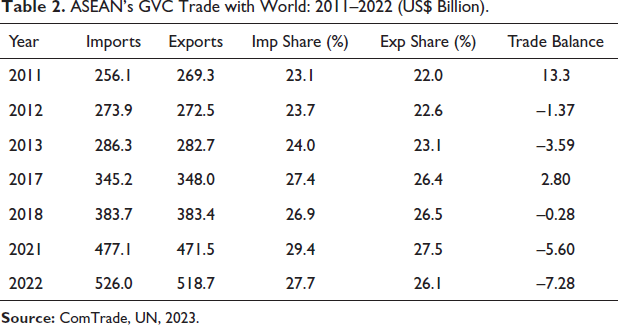
Table 3 delves into ASEAN’s sector-wise trade in P&C. It is evident that the major P&C export sectors in ASEAN include machinery and mechanical appliances, followed by Vehicles, Aircraft, and Vessels, along with Cinematography. These top three sectors accounted for 97% of total P&C exports in 2022, with the machinery and mechanical appliances sector contributing a significant 90%. The major P&C import sectors in the region mirrored the export sectors, with the top three sectors sharing 98.4% of total P&C imports in ASEAN from the world in 2022. The machinery and mechanical appliances sector dominated with a share of 90.4%. This high level of sector concentration in total P&C exports and imports was also observed in 2011.
Sectoral Trade of ASEAN in P&C with the World by HS Section (US$ Billion).
Notable changes in the composition of the export sector occurred between 2011 and 2022. While the export shares of sectors like machinery and mechanical appliances increased, those of automobiles and the cinematography sector decreased during this period. In terms of GVC import sectors, the shares of machinery imports increased from 2011 to 2022, while the import shares of automobiles and the cinematography sector declined. Furthermore, the top-performing P&C sectors in the region did not change in 2022 as compared to 2011, but the value of trade increased across all nine broad sectors. Notably, ‘plastics and articles of plastics’ and ‘optical, photographic, and cinematography’ experienced CAGR of 4.8% and 4.2%, respectively, while total trade in machinery grew at an impressive rate of 6.8% during 2011–2022.
Table 4 analyses the GVC trade linkages between ASEAN and India over the period 2011–2022. The discernible trend reveals a consistent and substantial growth in the trade of P&C between the two regions. Over the past decade, bilateral GVC imports from India surged from US$ 1.4 billion in 2011 to US$ 4.2 billion in 2022, while the corresponding bilateral exports of ASEAN increased from US$ 7.3 billion in 2011 to US$ 9.6 billion in 2022. ASEAN follows the same trade pattern with India as with the rest of the world. During the second episode of recession (2012–2017), bilateral GVC trade between India and ASEAN remained resilient. ASEAN’s GVC imports from India exhibited a healthy CAGR of 6.2%, while its GVC exports experienced a minor decline of 1.8%.
ASEAN–India GVC Trade Dynamics: 2011–2022 (US$ Billion).
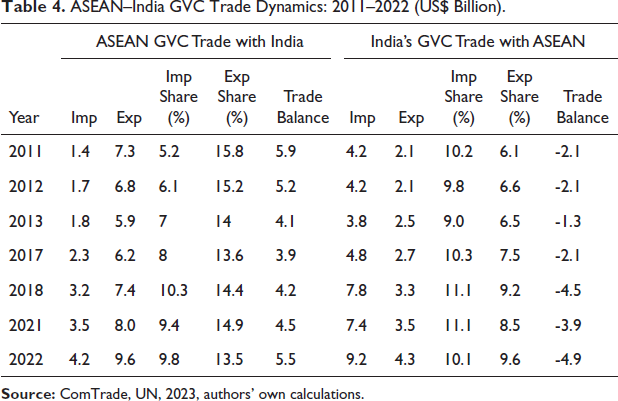
Over the last decade (2011–2022), GVC exports from ASEAN to India consistently represented around 13%–15% of their total bilateral exports to India, with the corresponding import share witnessing a significant increase from 5.2% to 9.8% in the same period. The GVC trade surplus was consistently in favour of ASEAN, although it decreased slightly from US$ 5.9 billion in 2011 to US$ 5.5 billion in 2022.
Supplementing the above analysis, it becomes imperative to examine India’s trade in P&C with ASEAN at both aggregate and sectoral levels to show the backward and forward linkages in the GVC sector between the two regions. The current pattern of India’s trade linkages with ASEAN in P&C has been one-sided. While sectoral bilateral imports from ASEAN increased from US$ 4.2 billion in 2011 to US$ 9.2 billion in 2022, the corresponding bilateral export figures of India rose from US$ 2.1 billion in 2011 to US$ 4.3 billion in 2022. This has led to asymmetry in bilateral trade, with the sectoral deficit showing robust growth during 2011–2022. However, the import share (India’s GVC imports from ASEAN as a percentage of its total imports from ASEAN) has remained consistent at around 10% during the period 2011–2022, while the export share increased from 6.1% in 2011 to 9.2% in 2022.
Examining the region’s share of GVC trade with India vis-a-vis its GVC trade with the world presents promising results, albeit with a gradual ascent. The region’s share of GVC imports from India in relation to its total GVC imports from the world increased slightly over the years, from 0.6% in 2011 to 0.8% in 2022. Interestingly, GVC exports from ASEAN to India, as a share of their total GVC exports to the world, decreased from 2.7% in 2011 to 1.9% in 2022.
Table 5 examines section-wise bilateral trade in P&C between the ASEAN region and India, offering insights into the GVC linkages across nine broad sectors. The main P&C export sectors of ASEAN to India include Machinery and Mechanical Appliances, followed by Vehicles, Aircraft, and Vessels, which collectively accounted for 96.7% of ASEAN’s total P&C exports to India in 2022. ASEAN’s imports of P&C from India were notably higher in the plastics sector compared to its exports. The major bilateral import sectors of ASEAN included ‘Machinery & Mechanical Appliances’, ‘Vehicles, Aircraft and Vessels’, with machinery alone contributing 70.6% of the total in 2022.
ASEAN–India Sectoral Trade in P&C: Comparative Analysis for 2011 and 2022 (US$ Million).
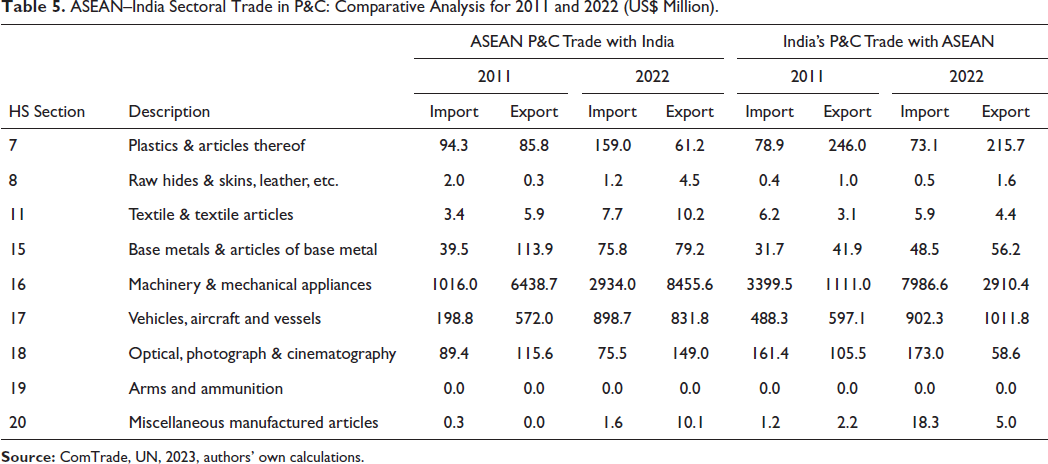
High levels of sector concentration in bilateral P&C trade between India and ASEAN were observed in both 2011 and 2022, with the major sectors remaining consistent. The share of ASEAN’s imports in the major sectors ‘Machinery & Mechanical Appliances’ and ‘Vehicles, Aircraft and Vessels’ increased marginally between 2011 and 2022. The share of ASEAN’s exports of ‘Vehicles, Aircraft and Vessels’ increased from 7.8% in 2011 to 8.7% in 2022 and the share of machinery increased from 87.8% in 2011 to 88.1% in 2022. In terms of the share of ASEAN’s imports of different P&C sub-sectors from India in relation to their global imports, there was an increase in all sub-sectors between 2011 and 2022, with the largest increase observed in automobiles followed by the base metals sector.
The similar analysis of India’s trade in P&C with ASEAN underscores the significant role played by the Machinery and Automobile sectors in the GVC linkages between the two regions. These sectors collectively represented 91.9% of India’s total P&C exports to ASEAN in 2022, marking an increase from 81% in 2011. The corresponding import share of these sectors exhibited a consistent rise, growing from 93.2% in 2011 to 96.5% in 2022. The growth figures reinforce the importance of Machinery and the Automobile sector in India’s GVC linkages with ASEAN. Specifically, the Machinery sector witnessed a notable CAGR of 10% in exports and 8.9% in imports between 2011 and 2022. Similarly, the Automobile sector recorded a CAGR of 5.4% in exports and 6.3% in imports during the same period, indicating rapid growth in trade within these sectors compared to others. These trends reinforce the existence of GVC linkages between India and ASEAN.
In terms of CAGR, ASEAN’s imports of P&C from India in all sectors were moderate, with ‘miscellaneous manufactured articles’ and ‘vehicles, aircraft and vessels’ sectors experiencing a nearly five-fold increase between 2011 and 2022. Meanwhile, the growth of ASEAN exports of P&C to India was steady across all sectors, with the ‘miscellaneous manufactured articles’ sector registering the most significant increase, closely followed by ‘raw hides and skins, leather’. Other sectors also demonstrated gradual growth, with growth rates ranging from 2% to 5%. Furthermore, the literature on GVC suggests that India is strengthening its production linkages with countries such as Malaysia (e.g., electronics), Thailand (e.g., automobiles), Singapore (e.g., digital and financial services), among others (Sudan, 2022).
Measuring India’s Export Potential in ASEAN Market
Trade creation is the outcome of relative competitiveness of the exporting country with suppliers in the export destination of a product as discussed in the methodology section. In this section, we have presented the export potential of commodities which are currently exported to the market and those which can be exported to the destination country at a later stage. Therefore, India’s trade potential in a partner country’s market is the sum of trade potentials of products which are exported at present and those products which are likely to be exported in future to the export destination.
The estimated potential exports have been kept at a conservative level by assumption in order to achieve the target in the medium term. Otherwise, the actual potential in Viner’s sense could be many times higher than what is presented in the study. It is assumed in the present study that in case of detection of an inefficient supplier in a member country’s market with respect to a potential member exporter, only 5% of the current supplies of the inefficient supplier would be treated as export potential of the exporting country, whereas Viner assumed that 100% of inefficient supplier’s export would be treated as export potential of the member exporter.
Illustrated in Table 6, India’s trade creation is estimated for the 10 ASEAN countries individually for the years 2010 and 2021. The ASEAN region offers significant trade potential for the Indian economy, reached US$ 648.4 billion in 2021, a substantial increase from US$ 323.6 billion in 2010. It may be noted that total potential is composed of two components. The first element pertains to the trade potential of products which are already being traded with the partner country (in this case, an ASEAN nation) amounting to approximately US$ 550 billion. This constitutes 85% of the total potential in 2021, a significant increase from 67% in 2010. The second element refers to trade potential of those which are to be traded in future, totalling US$ 98.4 billion, equivalent to 15% of the total. This represents a decline from 33% in 2010. This suggests that India has diversified its trade basket with the region over the years, now engaging in trade with the ASEAN region in products that were not traded before.
India’s Export Potential in ASEAN: A Comparative Analysis for the Years 2010 and 2021 (US$ Million).
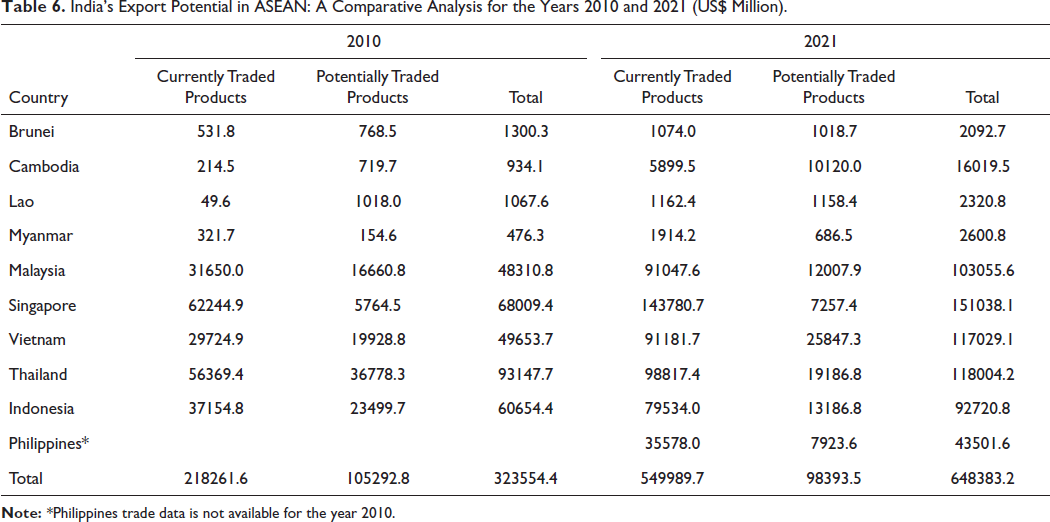
Table 6 presents estimates of export potential for India in 10 ASEAN countries. These countries can be broadly categorised into three groups based on the levels of trade potential India can generate in these markets: (a) those with a high level of trade potential, (b) those with a medium level, and (c) those with a low level of trade potential. Among the group with high trade potential, four countries (Singapore, Thailand, Vietnam, Malaysia) account for 75.4% of the total export potential, a slight decrease from 80% in 2010. The middle-level group, represented by Indonesia and the Philippines, holds a share of 21%, while the low-level group (Cambodia, Myanmar, Lao PDR, Brunei) exhibits 3.6% of the region’s total export potential in 2021, an increase from 1.2% in 2010. Among these 10 ASEAN countries, Singapore emerges as the destination with India’s largest trade potential, constituting 23.3% of the total in 2021 (a slight increase from 21% in 2010). It covers 26.1% of present trade potential and 7.6% of future trade potential in 2021 (compared to 28.5% and 5.5% in 2010, respectively). Thailand follows, constituting 18.2% of the total trade potential in 2021, a significant decline from 28.8% in 2010. It covers 18% of present trade potential and 19.5% of future trade potential in 2021, representing a significant drop from 25.8% and 34.9% in 2010. This suggests a faster expansion of India’s trade with Thailand compared to other ASEAN countries between 2010 and 2021. Additionally, it’s noteworthy that all ASEAN countries exhibit positive trade potential growth (CAGR) between 2010 and 2021. Cambodia and Myanmar lead in growth rates, registering 30% and 17%, respectively, although their share in the total export potential is less than 2.5% in both years.
India’s Sectoral Trade Potential in ASEAN Market
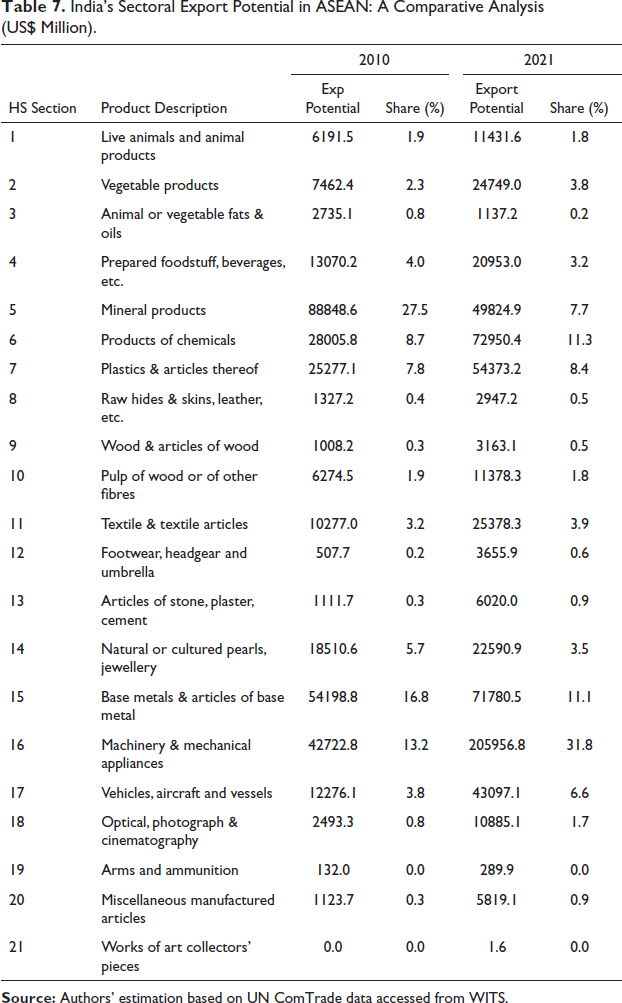
An analysis of sectoral export potential between 2010 and 2021, as presented in Table 7, reveals some noteworthy trends in the distribution of export potential across sectors. Significantly, the mineral sector held a dominant position, constituting 27.5% of the total export potential in 2010, but its share declined to 7.7% in 2021. The rising demand for industrial raw materials and intermediates in the ASEAN domestic market could be the determining factor for the expected growth of exports from this sector. Moreover, India with its abundant natural resources and technological capabilities is well-equipped to harness these rich reserves. Besides mineral sector, India’s major export interests lie in the manufacturing sector, including machinery and mechanical appliances, base metals, and chemical products, among others. More than three-fourth of India’s bilateral export potential falls within this sector, increasing from approximately 63% in 2010 to 83% in 2021. The machinery and appliances sector, in particular, holds the largest potential demand for export, constituting about 32% in 2021—a significant rise from 13.2% in 2010. Other promising sectors with potential market share in ASEAN include plastics, textiles, and the automobiles. Additionally, certain products within the agricultural sector, such as vegetable products and prepared food, present promising opportunities in the ASEAN market. Together, these agricultural sectors have the potential to contribute approximately 9% to potential exports, with a combined access to additional export value of US$ 58.3 billion in 2021— marking a significant increase from around US$ 30 billion in 2010. However, it is crucial to note that India’s export potential is concentrated in specific sectors, with nearly five major sectors expected to contribute approximately 70% of India’s total potential exports in the medium term. Most of these sectors fall within the manufacturing sector, excluding the mineral sector.
India’s Sectoral Export Potential in ASEAN: A Comparative Analysis (US$ Million).
India’s Trade Potential at the Sectoral and at the Country Level
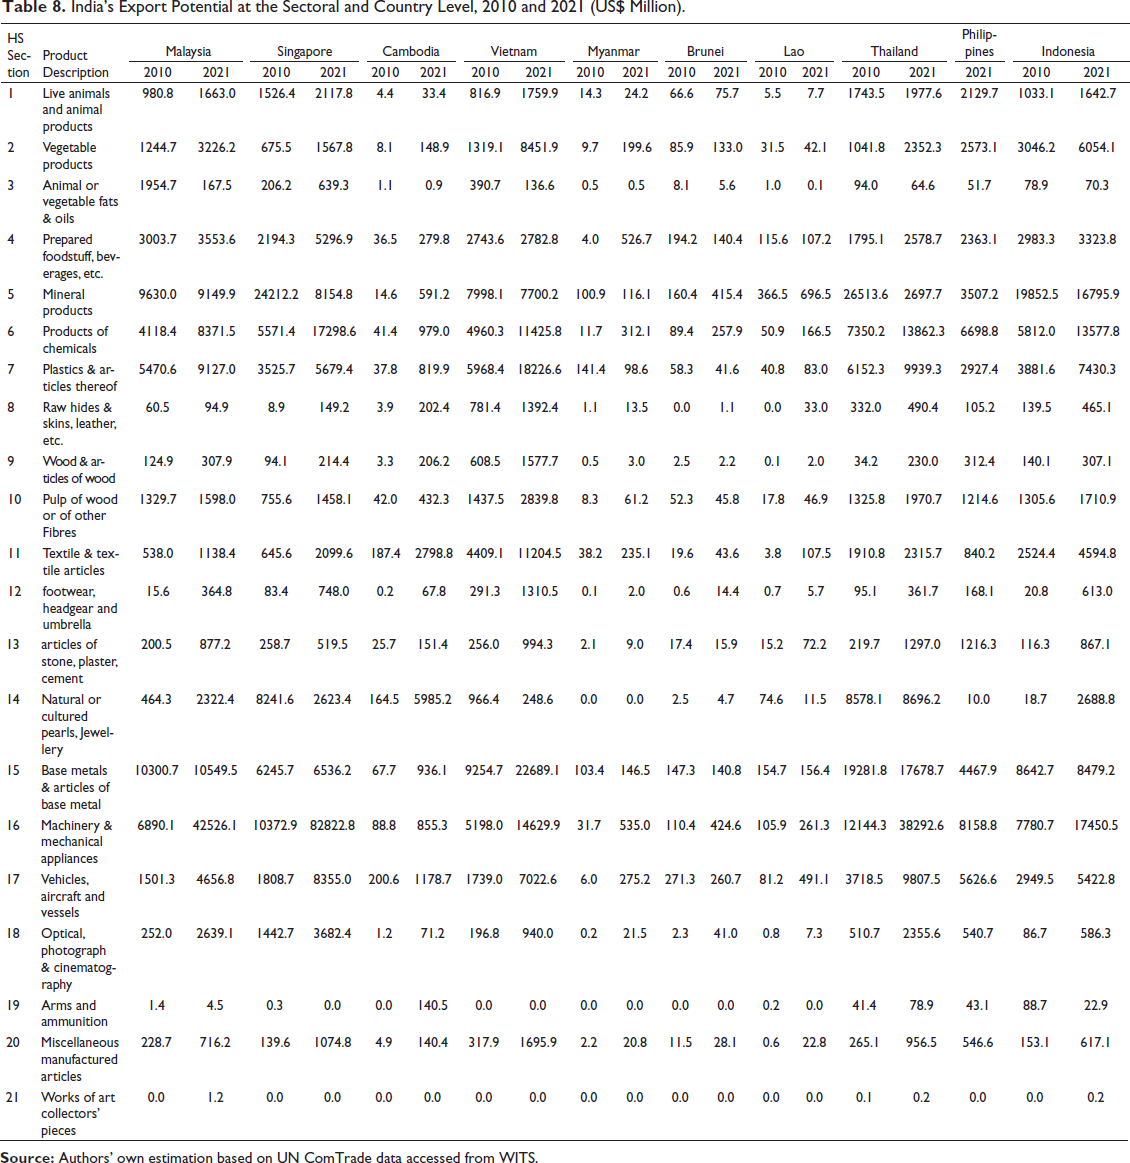
A more detailed analysis of trade creation at the sectoral and country levels is outlined in Table 8, revealing several intriguing insights. In the key sector of Machinery and Appliances, Thailand, Singapore, and Malaysia collectively account for around 79.5% of India’s total export potential with the ASEAN region in 2021, representing a notable increase from 68.8% in 2010. Similarly, in the crucial sector of Chemical Products, Singapore, Indonesia, and Thailand collectively contribute nearly 61.3% of India’s total export potential with the region in this sector—a modest decline from 66.9% in 2010. Furthermore, in the sector of Base Metals, Vietnam, Thailand, and Malaysia share approximately 71% of India’s export potential with the region in both 2010 and 2021. These countries are identified as India’s most significant trading partners in the region, representing substantial trade opportunities. Therefore, by focusing on the five ASEAN countries (Singapore, Thailand, Malaysia, Vietnam, Indonesia) and five HS sections (Machinery, Chemical products, Base metals, Plastics, Minerals), India can harness around 65% of its export potential in the region based on the trade dynamics between India and ASEAN in 2021. It is noteworthy that these five countries and these sectors constituted around 73.3% of India’s total export potential in 2010. Over the years, India’s trade with these five countries has experienced substantial growth across the mentioned sectors, resulting in a slightly reduced trade potential share in 2021 compared to 2010. This shift is a natural outcome, reflecting the increased trade volume between India and these ASEAN countries.
India’s Export Potential at the Sectoral and Country Level, 2010 and 2021 (US$ Million).
In summary, ASEAN heavily relies on the imports of P&C to sustain its export sector, with several countries and regions emerging as dominant suppliers to ASEAN. In this intricate process, India currently plays a relatively small role, as reflected in its share of P&C in ASEAN’s global GVC trade, which stood at around 1.3% in 2022. This suggests a vast potential for India and ASEAN to engage in GVC trade. Machinery and Automobiles are the key sectors that India could focus on to have greater access to the ASEAN market in the P&C sector. The machinery sector exhibits the largest export potential in 2021 and occupies a significant portion of the total GVC trade between India and ASEAN. Similarly, the automobile sector has experienced an increased share in the total export potential between 2010 and 2021, securing the second position in the overall GVC trade between the two regions, following the Machinery sector. Other promising sectors with potential market share in ASEAN include plastics, base metals, and cinematography products.
Conclusion
When India and ASEAN are set to review the existing FTA in goods, the possibility of India increasing its market access in the ASEAN regional economies has attracted traction. This study is an attempt to analyse India’s trade prospects in the ASEAN region, with a specific focus on the country’s export competitiveness and augmenting its market share in the ASEAN member states. Departing from the conventional Viner’s trade creation model, our study adopts a modified trade creation model to estimate India’s export competitiveness, considering ground realities prevailing in the global economy. In this analysis, the volume of increased trade resulting from a product’s competitive cost advantage is considered as trade creation. Our findings reveal that ASEAN stands as a pivotal market for India, yet the country’s export potential remains inadequately realised to the tune of US$ 648.4 billion in 2021. The manufacturing sector harbours substantial untapped trade potential, particularly in the machinery and appliances sector (HS 16) and the chemical products category (HS 6). The trade potential India has with the ASEAN countries will be of interest to the policymakers for influencing its future direction of trade.
Analysis of ASEAN’s GVC trade with India reveals significant potential for India to strengthen its production linkages with the ASEAN countries. Notably, the region’s share of GVC trade with India in relation to its total GVC trade with the world saw a marginal decline from 1.7% in 2011 to 1.3% in 2022. India’s bilateral GVC imports from ASEAN not only influence its bilateral exports to the region but also facilitate trade with other markets. However, GVC trade between India and ASEAN is concentrated in a few sectors, namely, ‘Machinery & Mechanical Appliances’, ‘Vehicles, Aircraft and Vessels’, and ‘Optical, Photographic, and Cinematography’ and India seeks to diversify its trade basket and achieve greater market access in the region. To leverage the full potential of GVCs and fortify trade engagements, India must prioritise several strategic imperatives. This includes empowering small and medium enterprises, fostering productivity, intensifying its involvement in the trade sector, leveraging technology for enhancement, and forging close collaborations with Transnational Corporations (TNCs). The unexplored potential of GVCs represents a promising avenue for advancing trade relations between India and ASEAN in the foreseeable future.
Appendix A: BEC Classification
The Broad Economic Categories (BEC) classification of the United Nations reorganises the Standard International Trade Classification (SITC, Rev. 3) headings, primarily based on the principal use of the products. It converts international trade data into broad categories, namely primary goods, intermediate goods and final goods, aligning with the conventions used in the System of National Accounts (SNA). In this study on India-ASEAN trade, BEC categories are aggregated as following:
Footnotes
Acknowledgement
Authors are grateful to anonymous referee of the journals for useful comments. Views are authors’ own. Usual disclaimers apply.
Declaration of Conflicting Interests
The authors declared no potential conflicts of interest with respect to the research, authorship and/or publication of this article.
Funding
The authors received no financial support for the research, authorship and/or publication of this article.