
Abstract
This study attempts to find the impacting instruments of export competitiveness for India and China by utilizing the revealed comparative advantage index and panel data regression during 2001–2020. The top 10 product groups at HS two-digit level were selected for analysis in the sample economies. The results revealed that random effect analysis remained more significant than the fixed effect for these economies. The random effect analysis showed that the top positively impacting variables with a high magnitude for Chinese export competitiveness are foreign direct investment (FDI) and research and development (R&D), followed by relative export prices (REP). The wage rate is the only factor that remained negative in magnitude for China. On the other hand, India tried to absorb FDI toward making the domestic market strong along with R&D, which has significantly impacted its growing competitiveness in the global market. REP negatively impacted Indian competitiveness with a high magnitude, followed by the real effective exchange rate. China has remained entirely integrated with the international market through joint ventures and multi-national companies and has promoted its exports in an improved form in the global market as compared to India. Moreover, China remained quite active in promoting the competitiveness of its manufactured product lines through investing in R&D and gross fixed capital formation, which contributed a significant part to its export competitiveness. In contrast, such investments remained relatively unresponsive for India.
Introduction
International trade has played an essential role since times for the growth of world economies. The economies of India and China remained quite active in their trade performance and contributed a diverse range of products in large quantities to the international market (Clydesdale, 2016). Trade has been regarded as the driver of economic growth. However, a more significant share of exports is favorable for a strong economy, and to achieve that the country needs to be competitive in the international market. Therefore, it has been a central area of research to access the determining factors contributing to global economies’ competitiveness. Like many other developing economies, China and India, the world’s largest emerging economies, took a step forward in grouping up with the global trading market when they started liberalizing their respective economies in 1978 and 1991, respectively. Since then, these countries have performed well in their economic activities and caught the world’s attention. However, China has aggressively promoted its products and has been more competitive than India. Chinese manufacturing has outpaced the world’s most developed nations, and India is not far behind. The Chinese-manufactured product lines have demonstrated their competitive edge over the other rival products worldwide (Li, 2018).
The export competitiveness of any industry is determined by its ability to sell a product in a specific time period in the international market while balancing the price and quality with the people’s consumption needs (ITC, 2016). Therefore, production efficiency and technological proficiency have to be ensured. China has developed an edge over India in both aspects. India’s manufacturing sector has not demonstrated a parallel improvement with China over the past few decades. However, India’s growth will remain immature without a competitive manufacturing sector to boost its economy.
There are numerous research studies on export competitiveness in the global economies, including Enright et al. (1999), Pillania (2009), Ganai and Sarin (2020), and Ganai and Bhat (2021). These have mainly studied export competitiveness at country levels. Similarly, at the industry level, export competitiveness was studied by Mitchell et al. (1993), Alon and Fetscherin (2007), Fetscherin et al. (2010), and Alon et al. (2011). At the firm level, researchers who analyzed export competitiveness include Salomon and Shaver (2005), Batra and Khan (2005), Pillania (2006), Yip et al. (2006), Srivastava (2006), and Ganai et al. (2022). However, most of these empirical studies are related to only a few aspects of export competitiveness. There is limited research on determining factors of export competitiveness of Indian manufacturing along with another fastest emerging economy in the world, China.
Therefore, this study attempts to fill the research gap and measures the impact of various variables on the export competitiveness of Indian and Chinese manufactured products after China’s accession to WTO from 2001 to 2020.
Theoretical Links for Determining Factors of Export Competitiveness
Export competitiveness is a risky and costly process involving large infrastructure investments, research and development (R&D), technical know-how, and close interaction with innovative institutes (Zhang, 2015). Empirical evidence suggests that the export competitiveness of any nation includes several variables such as labor cost, physical and human capital, quality infrastructure, R&D expenditure, and technological expertise. The increase in physical capital, however, depends upon an economy’s gross fixed capital formation (GFCF). Therefore, this study uses GFCF, which provides the share of physical capital used by these said economies to promote their economic infrastructure available for production processes. To assess the labor cost and cost-effectiveness of exports, the annual wage rate per worker in the total manufacturing sector has been used as one of the determining variables for the export competitiveness of manufactured product lines of India and China in the world market.
Similarly, the technology of an economy and the capacity to produce depends on the availability and efficiency of infrastructure in that economy. It mainly includes roads, communication setups, and ports that allow the exports to access different global markets. Without such facilities, the economy becomes isolated from the world market and remains restricted to the domestic economy (Limao & Venables, 2001; Radelet & Sachs, 1998). Here, we used mobile phone subscriptions per 100 people as a proxy variable for communicational infrastructure setup following Muratoglu and Muratoglu (2016), due to the nonavailability of relevant data on various infrastructure components.
The internal technological support provided by large investments or expenditures in the R&D process further determines the export quality and quantity of an economy. Such efforts lead to innovations and better technical progress. These new innovative products help in driving the export share in the international market (Guarascio et al., 2015). This study also followed the same criterion and used R&D expenditure share in the gross domestic product (GDP) to assess its impact on the competitive positioning of the manufactured exports from India and China in the global market.
A nation’s trade, exports, and foreign direct investment (FDI) are closely linked. FDI generates employment and makes possible requirements for an economy to grow along with the generation of high technological aspects, which include production techniques, marketing, information and communication, and skills and promotion of exports (Rivera-Batiz & Oliva, 2003). FDI also transfers technologies due to the spillover effect. By using a cheap labor force and raw materials of the recipient nation, the expansion of exports begins to show a dynamic comparative advantage in the recipient nation (Zhang, 2015). The recipient economies also use FDI inflow as a tool to drive competitiveness among the national firms. However, this positive effect may be offset by the presence of foreign firms in the market that threaten national firms’ growth and crowd them out (Nachum et al., 2000). In this analysis, sector-specific data on FDI net inflow to countries have been used to assess its impact on the export competitiveness of India and China. The variable, thus, would be the share of net FDI inflow to the manufacturing output of India and China.
Another variable that plays an imperative role in the export competitiveness of developing economies is the real effective exchange rate (REER). The overvalued currency is detrimental to export growth in foreign markets. As per the Trade Development Index Report, 2005, a 1% currency depreciation can lead to an average of a 6%–10% increase in exports in foreign markets. It, therefore, reflects the importance of foreign exchange on the external competitiveness of a nation. In this study, REER is taken as another determining variable for export competitiveness in manufactured product lines for both countries.
The other important variable that needs to be considered is the relative export prices (REPs) which would determine the price and export competitiveness of these economies in the world market. Therefore, to determine which economy is price competitive, the REP of manufacturing exports is also analyzed as another determining variable.
From the above discussion on theoretical links, a total of seven independent variables determining the export competitiveness of a nation have been selected for this study, which include FDI inflow, R&D expenditure out of GDP, REER, REP, cellular mobile subscription per 100 people (CM), annual wage rates per labor, and gross fixed capital formation (GFCF). FDI, R&D, GFCF, REER, REP, and wage rate have been taken on a real basis with the base year of 2010.
Data and Methods
The data for this study come from various sources, 1 as below.
United Nations Conference on Trade and Development, United Nations Industrial Development Organization, World Integrated Trade Solution, UNCOMTRADE, a repository of United Nations International Trade Statistics Database, and Reserve Bank of India.
The study period for the study was 2001–2020. The product groups have been taken as per the harmonized system of two-digit classification of international trade. The research methods used in the study are described below.
Revealed Comparative Advantage (RCA) Index
Bella Balassa (1965) developed a technique of the revealed comparative advantage (RCA) index, also known as the Balassa index. This index shows the comparatively advantageous products or those that have the ability to compete in the world market. If the RCA value comes to be greater than 1, that means the country is having comparative advantage or is competitive enough in that particular commodity and vice versa.
The RCA index is mathematically shown as
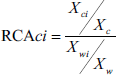
where RCA ci = revealed comparative advantage of country c in product i.
Accordingly, country c exhibits RCA in the export of good i if RCA ci is greater than 1.
Besides this, the general equation for the panel data following the determinants of export competitiveness is as follows:

where
Similarly,
w is the annual wage rate for laborers in the manufacturing industries, and GFCF is gross fixed capital formation to the manufacturing output, both taken in real USD millions.
REP is the relative export prices of India and China in the world market over the years in the study period, and R&D is the share of research and development expenditure out of the total GDP of India and China, respectively, adjusted for CPI at the base year 2010 in USD million.
CM is the cellular mobile subscription per 100 people in the countries in question used as a proxy for the communicational infrastructure of an economy, and REER is the calculated value of real effective exchange rates.
To check the stationarity of the data, Augmented Dickey-Fuller (ADF) and Phillips-Perron (PP) unit root tests have been utilized. Jarque-Bera (JB) test has been used for testing the normality of the data.
This article used static panel data techniques to carry out tests, so the fixed effect (FE) and random effect (RE) models are used. The FE model and RE model can handle the systematic tendency of individual-specific components to be higher for some units than others and possibly higher in some periods than others. Moreover, these models also have the advantage of adjusting for heteroscedasticity. To deal with the outliers, robust regression has been used to minimize their influence.
The decision between FE and RE was confirmed with the Hausman test, which is shown below:

where
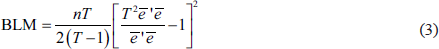
One more test for REs is Breusch-Pagan Lagrange multiplier (BLM). When the null hypothesis is rejected, it means that RE is a better estimator than the pooled regression. The BLM test is shown in Equation (3).
Results and Findings
Supplemental material shows the RCA values of the top 10 manufactured product lines that India and China exported, respectively, during 2020 and their corresponding values during the preceding years. The competitiveness of Indian manufactured exports is very similar to China and what is more similar is the trend in the values of RCA, which have steadily fallen after 2007, barring some periods in between.
Both India and China have maintained their competitive edge but exhibited a descending trend over the period except for a few years, which can be attributed to the slowdown of the world markets. The comparative advantage of Chinese and Indian manufactured exports maintained over such a long period implies that these economies have a vast potential for export competitiveness as far as manufacturing is concerned. Therefore, this study tries to find out what impacted the competitiveness pattern of manufacturing exports in these sample economies. Before proceeding to regression analysis, stationarity and normality of data need to be reflected, which are as follows.
Unit Root Tests
ADF unit root test and PP unit root test have been utilized in this study. Table 1 shows the results of ADF and PP, which indicate that the variables FDI, CM, R&D, Wage, REER, REP, GFCF, and RCA are integrated at I(1) in the case of India. However, for China, the variables of R&D, REER, and REP are integrated at I(0) in both the ADF and PP tests. The wage bill has shown stationarity at I(0) under the PP test while I(1) under the ADF test. Other variables of China in the study (FDI, CM, GFCF, and RCA) reflected stationarity at I(1) in both the ADF and PP tests.
Unit Root Tests.
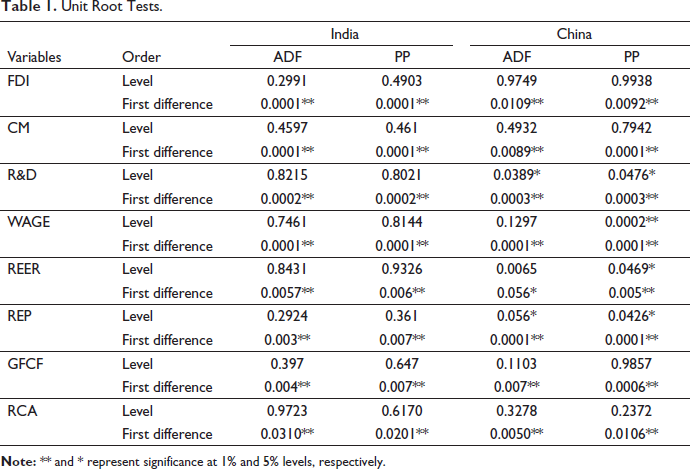
Therefore, the results displayed in Table 1 suggest that the variables are nonstationary in their levels but achieve stationary status after taking the first differences except for a few variables of China.
Similarly, Table 2 shows the normality of the time series data using the JB test.
The Jarque-Bera Test.

The JB test is a Lagrange Multiplier and is suitable for testing the normality of the data set, where the null hypothesis states that the data are normally distributed. Table 2 shows that the data set displays a normal distribution and is fit for the regression analysis. This also reflects that the data distribution has zero skewness and is perfectly symmetrical around the mean.
Regression Analysis
The results of the identified determinants of the export competitiveness of the top 10 product groups from India and China are shown in Tables 3 and 4, respectively. The problem of heteroscedasticity associated with panel data has been corrected via corrected regression of heteroscedasticity with robust standard errors. The robustness patterned results are consistent with the main results and confirm that the dependent variable of export competitiveness of the sample economies is associated with the determining factors included in the model.
Determinants of Export Competitiveness of India.
Determinants of Export Competitiveness of China.
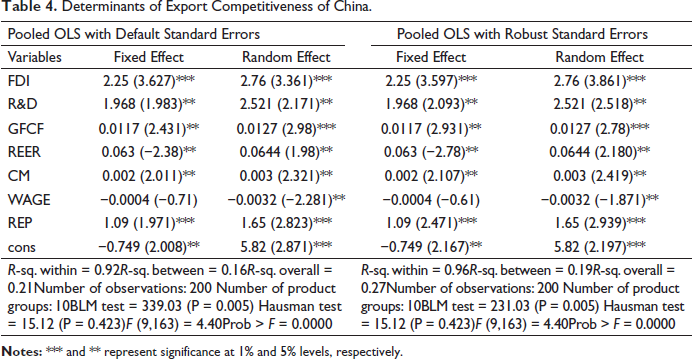
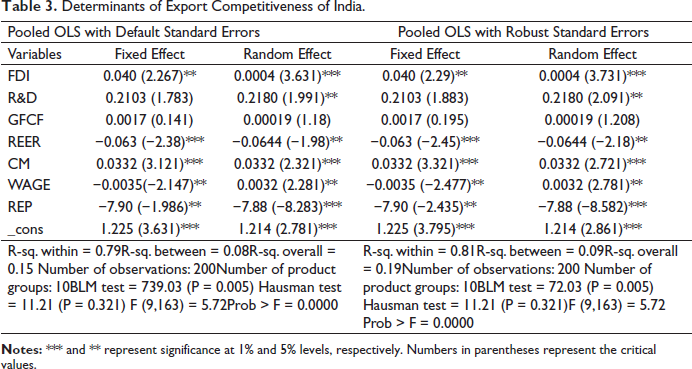
Table 3 reflects the results for the Indian economy and reveals that the model is significantly fit, as the F-statistic that determines the overall significance of the model is 5.72, and the probability is zero. This indicates that the overall regression of Indian export competitiveness is quite meaningful. Besides, the BLM and Hausman tests indicate that RE is more efficient in analyzing the impacting factors of the export competitiveness of India.
Results clearly illustrate that only FDI inflow and CM have significantly impacted the export competitiveness of India. However, these two variables are less effective in determining the export competitiveness of India due to their lower coefficient values. Besides this, R&D and GFCF also positively impact the RCA of Indian manufacturing, which remained insignificant in the fixed model, while R&D has positively impacted Indian competitiveness in the RE model. Table 3 also shows that a unit percent change in the REPs has a negative impact of around 8% on the export competitiveness of Indian manufactured products in both the FE and RE models. REER is also impacting India negatively, which, however, is not so effective as its coefficients have been very low as compared to other impacting variables. At the same time, wage rate gives a positive impact in RE.
The FE and RE analysis for China is shown in Table 4. The BLM and Hausman tests indicate that the RE is more efficient than the FE. It is clearly visible that FDI inflow to China has been quite significant for promoting export competitiveness with such an influencing magnitude of 2.25. Similarly, the other imperative determinants for China’s export competitiveness have been R&D and REP, which also remained relatively high and have contributed to the export competitiveness of China in the global market.
Besides this, GFCF and CM also contribute positively to the export competitiveness of China, as shown in Table 4. The wage rate has been the only variable that has negatively impacted the export competitiveness of China but is insignificant in the FE as reflected by its t-statistic value in the table. Besides this, the coefficient value is relatively low for wages in China, which is barely visible in determining its presence in the competitiveness pattern of China.
Evaluation
Regression analysis clearly shows that there has been a rather supportive response by the considered variables for China except for the wage bill. Because the average annual wage bill per worker during the study period has been USD 5,200 and USD 2800 for China and India, respectively. Besides, the average minimum yearly wage bill of a worker in the major Indian industrial cities remained only USD 1,000 against USD 3,000 in the imperative industrial centers of China. This mounting pressure on the wage bill somehow reflects the negative impact on the export competitiveness of China. However, the rising wage bill does not impact the production levels of industrial centers in China. Because the domestic manufacturers or the multi-national companies (MNCs) do not always consider the wage rates as precedence, the skill sets that Chinese labor is known for making them the outsourcing and offshoring favorites in the eyes of foreign investors (Krishnan, 2020). As for India, the constructive wage significance of Indian export competitiveness is due to the decline in protests and strikes along with the weakening of the disputes in the manufacturing factories that reduced the bargaining power of Indian laborers and therefore marked up productivity (Maiti, 2019).
Moreover, China has been investing a considerable percentage of its GDP in R&D expenditure, leading them to create and promote the most advanced and innovative products in the world market. R&D expenditure in China has evolved from 0.94%of its GDP in 2001 to 2.14% in 2018. Compared to China, India could only manage to disburse 0.74% of its GDP in 2001 to a high of 0.85% in 2008; after that, it went into a decline and remained at 0.65% in 2018. China put efforts into going up the ladder of technology production by investing higher volumes of resources into R&D. The economic strategies guided their human capital resulting in innovative and higher technological production processes (Liu & White, 2001). R&D expenditures helped China to accumulate knowledge that fitted the production process in manufacturing and were mainly pursued by three objectives: doing by China through multi-tasking and multi-skilled research programs, buying newer technologies from technology leaders like the US and European countries, and lastly bargaining for it through joint-ventures and MNCs, which made China spin-off the manufacturing miracle at a pace (Naughton, 2007). While India shares a significant role of small-scale enterprises in manufacturing exports like the town and village enterprises (TVEs) in China, the manufacturing firms of Indian origin are labor-intensive, limited by their technical inefficiency, and lack of access to sufficient financial support, which puts them on a back foot in terms of export competitiveness against China’s TVEs (Panagariya, 2007). However, research suggests that although exporting firms in India are labor-intensive, they significantly share high profits and productivity levels and remain quite R&D intensive than their non-exporting peers (Srinivasan & Archana, 2011). Therefore, to promote the production and exporting expertise of such units, R&D expenditure needs to be updated and should be prompted toward micro- and small-scale manufacturing units that account for around 40% of total manufacturing in India.
Apart from R&D, the relative export pricing has remained relatively good for Chinese manufactured products in the world market than for India. The export unit value index, a prerequisite for relative export pricing in the world market, remained at 94.3 for India in 2001, which afterward started increasing at a pace and stood at a high of 185.7 in 2011. Since then, it has shown a slight decline in value and remained at 162.37 in 2020. As for China, the export unit value index started at 97.34 in 2001 and remained at 129.7 in 2020. Therefore, it supported the price competitiveness of Chinese products in the global market better as compared to India.
The most crucial variable in promoting the export competitiveness of China remained FDI. Making products at a larger scale made China a manufacturing hub, which attracted foreign investors. Such investments were primarily export oriented in China, which supported its export competitiveness better than India (Bhat et al., 2006). FDI inflow got absorbed at a greater speed in China than in India, for example, USD 47 billion were inflowed to China in 2001 against USD 5.13 billion in India during the same period. FDI flow increased to a high of USD 253 billion in 2020 for China, whereas FDI inflow to India also increased but could not match the foreign investments that China absorbed. In India, FDI inflow stood at the highest peak of USD 64.36 billion in 2020. Thus, it is quite evident how much FDI China has governed and utilized for export promotion and competitiveness. This massive infusion of foreign investments in China has significantly impacted China’s export competitiveness in its manufactured product lines. FDI-linked Chinese industries to world-class production networks, and apart from bringing capital, they also gained access to upgraded technology and marketing channels along with organizational methods (Wignaraja, 2011). During the early years after China’s reforms, FDI was mainly focused on promoting low-technology product lines such as textiles, garments, and footwear. Subsequently, the surge in FDI during the 1990s and mainly after the Chinese accession to WTO in 2001 was diverted toward more value-added production networks like electronics and automated machinery. Research also suggests that China has been actively promoting policies to facilitate its domestic technological developments through foreign investments in technology upgradation, which are utilized by joint ventures in China (Rodrick, 2006; Wignaraja, 2008). The Chinese authorities also significantly promoted quality upgradation at both central and regional levels using tax and other policy incentives. Such incentives gave Chinese production units impetus in spreading the exports of high-technology products around China (Feenstra & Wei, 2010).
On the other hand, India could not significantly utilize the FDI in promoting the export competitiveness of its manufacturing product lines. FDI in India remained mainly focused on the service sectors rather than manufacturing, particularly in information and communication technology (ICT) and financial services. The surge in FDI in India during the 2000s remained encouraging but could not match Chinese figures. However, the increasing FDI in India also made a mark in encouraging technological upgrading, new skills, and new market connections for Indian manufacturing. The imbibing of export promotion associated with FDI was mainly because FDI in India remained focused on the large domestic market rather than manufactured exports (Kumar & Sharma, 2009). The reason for slower absorption of FDI in export-promoting Indian manufacturing after liberalization could be the FDI regulations, which were much more complex than in China. Second, many areas remained closed in India to foreign investors, such as nuclear, lottery and betting, multi-brand retails, agro-based sectors, foreign airlines, and most importantly, the small-scale industries (Wignaraja, 2011). Moreover, India nurtured middle-class consumerism fast after reforms which acted as a lodestone for the foreign products produced in the domestic market, which benefited the foreign investors but could not make any substantial impact on the export promotion of Indian manufacturing. Apart from the above, there is an apparent reason why FDI has not been utilized in the Indian manufacturing sector. The main reason has remained the skill-set problems in India, which, although present in ICT, are missing in manufacturing. Also, the wage rate is lower in India than in China. However, the linkage between wage and productivity is still a matter of concern, which reveals China to be more productive than its Indian counterpart in manufacturing products (Krishnan, 2020). Most importantly, China has the edge over India in absorbing high technology in their production units, which made China a global factory and promoted “Made in China” products at a larger scale in the global market.
Similarly, GFCF has positively impacted China’s export competitiveness, which was used to build the necessary infrastructure to promote exports and export competitiveness. Large-scale investments in physical capital remained an essential function of the Chinese government, and fewer examples like express highways, electricity production, developmental policy banks, and telecommunications were primary objectives since the reformation period of the Chinese economy (Naughton, 2007). Research suggests that the appropriate economic policies utilized physical capital to develop a rich export-promotion infrastructure without bureaucratic hurdles. China’s economic policies, along with the proper political setup, invested largely in education, health, and rural enterprises and were followed by highways, seaports, skyscrapers, and foundations in high-technology production. Besides physical capital, human capital also became a critical factor in China’s export growth more than in India (Krishnan, 2020; Yasheng, 2010).
Thus, the lesson India can learn from China is to invest in these areas where China has already made a mark. Both R&D expenditure and GFCF although exhibited a positive impact on Indian export competitiveness but remained insignificant, which India needs to work on. Besides this, the REPs are much higher for Indian-manufactured products in the world market than its counterpart, which needs to be reduced by manufacturing product lines at a larger scale. This can also be accomplished by utilizing automated machinery to make production faster, as India is lagging in skilled labor compared to China. The areas that could attract and absorb export-oriented FDI are the emerging product lines of India (Ganai & Sarin, 2020; Ganai et al., 2022). These include chemicals and pharmaceuticals, mechanical appliances and automated machinery, petroleum and gas, iron and steel, and other engineering product lines. Moreover, the Chinese race for high-technology production and artificial intelligence may determine the future of world economies.
Conclusion
This study discussed the impact of various variables on the export competitiveness of Indian manufacturing against China and what made India lag behind in the global market. The study found that China has a significant impact of FDI and R&D on its export competitiveness, followed by REP and GFCF. On the other hand, India somehow showed a positive impact of FDI and R&D, but their magnitude remained relatively low during the study period. Other variables also reflected a low magnitude of their coefficients that can scarcely suggest any impact on India’s export competitiveness. It also revealed that India has been trying to absorb FDI toward making the domestic market strong. In contrast, China remained entirely integrated with the international market through joint ventures and MNCs and promoted its exports in the global market. Similarly, China remained quite active in promoting the competitiveness of its manufactured product lines through investing in R&D and GFCF, which contributed a major part to its export competitiveness; on the other hand, this remained quite unresponsive for India. Therefore, the major areas where India needs to attract and absorb export-oriented FDI are the emerging product lines of India, such as chemicals and pharmaceuticals, mechanical appliances and automated machinery, petroleum and gas, iron and steel, and other engineering product lines to make a competitive mark in the global market. Besides, progress in the labor-intensive industries should be promoted in India, which could boost its products and endorse India’s trade competitiveness in the global market like its major counterpart, China.
Footnotes
Acknowledgments
The authors sincerely thank Professor Vishal Sarin, Lovely Professional University, India and Ex-Professor A. S. Bhat, Islamic University of Science and Technology, India, for their invaluable critique and guidance.
Declaration of Conflicting Interests
The authors declared no potential conflicts of interest with respect to the research, authorship, and/or publication of this article.
Funding
The authors received no financial support for the research, authorship, and/or publication of this article.
Supplementary Material
Notes
References
Supplementary Material
Please find the following supplemental material available below.
For Open Access articles published under a Creative Commons License, all supplemental material carries the same license as the article it is associated with.
For non-Open Access articles published, all supplemental material carries a non-exclusive license, and permission requests for re-use of supplemental material or any part of supplemental material shall be sent directly to the copyright owner as specified in the copyright notice associated with the article.