
Abstract
This study assessed the bilateral business cycle co-movement between the individual downstream suppliers (Association of Southeast Asian Nations) and upstream supplier (China and Japan) in Asian value chain. The empirical findings suggest that trade intensity negatively impacted the regional business cycle co-movement, while trade linkage has positive impacts. Moreover, the impact of value chain trade on business cycle co-movement is more apparent in the short run than in the long run.
Introduction
Since the 1980s, production processes were fragmented into vertical stages and split between multiple countries (Athukorala & Menon, 2015). According to Breda et al. (2009), cost reductions through lower trade barriers, organisational innovations, and advancing information and communication technologies facilitated increased outsourcing and offshoring activities. This geographical fragmentation of production has led to regional cooperation in production or regional value chains. Regional value chains involve trade in domestic or imported intermediates from all industries. These industries’ outputs are inputs in other industries for production to meet the final demand or to create additional intermediates in regional value chains.
According to the World Bank and World Trade Organization (2019), three common regional value chain clusters are European, American and Asian. The major suppliers in regional value chains are Germany (European), the United States (American), China and Japan (Asian) because of their size and the volume of their bilateral trade with other countries in their region.
This article focuses on the Asian value chain for two reasons. First, the downstream suppliers in the Asian value chain, such as Indonesia, Malaysia, Thailand and Singapore, were actively involved in the regional value chain, but their role in the Asian value chain is discussed minimally in the existing literature and, therefore, provides ample opportunity for study. Because of the unavailability of complete data sets, other active countries in the Asian value chain, such as the Philippines and Vietnam, are not included in this article. Second, the emergence of China has replaced part of the role of Japan and the United States in the regional value chain which is yet to be fully discussed in the existing literature.
As opposed to the existing literature that emphasises upstream suppliers, this article focuses on downstream suppliers (ASEAN-4) and their relationship with upstream suppliers (China and Japan). Therefore, the direct trade relationship between the United States, China and Japan will not be empirically tested and discussed because the three countries are upstream suppliers and, hence, is outside the scope of this article.
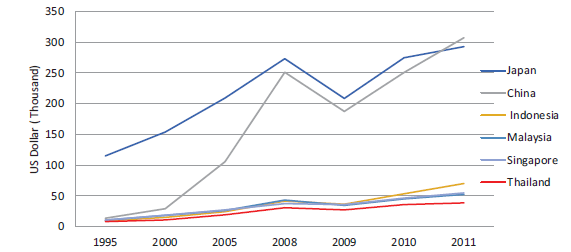
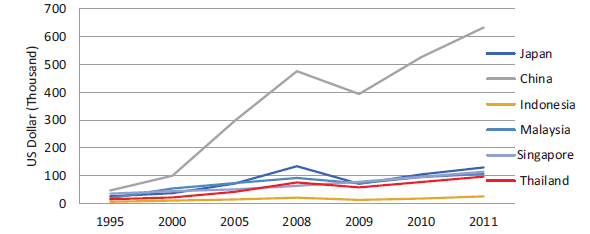
Participants in value chains are generally known as upstream or downstream suppliers through their domestic value added embodied in other countries’ export and foreign value added embodied in their exports. These values are captured by Figures 1 and 2. From the figures, Japan is an upstream supplier in the value chain because of its high domestic value added in foreign export and low foreign value added in export during the period of 1995–2011. Meanwhile, China has a high domestic value added in the foreign export and a high value of foreign value added in its export during the period. Malaysia, Singapore, Indonesia and Thailand (ASEAN-4) are downstream suppliers from 1995 to 2011 because of the high foreign value added embodied in their export compared to the export of domestic value added.
The small and open ASEAN-4 is assumed to be easily influenced by the movement of regional upstream suppliers, such as China and Japan, after joining the regional value chain that increases trade interdependency. The increasing reliance on foreign demand and supply, as in value chain, are assumed to make downstream suppliers more vulnerable to fluctuations of external final demand, which might eventually affect the country’s business cycle movement. To test the validity of this assumption, the present article examines whether trade in intermediates acts as a transmission channel to transfer business cycle movements from one country to another in this region from 1970 to 2015. The country pairs in the present article are China–Indonesia, China–Malaysia, China–Singapore, China–Thailand, Japan–Indonesia, Japan–Malaysia, Japan–Singapore and Japan–Thailand. Autoregressive distributed lag (ARDL) bound test was used for time series analysis.
Literature Review
The early literature on international business cycle co-movement is in the field of common currency, pioneered by Mundell in the 1960s and given new impetus by Frankel and Rose (1998). Franker and Rose suggested that a closer bilateral trade relationship would lead to a closer business cycles co-movement, particularly in bilateral intra-industry trade.
By extending Frankel and Rose’s (1998) model, Choe (2002) found that economic fluctuations are more synchronised within 10 East Asia over two periods, 1981–1990 and 1986–1995. Japan was found to play an important role in the East Asia business cycles co-movement through trade in the 1980s, using ordinary least square (OLS) and instrumental variables (IV) estimates. Moreover, Shin and Wang (2003) found a positive impacts of intra-industry trade on East Asia business cycle co-movement, between 1976 and 1997, using a fixed effect panel regression estimation method.
Outside East Asia, Calderon et al. (2007) found positive impact of intra-industry trade on business cycle co-movement through trade intensity 1 for 147 industrial and developing countries between 1960 and 1999, using OLS and IV methods. The empirical results showed a negative impact of inter-industry trade and a positive impact of intra-industry trade on business cycle co-movement. Diverged result was found between industrial and developing countries, where positive and significant impact of trade intensity on business cycle correlation was found among developing countries, albeit smaller compared to the industrial countries. Moreover, the impact of trade increased when countries had similar production structures.
Beside trade intensity, trade linkage is also a common proxy of trade integration. Trade linkage is defined as country pairs’ engagement in production sharing through trade flows of intermediate goods in a vertically integrated production network. The domestic and foreign intermediates were assumed to be not substitutable in the model. Using this definition, Burstein et al. (2008) found a positive relationship between trade linkage and business cycle co-movement between US multinational firms and their foreign affiliates. However, Burstein et al.’s (2008) study focused on the correlation of output than on the correlation of GDP. The main finding of their paper was that trade linkage in the same industry had a greater positive impact on business cycle co-movement compared to inter-industry trade linkage.
With the grow of value chain activities and availability of input–output data, Di Giovanni and Levchenko (2010) studied the impact of intermediates trade on business cycle co-movement. They found that country pairs that use each other’s outputs as intermediates experience stronger business cycle co-movements, but the degree of co-movement reduced in sectors with higher elasticities of substitution. To quantify the vertical trade linkages, they used input–output matrices to gauge the intensity with which individual sectors use each other as intermediate inputs in production. The impacts of bilateral trade on the strength of trade linkages were conditioned between each pair of sectors using input–output analysis. This provides evidence of transmission by focusing on an identifiable channel.
On the other hand, Johnson (2014) found that trade in intermediates can explain the goods trade co-movement but not the services trade co-movement. The impact of trade in intermediates on trade co-movement can only be seen via input linkages and not by value-added trade. Further, the impact of input linkages on trade integration is clear only when countries have strong bilateral production sharing linkages or are exposed to common shocks.
In contrast to Johnson’s (2014) finding, Duval et al. (2014) found a strong positive impact of value-added trade intensity on business cycle co-movement conditional on the control of global common shocks and country pair heterogeneity. In their model, a quasi-correlation of real GDP growth rates was used as a proxy of business cycle co-movement. Their results show that the variables of trade, bilateral intra-industry trade and trade specialisation correlation have a positive impact on business cycle co-movement. Using annual data from 63 countries, including 34 advanced economies (7 in Asia) and 29 emerging economies (8 in Asia), they found positive demand spill over impacts from China to other Asian countries.
In general, the extant literature suggests that a closer bilateral trade is lead to business cycle co-movement. Following the existing literature, the writers systematically examine whether ASEAN-4 participation in Asia value chain activities, through trade linkages and trade intensity, lead to bilateral business cycle co-movement with China and Japan, respectively. However, the present study is different to the existing studies by focusing on the downstream suppliers (ASEAN-4) in Asia value chain. Undertaking studies on business cycle co-movement in Asia value chain is important for policy implementation for downstream suppliers. If a downstream supplier’s business cycle movement is easily affected by the upstream supplier, regional growth is expected during a regional boom; however, negative external shocks during a regional recession would be catastrophic.
Methodology
A general business cycle co-movement model by Di Giovanni and Levchenko (2010) was adopted with some adjustments in this article. The model assumes that a more integrated trade relationship would promote a closer business cycle co-movement among the trade-related countries as is given below:

where,

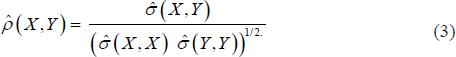
Business Cycle Co-movement
Business cycle co-movement (
The country-by-country GDP correlation was computed in bilateral form, namely China–Indonesia, China–Malaysia, China–Singapore, China–Thailand, Japan–Indonesia, Japan–Malaysia, Japan–Singapore and Japan–Thailand. The GDP data was extracted from World Development Indicators for the period 1970–2015.
Trade Intensity
Trade intensity is a common independent variable to represent trade in business cycle co-movement, such as in Frankel and Rose (1998), Shin and Wang (2003), Imbs (2004), Cerqueira and Martins (2009), Sato and Zhang (2006) and Antonakakis (2012). The common proxies of trade intensity are bilateral trade intensity, Grubel and Lloyd index or value-added trade data. To capture value chain trade in business cycle co-movement, the present article computes trade intensity following Di Giovanni and Levchenko (2010) with some adjustment. The major difference between the two is Di Giovanni and Levchenko (2010)’s trade intensity that was focusing on vertical linkage industries, while the present article trade intensity represents a trade in value chain at macroeconomic level that involves all industries.
In this article, trade intensity represents the significance of bilateral intermediates trade to total output. The variable of

where
Trade Linkage
Trade linkages represented by
Control Variables
Control variables were added into the model to improve the estimated result. Two main types of control variables were added into the model: (a) common shock that affects countries’ business cycle co-movement; and (b) implementation of bilateral free trade agreements that affect the bilateral trade relations between countries (Akın, 2012; Gruben et al., 2002; Imbs, 2004).
A common shock variable such as the Asia financial crisis (D1998) has been added to the models because of its long-term impact on ASEAN, except for Singapore. This is because Singapore’s imports recovered better than the other ASEAN-3 countries after the Asian financial crisis.
The control variable of D1982 has been added into all models that involve China because that year represents China’s 1982 constitution, which attributes greater flexibility and less ideological orientation of foreign policy to China. Meanwhile, other more specific control variables, such as bilateral trade agreements, are discussed in the specific country session in the ‘Results and Discussion’ section.
Autoregressive Distributed Lag (ARDL) Bound Test
The ARDL bound test was used due to its effectiveness in small sample time series model (Narayan 2005; Pesaran et al., 2001; Sam et al., 2019).
The ARDL model is regressed in a simple linear form as follows:

where
Our hypothesis assumes positive links between the independent variable and the dependent variables. If the variables are co-integrated in ARDL model, increase in bilateral intermediates trade, through trade intensity and trade linkage, leads to business cycle co-movement.
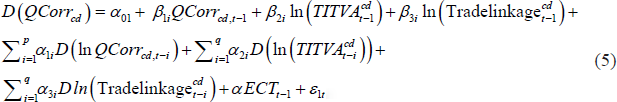
where all variables are as previously defined. ln(.) is the logarithm operator, D is the first difference, and ε
t
are the error terms.
The ARDL model estimates (p + 1) k number of regressors in order to obtain the optimal lags for each variable, where p is the maximum number of lags to be used and k is the number of variables in the equation. We choose maximum lag order for the ARDL model from a list of the optimal model selection criteria such as Schwarz information criterion (SC), Akaike Information Criteria (AIC), Hannan–Quinn information criterion (HQ) and sequentially modified Likelihood-Ratio (LR) test statistic.
Results And Discussion
Unit Root Tests Results
The validity of ARDL bound test result is based on the assumption that the variables are either integrated at order zero I(0) or order one I(1), and none of the variables is integrated at order two I(2). Spurious result might be obtained if this assumption is violated. Therefore, the stationary properties of the variables in the import demand function were tested using Augmented Dickey–Fuller (ADF), Phillips–Perron (PP) and Kwiatkowski–Phillips–Schmidt–Shin (KPSS) test prior to the ARDL bounds test. The unit root test result is given in Table A.1. All the variables are stationary either at I(0) or I(1).
ARDL Co-integration Test Results
The present article aims to understand whether ASEAN-4 participation in regional value chain activities would cause a more synchronised business cycle co-movement between the upstream (China and Japan) and downstream (ASEAN-4) suppliers. An ARDL bounds analysis was used to test Equation (5). Three tests for cointegration were conducted under the ARDL bound analysis, following Sam et al. (2019). The three tests are as follows: (a) an overall F-test on all coefficients on the lagged variables; (b) a t-test on the coefficient on the lagged level of the dependent variable; and (c) an F-test on all coefficients on the lagged independent variables.
The test statistics of (a) are compared with the critical value from Narayan (2005, Table of Case II) for a small sample size ranging 30–80; the t-test from (b) are compared with the critical value from Pesaran et al. (2001, Table CI (ii) Case (II)); and the F-test from (c) are compared with the critical value bound from Sam et al. (2019, Table 2 Case III).
If the calculated statistics is greater than upper (I (1)) critical values of the three tests, then the null hypothesis of no co-integration can be rejected. If the null hypothesis of all three tests are rejected, there is cointegration. If only the null from (a) and (b) are rejected, it implies a case of degenerate lagged independent variable case. If only (a) and (c) are rejected, then it implies a case of degenerate lagged dependent variable case.
The empirical results are reported from Tables 1–4 and discussed later in this section. From the empirical output, long-run, co-integrated relationships were found in all models, except Indonesia-Japan, Thailand-China, and Thailand-Japan. The dependent variable (GDP correlation) coordinates with the trade in value chain in the long run. This empirical result is consistent with the findings in the works of Choe (2002) and Shin and Wang (2003) that trade leads to closer business cycle movement in Asia. However, the present article is different to their works as this article is focusing on downstream suppliers in value chain trade. The estimated results for each individual country are reported and discussed below.
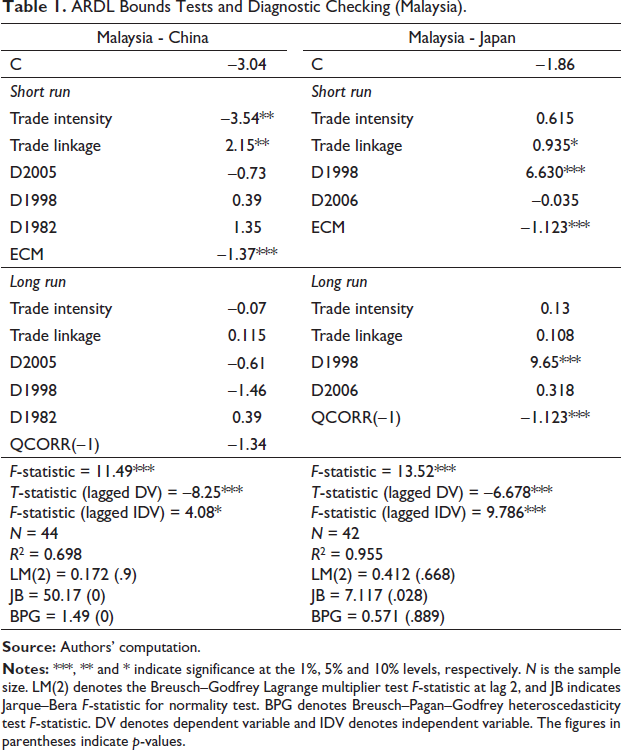
ARDL Bounds Tests and Diagnostic Checking (Malaysia).
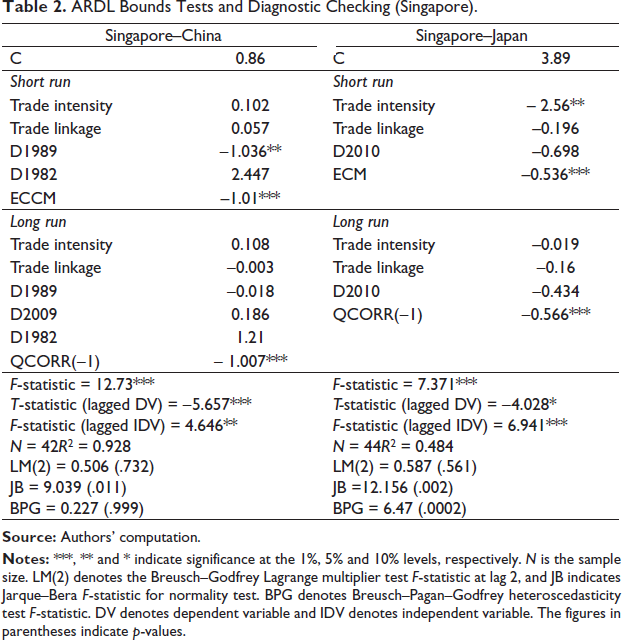
ARDL Bounds Tests and Diagnostic Checking (Singapore).
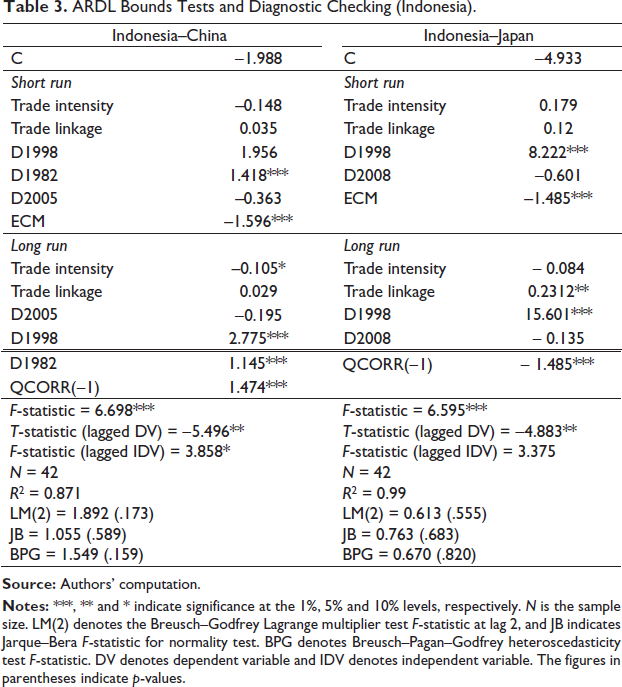
ARDL Bounds Tests and Diagnostic Checking (Indonesia).
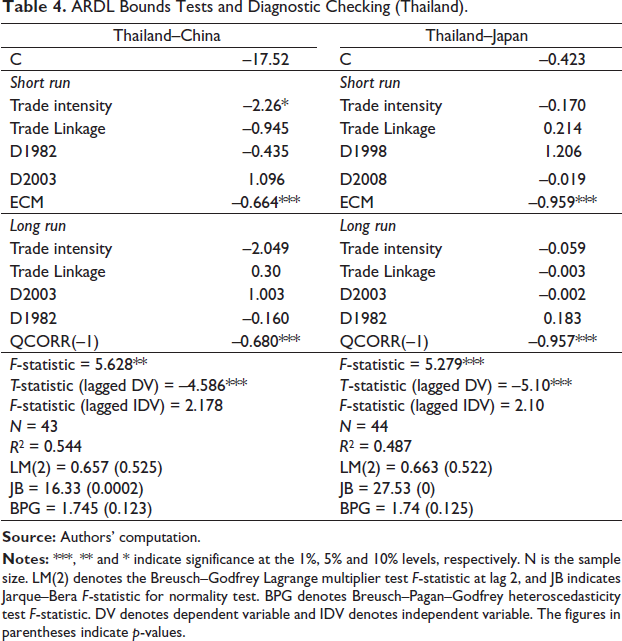
ARDL Bounds Tests and Diagnostic Checking (Thailand).
Malaysia
Long-run co-integration was found between bilateral intermediates trade and business cycle co-movement in the country pair of Malaysia–China and Malaysia–Japan, using ARDL bound analysis (Table 1). This is possibly because of a long trading history between and Malaysia–China and Malaysia–Japan. However, both trade variables, trade intensity and trade linkages are not significant in the long run.
In contrast, the short-run variable of trade intensity is empirically significant at −3.54 in the Malaysia–China pair, while trade linkage is significant at 2.15 and 0.935 in the Malaysia–China and Malaysia–Japan pairs, respectively. A negative trade intensity coefficient (–3.54) indicates that a 1% increase in bilateral intermediates trade reduces business cycle co-movement between Malaysia and China by 0.0354 in the short run. This is possibly because of the trade specialisation in regional value chain. Malaysia acts as the downstream supplier in regional value chain by importing high-tech intermediates from China to reproduce and specialise in that part of production stages. As a result, these two countries produce different types of intermediates and, thus, business cycle co-movement reduces when intermediates trade increases.
Meanwhile, the variable of trade linkage represents the bilateral import of intermediates contained in export. For example, trade linkage in the country pair of Malaysia–China represents the import of intermediates from China in the content of Malaysia’s export and vice versus. A positive trade linkage suggests that a 1% increase in trade linkage will cause business cycle co-movement between Malaysia–China and Malaysia–Japan to increase by 0.0215 and 0.935, respectively. It implies a short-run business cycle co-movement as a result of closer value chain relationship between the two countries.
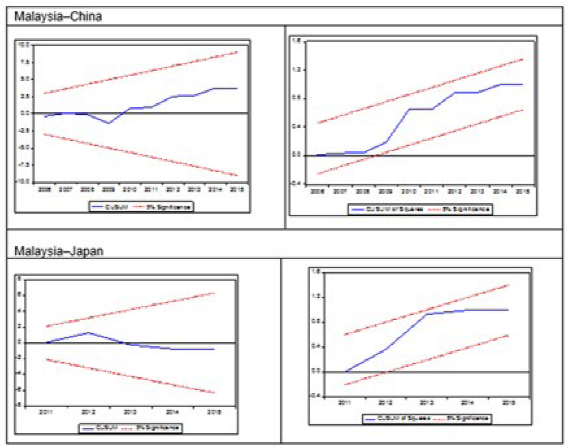
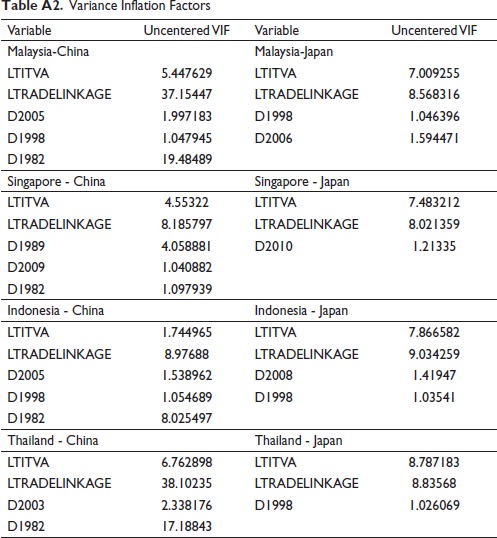
The country pair specific control variable D2005 represents the year both China and Malaysia de-pegged from the US dollar, while D2006 represents the Free Trade Agreement and economic integration agreement between Japan and Malaysia entry into force in 2006. The results show that R2 in the estimated equations are 0.698 in the Malaysia–China equation and 0.955 in the Malaysia–Japan equation, indicating that the estimated model tracked the data quite well. The diagnostic test result suggests that the equations passed the Lagrange multiplier test for there was no residual serial correlation up to two lags. Multicollinearity was found in the variable of trade linkage and control variable (D1982) in Malaysia–China equation (Table A.2), however the model passed the F-test on all coefficients on the lagged independent variables (Sam et al., 2019). Meanwhile, the cumulative sum (CUSUM) and CUSUM of squares diagrams in figure 3 suggest the stability of the models.
Singapore
As the trade centre in ASEAN, Singapore has close trade relations with both China and Japan. As expected, the results from table 2 prove co-integration between trade in value chain and business cycle co-movement in both the Singapore–China and Singapore–Japan models.
However, both coefficients of trade intensity and trade linkage are not significant in the Singapore–China pair. This implies that trade in value chain has no impact on the business cycle co-movement between the two countries despite a long-run co-integrating relationship according to the ARDL bounds test. Meanwhile, the result of trade intensity is negative and significant in the short-run Singapore–Japan (–2.56) pair. The negative sign suggests that a greater bilateral import of intermediates between Singapore–Japan leads to a lower business cycle co-movement between the two countries. This is possibly because an increased imported intermediates replaces domestic intermediates, thereby reducing the total output of the country and vice versus. The coefficient of trade linkage is not significant in Singapore–Japan pair.
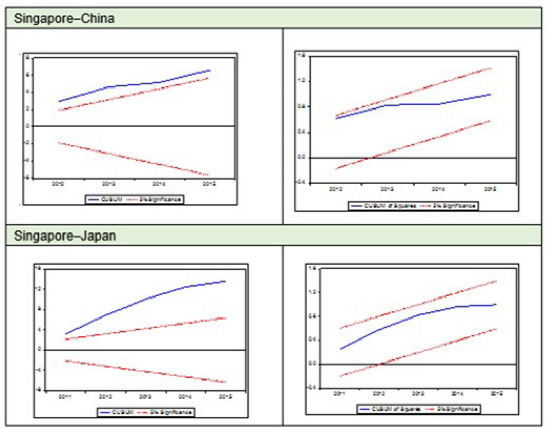
The country pair specific control variable D1989 represents when Singapore–Beijing re-established diplomatic relations in 1989, while D2010 represents the Japan–Singapore Economic Partnership Agreement (JSEPA) in 2010. The empirical results also report that R2 in the Singapore–China and Singapore–Japan equations are 0.928 and 0.484, respectively, suggesting that the Singapore–China equation tracked the data quite well. The diagnostic test results suggest that the equations passed the Lagrange multiplier test because there was no residual serial correlation up to two lags. Figure 4 shows the movement of CUSUM square is within the critical lines suggests stable residual variance, however the movement of CUSUM is outside the critical line suggests coefficient instability.
Indonesia
Indonesia is a resource-rich ASEAN member, the domestic value added embodied in foreign exports is high, while the foreign value added embedded in its export is low as shown in Figures 1 and 2, respectively. Possibly because of this, mixed results were found in ARDL bound test as shown in table 3. A co-integrating relationship was found in Indonesia–China, while no co-integrating relationship was found in Indonesia–Japan. The coefficient of trade intensity is −0.105, suggesting a negative impact of trade intensity on the Indonesia–China business cycle co-movement in the long run. The coefficient of trade linkage is 0.2312, suggesting a positive impact of trade linkage on the Indonesia–Japan business cycle co-movement. Both coefficients are empirically significant.
The control variables D2005 and D2008 were added into the model. D2005 represents the implementation of the free trade agreement between ASEAN and China in goods, while the control variable D2008 represents the implementation of the Japan–Indonesia Economic Partnership Agreement in 2008.
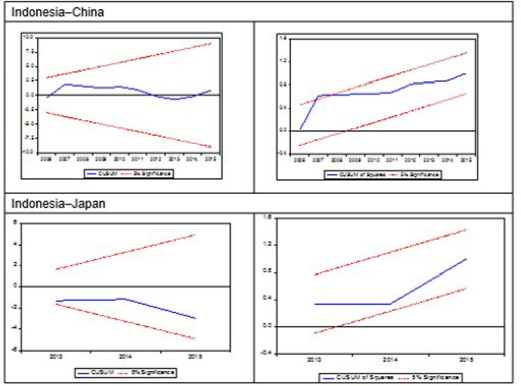
The results show that the R2 in Indonesia–China and Indonesia–Japan equations is 0.871 and 0.99, respectively. This implies that the estimated equations individually track the data quite well. The diagnostic test results indicate that the equations passed the residual normality (Jarque–Bera), heteroscedasticity (Breusch–Pagan–Godfrey) and Lagrange multiplier tests, for there was no residual serial correlation up to two lags. The CUSUM and CUSUM of squares diagrams in figure 5 suggest the stability of the models.
Thailand
There was no co-integration found in both Thailand–China and Thailand–Japan models as reported in table 4. However, the variable of trade intensity is significant. The negative sign implies negative impact of intermediates trade on Thailand–China business cycle co-movement. The negative trade intensity coefficient (−2.26) suggests that a 1% increase in trade intensity would cause a 0.00226 decrease in business cycle co-movement between Thailand and China in the short run. Meanwhile, trade linkage has no impact on business cycle co-movement. On the other hand, there were no significant variables found in Thailand–Japan model. It implies that Thailand participation in Japan-led value chain has no impact on these two countries’ business cycle co-movement in terms of trade intensity and trade linkage.
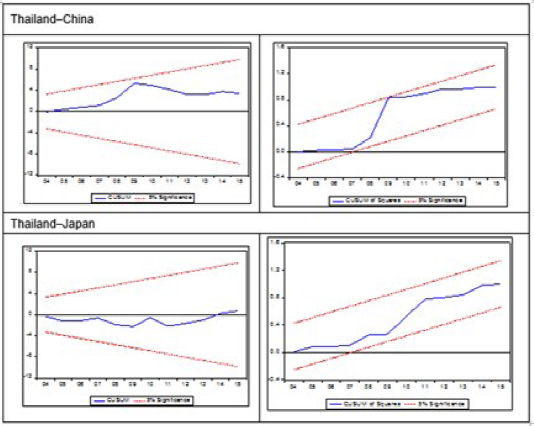
The control variable D2003 was added into the model to represent the China–Thailand free trade agreement that came into effect in October 2003. The empirical results report that the R2 in Thailand–China and Thailand–Japan is 0.544 and 0.487, respectively. The diagnostic test results suggest that the equations passed the heteroscedasticity test (Breusch–Pagan–Godfrey) and the Lagrange multiplier test, for there was no residual serial correlation up to two lags. Multicollinearity was found in the variable of trade linkage and the control variable (D1982) in Thailand–China equation (Table A.2). The diagrams of CUSUM and CUSUM of square in figure 6 show the stability of the models.
Conclusions
The empirical finding reports long-run co-integrated relations in all models except Indonesia–Japan, Thailand-China and Thailand–Japan. This indicates a variation on how intermediates trade affects business cycle co-movement among the selected county pairs. Moreover, the empirical findings suggest that trade intensity has a negative impact on business cycle co-movement, while trade linkage has a positive impact on business cycle co-movement.
Generally, the empirical results suggest that the participation in the value chain leads to closer business cycle movement between the downstream and upstream suppliers. Although the bilateral trade in intermediates will not lead to business cycle co-movement, high content of imported intermediates in export will lead to it. No further insight on the benefits or disadvantages of participation in value chain activities can be gleaned from the results. However, it does provide insights on international trade policy implementation, if business cycle co-movement is not preferable.
Appendix
Unit Root Test Result.
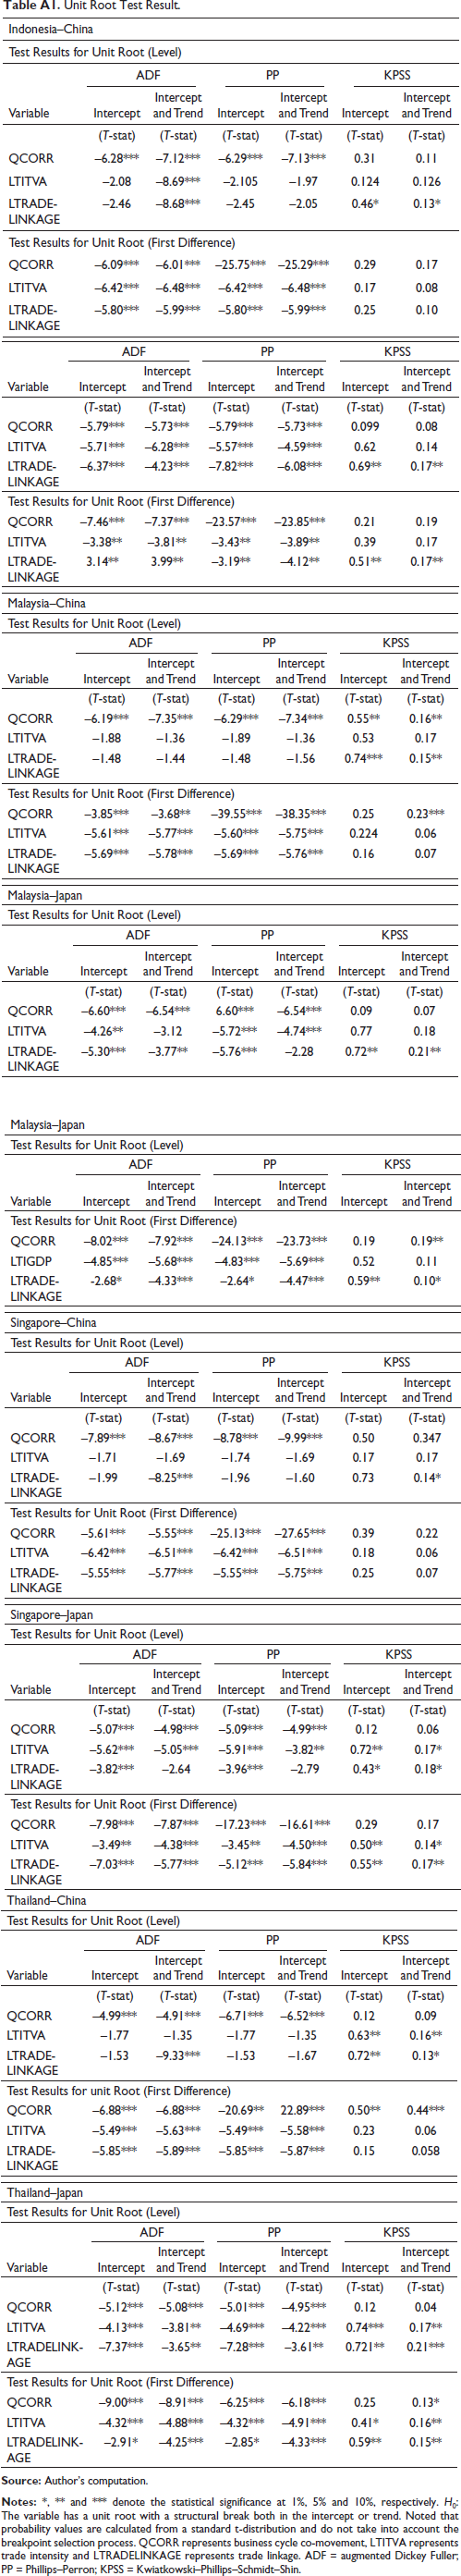
ADF = augmented Dickey Fuller; PP = Phillips–Perron; KPSS = Kwiatkowski–Phillips–Schmidt–Shin.
Variance Inflation Factors
Footnotes
Acknowledgements
Authors are grateful to anonymous referee of the journal for valuable comments. Views are authors own.
Declaration of Conflicting Interests
The authors declared no potential conflicts of interest with respect to the research, authorship and/or publication of this article.
Funding
The authors received no financial support for the research, authorship and/or publication of this article.