
Abstract
How many autistic college students are in the United States? Research to date has not specifically addressed this seemingly straightforward question. Yet, an answer may be critical to the advancement of research, policy, and practice related to autistic students in higher education. This article addresses three related but distinct questions about autistic students’ college enrollment within the United States: (1) What percentage of autistic high school students go on to college? (2) What percentage of students registered with their postsecondary institutions’ Disability Services Offices are autistic? and (3) What percentage of enrolled undergraduates are autistic? To answer these questions, we examined 731 publications, reviewed 16 common survey instruments used at postsecondary institutions, and inspected codebooks from 6 federal datasets. Rather than employing traditional systematic review techniques, we used an iterative, consensus-driven assessment process to ultimately synthesize relevant data from 14 prior publications and 3 original author-generated statistical summaries drawn from a total of 13 distinct sources of underlying data. We conclude that the best available evidence suggests 42.9%–47.0% of autistic high school students continue on to college, 2.8%–4.0% of college students registered with their schools’ Disability Service Offices are autistic, and 0.3%–4.7% of all undergraduates are autistic. Ultimately, our calculations suggest that there are likely between 135,400 and 286,254 autistic undergraduates currently attending college in the United States. These estimates can be used by researchers, policymakers, and educators to highlight the importance of attending to the interests, needs, experiences, and outcomes for autistic students.
Community Brief
Why is this an important issue?
While we have established estimates of the prevalence of autism among children, we do not have a reliable estimate of how many college students in the United States are autistic. Without solid estimates about this population’s size, many people will assume it is much smaller than it actually is. Policymakers might overlook the needs of autistic college students. Educators may face resistance when advocating for resources. Researchers may struggle to convince grant funders to support new research on this topic. Autistic high school students may be concerned that they will not meet other autistic people in college.
What is the purpose of this article?
The purpose of this article is to estimate the number of autistic college students in the United States. We address three Research Questions (RQs 1–3): What percentage of autistic high school students go on to college? What percentage of students registered with their institutions’ Disability Services Offices are autistic? What percentage of enrolled undergraduates are autistic?
What did the researchers do?
We searched for published research, surveys that are widely used with college students in the United States, and studies conducted by the U.S. Institute for Education Sciences. We used these sources to calculate our estimates.
What were the findings?
While current data do not allow a single number, we can develop some best estimates. First, we estimate that 42.9%–47.0% of autistic high school students go on to enroll in higher education. Second, we estimate that 2.8%–4.0% of students registered with their colleges’ Disability Services Offices are autistic. Third, we estimate that 0.3%–4.7% of all undergraduates are autistic. Finally, we estimate that there are currently between 135,400 and 286,254 autistic undergraduate students in the United States.
What do these findings add to what was already known?
Although there are strong research-based estimates of the number of autistic children, these numbers are less helpful in the context of autistic adults and higher education. By bringing together information from multiple sources, our analyses overcome limitations of each individual prior study.
What are potential weaknesses in the article?
There was a lot of variation across previous studies. This made it impossible to calculate a conclusive estimate for each research question. We used our professional knowledge to assess each study’s calculations and generalizability. However, other people may have assessed those studies differently. We also only examined data from autistic college students in the United States, so our estimates may not apply to higher education in other countries.
How will these findings help autistic adults now or in the future?
These estimates can be used by researchers, policymakers, and educators to highlight the importance of attending to the interests, needs, experiences, and outcomes for autistic students. We hope autistic individuals and their families will gain confidence in knowing that they will not be alone in pursuing higher education. Finally, we expect these estimates to be updated in the future as new data emerge.
Background
A recent update from the Autism and Developmental Disabilities Monitoring Network states that 1 in 31 children are autistic. 1 This statistic and its predecessors is likely the most frequently repeated piece of information related to autism, and not just among the general public. Since the Centers for Disease Control and Prevention’s publication of the 1 in 69 statistic in 2016, that series of reports has been cited in scholarly literature more than 18,000 times (Google Scholar, as of July 2025).
However, that statistic—derived from reports about 8-year-old children—is of minimal relevance for scholars looking to examine the current state of postsecondary access, experiences, or outcomes for autistic students. Yet, scholars continue to repeat this statistic, likely because they lack an appropriate alternative. Indeed, other studies frequently cited when scholars reference the prevalence of autistic college students are subject to distinctive limitations and generate different estimates. For example, even among studies using the same source data (National Longitudinal Transition Study-2; NLTS2)2–6—a dataset that only includes students who were diagnosed more than 25 years ago—subtle differences in language, sampling criteria, and statistical methodology yield estimates from 29.6% to 43.9% for our first research question.
Developing better estimates of the prevalence of autistic students in higher education is important to many stakeholders, including researchers, policymakers, educators, autistic students, and their families. Without such data, policymakers and institutional administrators may overlook the significance of this population, which could hinder efforts to expand support for autistic students. Services designed to support individuals with neuropsychiatric disabilities are often limited and not prioritized until a “critical mass” is perceived. 7 Estimates of the size of this student population could aid this perception as well as provide advocacy groups with research-grounded evidence to reference when advocating for resources.
With this article, we draw from multiple data sources to provide estimates addressing three distinct but related Research Questions (RQs 1–3) about the prevalence of autistic students in higher education within the United States. What percentage of autistic high school students go on to college? What percentage of students registered with their institutions’ Disability Services Offices are autistic? What percentage of enrolled undergraduates are autistic?
The first question is especially relevant for K-12 students, individualized education plan (IEP) coordinators, parents, and scholars in the field of special education. The second will be of keen interest to postsecondary staff in disability service offices (DSOs), where many autistic students go to pursue disability-related accommodations. Answers to the third question are important for a variety of stakeholders, particularly because they may be leveraged to encourage policymakers, administrators, faculty, staff, and researchers to give the large and growing number of autistic students greater attention.
Methods
Because data on autistic college students are fragmented across disciplines and often located outside traditional academic journal articles, we used a narrative review approach. Doing so enables us to go beyond merely repeating inconsistent estimates offered by a disjointed collection of isolated articles; it allows us to synthesize both previously published estimates and original analysis of data from a diverse range of sources (e.g., multi-institution surveys, government datasets) to estimate the prevalence of autistic college students at a national level. We focused on three types of sources from which we leverage empirical data to calculate prevalence estimates addressing each of our research questions.
First, we searched the Education Resources Information Center database for publications referencing autistic college students. We ran multiple searches using varied combinations of broad terms related to higher education (e.g., college, university) and autism (e.g., autistic, Asperger), including alternate spellings (e.g., post-secondary, postsecondary), abbreviations (e.g., ASD), and derivatives (e.g., colleg*; which captures all words that start with “colleg,” like “college,” “colleges,” “collegian,” “collegiate”). This liberal search yielded 731 hits. We reviewed each abstract to identify publications that either focused specifically on our populations of interest (e.g., autistic college students) or used a broader sample (e.g., a general cross-section of college students) but explicitly referenced autistic students. This process eliminated all but 45 publications, the full text of which we reviewed to identify those reporting empirical data.
Although this search would best be considered comprehensive rather than exhaustive, it nonetheless revealed a pervasive reliance on analyses of the NLTS2 dataset2–6 or estimates from a small, single-institution study. 8 Remarkably, only two studies8,9 incorporated autism screening tools or direct evaluations of potentially autistic students; we excluded from our analyses studies using the Broad Autism Phenotype Questionnaire10–12 as it is not intended to be an autism screener or diagnostic tool. 13
Second, we drew upon the research team’s experiences—working with a state department of education (C.B.F.), collaborating with an institutional assessment office (C.R.K.), and studying college student experiences and outcomes for more than 20 years (B.E.C.)—to identify survey instruments commonly completed by multi-institutional cross-sections of undergraduate students in the United States. We then reviewed publicly available copies of 16 such instruments, including the National Survey of Student Engagement, the Cooperative Institutional Research Program’s (CIRP) Freshman Survey, and the Collegiate Learning Assessment, and instruments from Noel-Levitz, Educational Benchmarking, and the American College Health Association (ACHA). We also explored those surveys’ websites in search of data summaries, project reports, and lists of publications based on their data. That search helped us identify two reports that specifically shared empirical data on autistic college students in the United States (i.e., ACHA’s National College Health Assessment [NCHA]-III 2024 report and Stolzenberg et al.’s 2019 report from CIRP).
Third, we examined the online codebooks for six U.S. Institute of Education Sciences (IES) studies of high school and/or college students to determine if any included the word “autism” in any question, variable name, or response option. Only three did: Baccalaureate and Beyond (B&B), National Postsecondary Student Aid Study (NPSAS), and High School Longitudinal Study (HSLS). For each, we conducted descriptive analyses using the Powerstats application provided by National Center for Educational Statistics DataLab of IES, 14 which allows custom statistical analyses on protected student-level datasets via its online portal.
Ultimately, our final analyses were based on 14 prior publications and 3 original author-generated statistical summaries drawn from a total of 13 distinct sources of underlying data. B.E.C. and at least one other author scrutinized each of the sources included in our analysis (i.e., previous publications, assessment instrument data tables, public datasets) to assess both the generalizability of its sample and our confidence in its preponderance calculation. Because sources differed markedly in sampling frames, item wording, reporting, timing, location, context, etc., we could not implement a predefined or universally applicable scoring rubric. Rather, we assessed each data source holistically after examining specific areas of consideration.
When conducting our assessment of generalizability, we considered four primary factors related to the studies’ samples.
Our ratings of calculation confidence were driven by seven considerations.
These considerations did not always operate uniformly, independently, or have equal weight in our deliberations. Our assessments of generalizability and confidence were informed by subtle contextual considerations unique to specific studies. For example, we reduced our generalizability rating for two studies8,9 because the institution from which the samples were drawn has a strong focus on science, technology, engineering, and math (STEM), fields in which autistic students are disproportionately enrolled. 3 We also downgraded our initial assessment of one data source 21 after one of this article’s reviewers told us about Texas’s cap on special education enrollment numbers. 23 Consensus determinations of these ratings were reached via ongoing conversations among the research team (B.E.C., C.R.K., and C.B.F. regarding articles published through 2019; B.E.C. and K.M.S. for later sources) during which initial assessments would be revisited whenever new information related to that data source came to light.
When we present our findings below, we draw from all three types of sources. The variety of source material was particularly apparent for the third research question, where we found data from previous literature, national surveys, and government databases; data for question 3 also included self-reports, direct diagnostic assessments, and data maintained by an administrative educational tracking system. After presenting findings for the three individual research questions, we combine the reported percentages with federal data 24 to generate multiple estimates for the total number of current autistic undergraduates in the United States. Our final set of estimates include adjustments to account for the 37.2% nondisclosure rate among autistic college students identified in previous research. 2
Limitations
Although we have drawn data from diverse sources to address questions regarding autistic students’ prevalence in higher education, our analyses are subject to several limitations. First, while our review of 731 publications, 16 student surveys, and 6 federal datasets was extensive, it was not an exhaustive systematic review. Similarly, because the variability within our data sources precluded the systematic application of a standardized evaluation rubric, we had to rely on an iterative application of the aforementioned guidelines to establish our generalizability and calculation confidence ratings. Despite our efforts to be transparent about these processes, we recognize that such processes might be difficult to replicate and that other scholars may have made equally reasonable alternate choices likely to yield different results. Second, there was wide variation among estimates, even among those using the same dataset. We encourage readers to consider the full range of estimates rather than focus on any specific one individually. Third, and finally, we limit our focus to college students pursuing undergraduate degrees within the United States. Readers should take caution when attempting to apply these estimates to other populations. Because of these varied limitations, the results reported in this article should be considered more suggestive than conclusive.
Findings
Our main presentation of findings focuses on the three research questions independently. We conclude by calculating an estimated range of the number of college students in the United States who are autistic, informed by our confidence in the estimates we review here and factoring in the presence of autistic students who may choose not to self-disclose.
RQ1: What percentage of autistic high school students go on to college?
A wide range of stakeholders (e.g., parents, K-12 teachers, higher education researchers, policymakers, and so on) have an interest in estimates of the frequency with which autistic high school students enroll in postsecondary education. For example, although all students with an IEP are required to have a transition plan to prepare for life after high school, 25 this plan may not target college-readiness if teachers, parents, or the autistic student are under the impression that it is uncommon for autistic individuals to pursue higher education.26,27
The NLTS2 dataset is cited extensively by researchers, with the project’s national report 2 indicating that 43.9% of autistic high school students had ever enrolled in any postsecondary education (“including vocational, business, or technical school,” p. 19) up to 8 years after completing high school. Subsequent studies using this dataset,3–6 however, used more restrictive criteria to generate estimates closer to 31% (see Table 1). Across these studies, analyses of the NLTS2 dataset differ in their sample of interest (e.g., autistic high school completers, autistic 12th graders, and so on) and in their outcome variables (e.g., attending any postsecondary education, seeking a degree, and so on). Therefore, we consider these data holistically to define a range of estimates for the percentage of autistic high school students who subsequently attend college.
Percentage of Autistic High Schools Students Who Subsequently Attend College
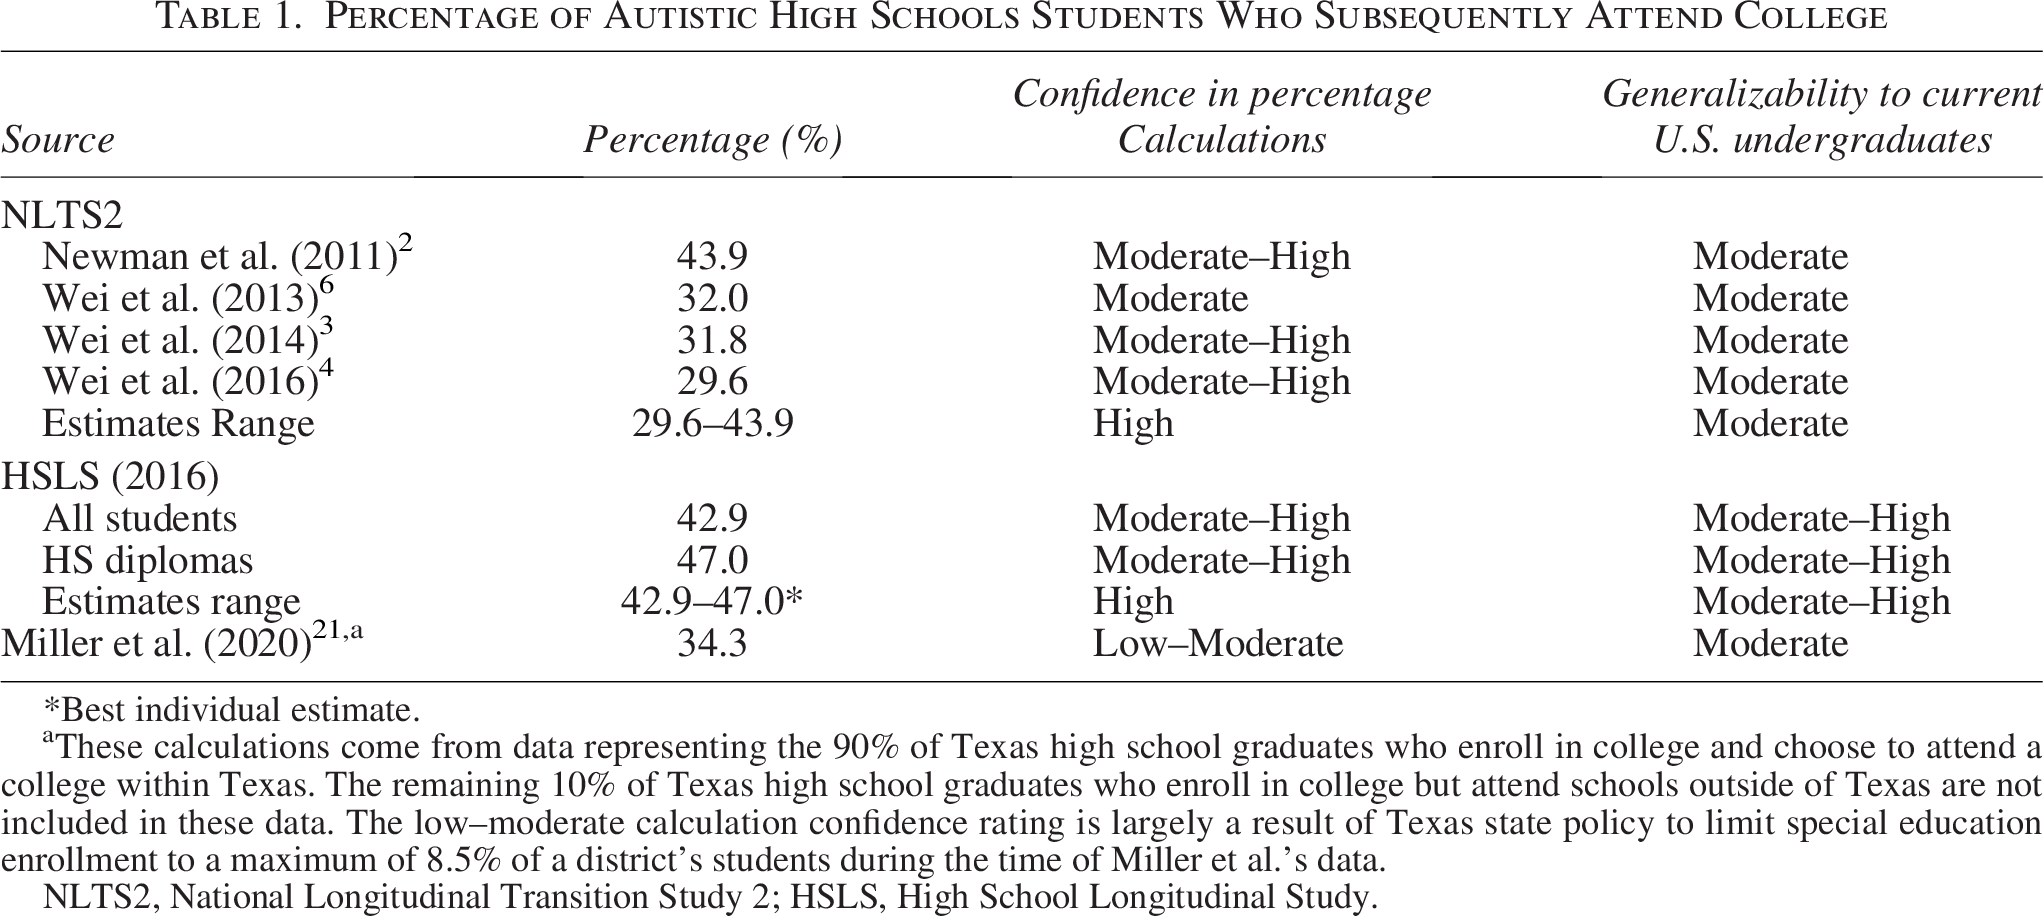
*Best individual estimate.
These calculations come from data representing the 90% of Texas high school graduates who enroll in college and choose to attend a college within Texas. The remaining 10% of Texas high school graduates who enroll in college but attend schools outside of Texas are not included in these data. The low–moderate calculation confidence rating is largely a result of Texas state policy to limit special education enrollment to a maximum of 8.5% of a district’s students during the time of Miller et al.’s data.
NLTS2, National Longitudinal Transition Study 2; HSLS, High School Longitudinal Study.
Nonetheless, analyses using NLTS2 data are based on a sample established 25 years ago. Authors have noted that analyses using the dataset can only be “generalized to the cohort of youth receiving special education services [in 7th-12th grade or equivalent] at the study’s start [December, 2000] in a given age range [13–16 years old]…” 3 (p1,161). The age and limited generalizability of this sample somewhat limit any related estimates’ applicability to current educational environments, as the subsequent two decades have seen dramatic changes in diagnosis rates,28,29 public awareness,30,31 K-12 support, 32 and postsecondary opportunities for autistic individuals.22,33 While we have high confidence that, when considered collectively, the range of estimates from NLTS22–6 captures the extent to which high school students in that particular dataset went to college, the age and sampling limitations allow us only moderate confidence that associated estimates accurately reflect the current state of autistic students in higher education.
We identified two other government-supported datasets that could be used to estimate how many autistic high schoolers transition to college. First, the Texas Education Research Center linked administrative records of four cohorts of Texas high school graduates (2006/07 through 2009/10) with postsecondary data from the Texas Higher Education Coordinating Board (2007/08 through 2017/18). 21 The estimate of how many autistic high school graduates go on to enroll in college (34.3%) is similar to others’ estimates using NLTS2.3–6 Although the ability to link student records to in-state enrollment in higher education is impressive, we have only a low-to-moderate level of confidence in calculations from this dataset. Their analysis includes only K-12 students who were enrolled in special education, had autism listed as their primary disability, graduated high school between 2007 and 2011, and attended college within the 2 years immediately thereafter. An important contextual factor is the unofficial 8.5% cap on special education enrollment in Texas school districts during this period,23,34 which likely contributed to an undercounting of autistic students. Our confidence is also tempered by the lack of ability to track students who enrolled in colleges outside of Texas or over a longer period of time. Considering these factors, we assess it to have moderate generalizability to current high school students who go on to college.
Our analysis of the second IES dataset, the HSLS, yields considerably higher estimates. Roughly 42.9% of all students whose parents reported their ninth grader as having “some form of autism” in 2009 subsequently pursued a postsecondary “degree or certificate.” Restricted to students who completed a high school diploma, the estimate rises to 47.0%. Our confidence in these calculations is comparable with that of the NLTS2 (moderate to high), whereas the newer HSLS data suggest a slightly higher level of generalizability to today’s undergraduates in the United States.
RQ2: What percentage of students registered with their institutions’ disability services offices are autistic?
Although a small number of colleges have developed their own autism-specific support programs, 33 Section 504 of the Rehabilitation Act of 1973 requires postsecondary institutions throughout the United States to provide “auxiliary aids and services in a timely manner to ensure effective participation by students with disabilities”. 35 To receive associated accommodations, students must disclose their disability status, typically through registration with their institutions’ DSO. Estimates of the number of DSO-registered students who are autistic are of interest to various stakeholders, including scholars seeking research participants, counseling staff supporting autistic students, and DSO staff considering developing an autism support program. As institutions may use DSO registration numbers to estimate how many autistic students they serve, we explored literature examining the relative frequency with which students registered with DSOs are autistic (see Table 2).
Percentage of Students Registered with College Disability Services Centers Who Are Autistic
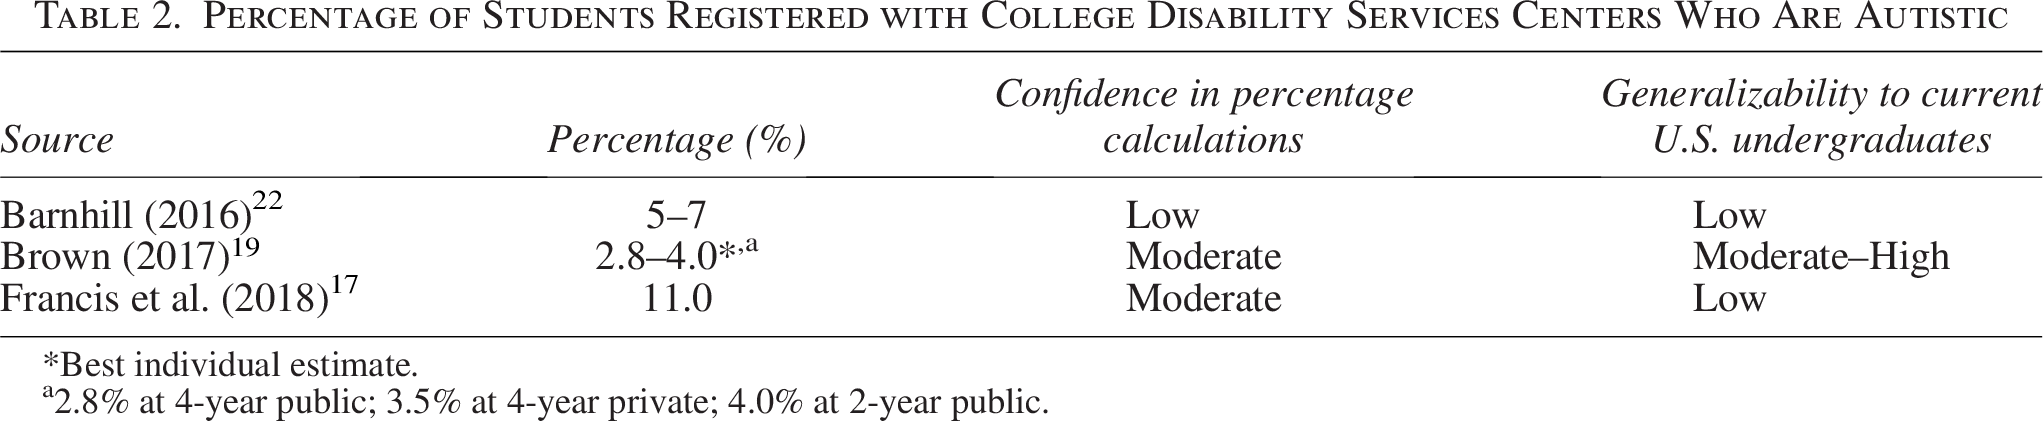
*Best individual estimate.
2.8% at 4-year public; 3.5% at 4-year private; 4.0% at 2-year public.
One study from a single institution’s DSO 17 reported that 11% of registered students had a primary diagnosis of autism. Another study using a sample of program staff at 30 postsecondary institutions (93% were 4-year schools) with autism-specific support services 22 found that approximately 5% (median) to 7% (mode) of students registered with their institutions’ DSOs reported a diagnosis of autism. Unfortunately, the limited number and composition of institutions included in their analyses undermine these studies’ generalizability to the wider American postsecondary education system.
A larger study collected data from DSO staff at 469 postsecondary institutions across the United States, stratified by control (public/private) and level (2/4-year). 19 Calculations from these data indicate that 2.8% of DSO-registered students at 4-year public institutions, 3.5% at 4-year private institutions, and 4.0% at 2-year public institutions were autistic. We are moderately confident in that study’s estimate of the number of college students who are autistic, as they used formal diagnosis and registration with a DSO, sampled several hundred institutions, and stratified their sample by control and level.
RQ3: What percentage of enrolled undergraduates are autistic?
Understanding the prevalence of autistic college students in the United States represents a basic but necessary starting point to advance research, policy, and practices that might support autistic students’ success. We reviewed data from studies that used autistic trait screeners and (sometimes) subsequent diagnostic assessments,8,9 IES’s NPSAS database, the Texas-specific dataset described above, 21 and data provided by national survey instruments that asked students about their autism status. While still subject to limitations related to self-disclosure, estimates from large, multi-institution samples significantly contribute to our ability to estimate the number of enrolled undergraduate students who are autistic.
Screening for autistic traits/autism
By measuring students’ self-reported autistic traits and administering diagnostic assessments to those who exceed cut-off scores, researchers may be able to develop prevalence estimates that include students who do not know they are autistic as well as some who may be reluctant to formally disclose to their institution. Two related studies8,9 used the Autism Spectrum Quotient (AQ) to screen students from a single institution, finding that 1.9% and 2.4% exceeded suggested cut-off scores (see Table 3). Subsequent formal diagnostic evaluations with a subset of those students with high AQ scores dropped the estimate to 0.7% of students meeting clinical criteria for autism. 8 While this study is widely cited (540 times; Google Scholar, as of July 2025), the estimates are based on data collected over a decade ago at a single, 4-year, research-focused institution. As such, we have low confidence in their generalizability to more recent student cohorts at a broader range of institutions. Furthermore, concern about the AQ’s psychometric validity has increased over the last decade.36–39 Despite the AQ’s widespread use in research, caution is needed when citing estimates of students based on that instrument.
Percentage of Current College Students Who Are Autistic
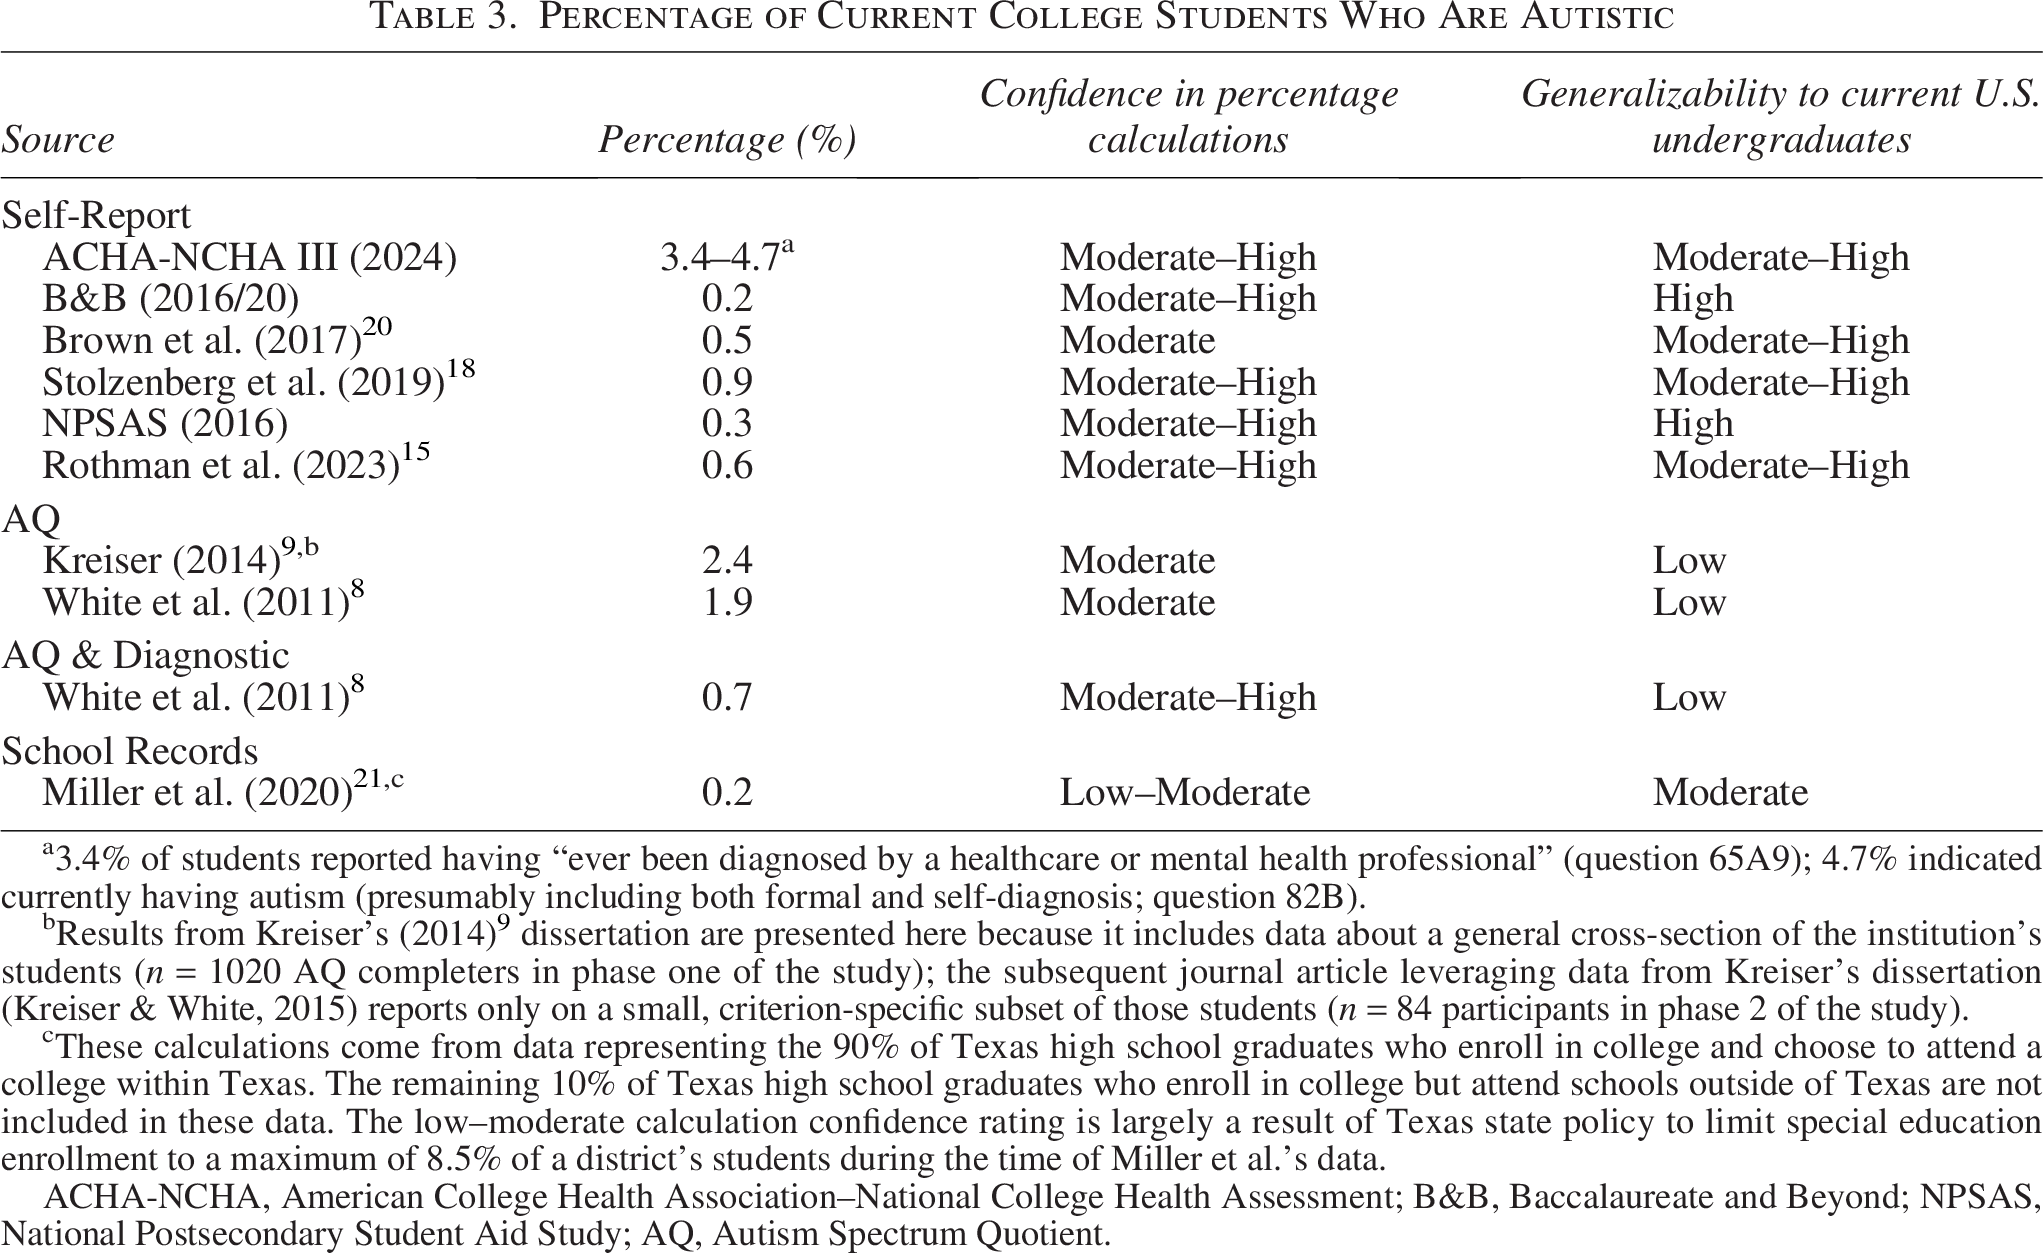
3.4% of students reported having “ever been diagnosed by a healthcare or mental health professional” (question 65A9); 4.7% indicated currently having autism (presumably including both formal and self-diagnosis; question 82B).
Results from Kreiser’s (2014) 9 dissertation are presented here because it includes data about a general cross-section of the institution’s students (n = 1020 AQ completers in phase one of the study); the subsequent journal article leveraging data from Kreiser’s dissertation (Kreiser & White, 2015) reports only on a small, criterion-specific subset of those students (n = 84 participants in phase 2 of the study).
These calculations come from data representing the 90% of Texas high school graduates who enroll in college and choose to attend a college within Texas. The remaining 10% of Texas high school graduates who enroll in college but attend schools outside of Texas are not included in these data. The low–moderate calculation confidence rating is largely a result of Texas state policy to limit special education enrollment to a maximum of 8.5% of a district’s students during the time of Miller et al.’s data.
ACHA-NCHA, American College Health Association–National College Health Assessment; B&B, Baccalaureate and Beyond; NPSAS, National Postsecondary Student Aid Study; AQ, Autism Spectrum Quotient.
Following students through educational records
The report using Texas state data 21 allows for the calculation of the percentage of Texas students attending in-state colleges who are autistic. This dataset used students’ primary disability classification in grade 12 as its indicator of autism and linked student records with the enrollment data of all public two-year and nonprofit four-year colleges and universities in Texas. For reasons outlined above, we have low–moderate confidence in the resulting prevalence calculations and consider it to have moderate generalizability. Approximately 0.16% of Texas high school graduates who went on to enroll in a Texas college were classified as autistic before or during grade 12 (see Table 3). This number is the lowest among all the sources we evaluated, possibly reflecting the undercounting of autistic students due to restrictive inclusion criteria (i.e., requiring a primary special education classification of autism) and the 8.5% cap on special education enrollment during this period of time in Texas.23,34
Self-report through multi-institution studies
Estimates coming closest to directly addressing our third research question are drawn from self-reports of autism on a wide range of multi-institution studies with varied samples (see Table 3). The lowest estimates are based on studies sponsored by IES. The 2016 NPSAS, designed to be representative of current students at Title IV institutions, indicates that roughly 0.3% of students report being autistic. Similarly, about 0.2% of recent bachelor’s degree recipients self-disclosed as autistic in the 2016/20 B&B study. The recency and completeness of data captured by NPSAS give us high confidence regarding its generalizability to all current undergraduates; we have slightly lower generalizability ratings for B&B since it reflects only those students who complete their degrees.
Estimates from surveys involving fewer institutions and specific student demographics suggest slightly higher prevalence rates. One study using data from 78 institutions across the United States found that 0.6% of respondents reported being autistic, 15 whereas a separate study surveying nine public 4-year institutions found that approximately 0.5% of all responding undergraduates reported being autistic. 20 The 2018 CIRP Freshman Survey found that 0.9% of first-time, full-time college students at 4-year institutions reported being autistic. 18
The largest prevalence estimates come from the ACHA-NCHA III, which surveyed students from 154 institutions during spring 2024. 16 Depending on question phrasing, between 3.39% and 4.73% of students reported being autistic. The range reflects two questions: one asking whether students had “ever been diagnosed by a healthcare or mental health professional” (3.39%), and the other asking whether they currently have autism (4.73%). This larger estimate is likely inclusive of students without formal autism diagnoses. Given the substantial number of institutions surveyed, the multiple questions about autism, and the contemporary nature of the data, our confidence in this estimate and its generalizability to the current cohort of U.S. undergraduates is moderate to high.
While these samples are the most representative among those we reviewed due to their inclusion of students from multiple institutions and relatively recent data collection, they still rely primarily on data from 4-year institutions. This focus is notable because autistic students are nearly twice as likely to attend 2-year institutions, 2 highlighting the need for studies that include a broader range of institutional types to produce more comprehensive estimates.
Estimating the total number of autistic college students in the United States
Drawing upon the estimates outlined above, we now turn our attention to estimating the total number of undergraduate students in the United States who are autistic. There will be 16,406,565 undergraduates in 2025, including 4,886,731 at public 2-year; 7,875,342 at 4-year public institutions; and 3,430,854 at private, nonprofit 4-year institutions. 24 To arrive at the numbers presented in Table 4, we combine these data with the estimates presented in Tables 2 and 3 for which we have at least moderate confidence in both its prevalence calculations and the generalizability of its results.
Number of Current Undergraduate Students with Autism in the United States a
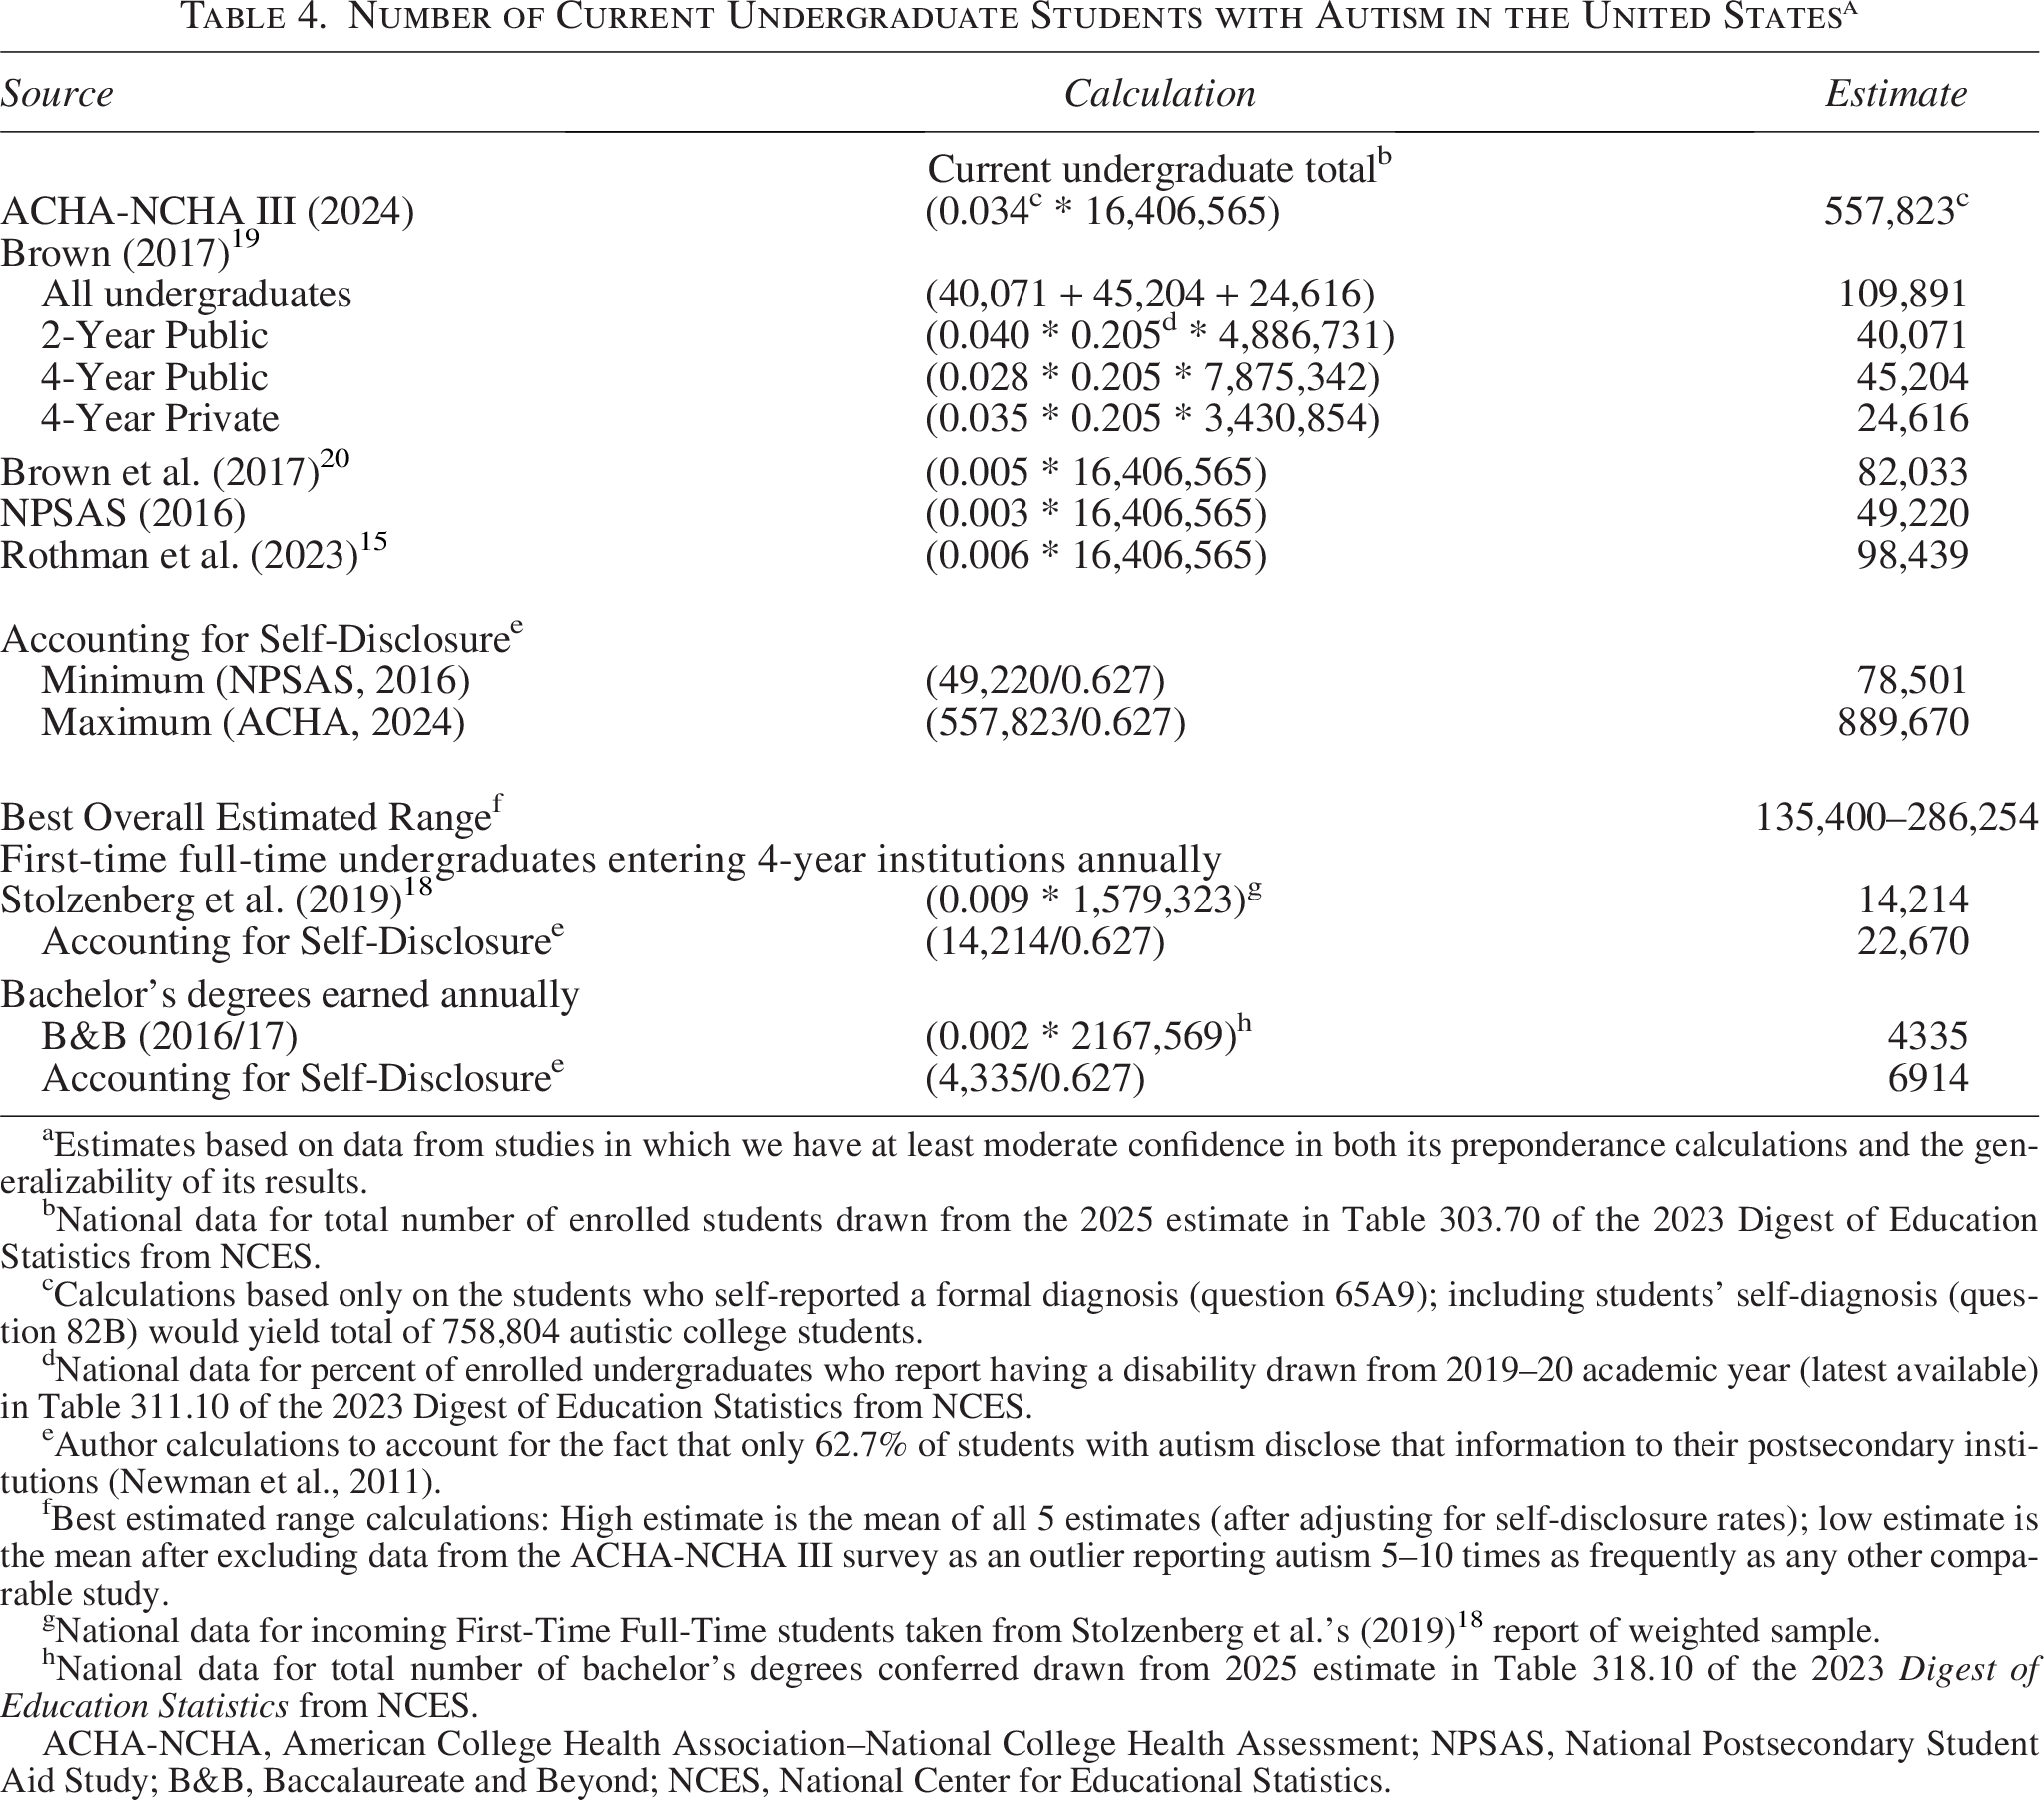
Estimates based on data from studies in which we have at least moderate confidence in both its preponderance calculations and the generalizability of its results.
National data for total number of enrolled students drawn from the 2025 estimate in Table 303.70 of the 2023 Digest of Education Statistics from NCES.
Calculations based only on the students who self-reported a formal diagnosis (question 65A9); including students’ self-diagnosis (question 82B) would yield total of 758,804 autistic college students.
National data for percent of enrolled undergraduates who report having a disability drawn from 2019–20 academic year (latest available) in Table 311.10 of the 2023 Digest of Education Statistics from NCES.
Author calculations to account for the fact that only 62.7% of students with autism disclose that information to their postsecondary institutions (Newman et al., 2011).
Best estimated range calculations: High estimate is the mean of all 5 estimates (after adjusting for self-disclosure rates); low estimate is the mean after excluding data from the ACHA-NCHA III survey as an outlier reporting autism 5–10 times as frequently as any other comparable study.
National data for incoming First-Time Full-Time students taken from Stolzenberg et al.’s (2019) 18 report of weighted sample.
National data for total number of bachelor’s degrees conferred drawn from 2025 estimate in Table 318.10 of the 2023 Digest of Education Statistics from NCES.
ACHA-NCHA, American College Health Association–National College Health Assessment; NPSAS, National Postsecondary Student Aid Study; B&B, Baccalaureate and Beyond; NCES, National Center for Educational Statistics.
Direct calculations based on these sources suggest that there are between 49,220 and 557,823 current autistic undergraduate students in the United States. However, it is important to consider that none of the estimates discussed above incorporates the fact that approximately 37% of students with formal autism diagnoses do not self-disclose once in college, 2 and some autistic individuals do not receive a diagnosis until after college.40–42 Adjusting for self-disclosure, these estimates increase to between 78,501 and 889,670 autistic undergraduate students. Such a broad range of estimates is a function of the wide variability in these studies’ timing, definitions, sources, and samples.
To improve the utility of our estimates, we ran one more set of calculations to generate our best overall estimated range for the total number of current autistic college students. The high end of that range is simply the mean of estimates derived from all five studies included in Table 4 after adjusting for self-disclosure rates. The low end of our best overall estimated range excludes data from the ACHA-NCHA III survey 16 as an outlier reporting autism 5–10 times as frequently as any other comparable study. Therefore, our best overall estimate is that there are between 135,400 and 286,254 autistic undergraduate students in the United States today.
Discussion
Our analysis is the first concentrated effort to synthesize findings from multiple sources to estimate the prevalence of autistic students in higher education. That it has taken this long for such an analysis to be undertaken is noteworthy in and of itself. Considering the prominence of the 1 in 31 statistics in conversations about autism, 1 we were surprised to discover that no such comparable calculation had been completed for older individuals generally or college students more specifically. Even studies that provide some clues or use some of the data referenced here come with substantial limitations. The lack of clear evidence about the prevalence of autistic students in higher education is a function of many intersecting factors.
First, even if we use the top end of our best estimated range, autistic students make up just 1.7% of all undergraduates in the United States. Researchers may not think that the population of autistic students is large enough to be worth identifying specifically or worth differentiating from other student identities (e.g., race/gender/age/first-generation status; students with disabilities more generally, which includes roughly 20.5% of all college students). 24 Moreover, even if researchers wanted to isolate autistic students to compare their outcomes or experiences against those of other student populations, the resulting subsample of autistic students may be too small to detect anything, but the most dramatic of statistical relationships.
Second, questions about autism must compete for space on data collection instruments. With many colleges restricting the number of surveys sent to students, and with survey length inversely correlated to completion rates,43,44 researchers must make careful decisions about which questions can be cut. Thus, while it would seem obvious that a study focused on students with disabilities would include autism as a distinct question/response option, studies on other topics may yield that space to more directly pertinent questions.
Third, the variability of language surrounding autism complicates decisions about question wording and makes cross-study comparisons difficult. Indeed, our review revealed wide-ranging variation in item structure, response options, and contextual framing. For example, the National Collegiate Health Survey includes “autism spectrum” within a list of 40 “chronic conditions” that also includes allergies, cancer, depression, HIV, and insomnia. In contrast, one recent iteration of the federal NPSAS survey makes no explicit reference to autism, but its creators perhaps considered autism to be covered by its “developmental disability” response option. In the B&B 2016/20 study, autism is only referenced within a section about “people with disabilities.” That phrasing may influence students’ responses as many autistic students do not consider themselves to be disabled. 45 Given the range of language used and assumptions around disability identity,46–48 it is easy to see how the same student might provide different answers on each instrument, complicating efforts to compare findings across studies.
One final issue affecting nearly every study of autism in higher education is the propensity for underestimation. While we attempt to account for high rates of nondisclosure 2 in our analyses, there are several additional factors that further complicate efforts to collect accurate data about the number of autistic students. For instance, many of the datasets we found identify high school students as autistic only if autism is listed as their primary IEP disability classification. This excludes students whose autism is considered “secondary” to some other disability designation. A similar phenomenon occurs within some data systems maintained by college DSOs where students who have not received a formal autism diagnosis or do not have access to the associated documentation40,41 may instead seek DSO support under a different diagnostic classification or be deemed ineligible entirely. 49
Yet addressing this issue is complicated by multiple inequities that have historically permeated the health care and education systems surrounding autistic students. Race, gender, and income/wealth gaps related to the receipt and timeliness of diagnosis have been well documented,50–52 although recent research suggests that such differences have become more nuanced over the last l5 years.53,54 Similar disparities—particularly related to race or ethnicity—exist regarding autistic youth’s use of school- or community-based support services. 55 Even the assignment of a primary autism classification in K-12 is influenced by factors such as race, urbanicity, gender, and first-language status. 56 Estimates about the number of autistic students in college are also likely to reflect these disparities, meaning both current data and efforts to account for nondisclosure rates remain likely to disproportionately underestimate the number of autistic students in these populations.
Despite those limitations, the diverse group of existing postsecondary studies explicitly inquiring about autism has yielded multiple data sources from which we can develop at least tentative calculations to estimate the prevalence of autistic students within higher education. With potentially more than 280,000 autistic undergraduate students currently pursuing degrees in the United States—a number sure to increase over the coming years—it seems the population of autistic college students may have reached a critical mass 7 that warrants explicit attention by scholars and practitioners. These findings have important implications for a wide range of stakeholders.
Implications for families, educators, and pre-college students
Parents of autistic young people, K-12 special education teachers, guidance counselors, and IEP teams may find the range of estimates relevant for their efforts to support autistic students. For example, knowing that many autistic high school students pursue postsecondary education (RQ1) and that there is a significant number of college students who are autistic (RQ3) may encourage higher expectations for autistic high school students. Research indicates that high expectations are important predictors of student success, 57 including for disabled students.58,59 Similarly, parental expectations of college are a significant predictor of autistic students’ own college expectations. 60 Recognition of college as a viable option for autistic students can increase the likelihood that college transition goals and supports are added to students’ IEPs.
Of course, IEP plans vary in quality. 61 They may not propose goals that adequately prepare autistic students for life after high school, including college, without significant advocacy on the part of the autistic student, their parent(s), and IEP team members with high expectations. 62 And while IEP meetings are required to focus on transition by age 16, 63 students and parents may feel like goals relevant to the pursuit of postsecondary education come too late for students to fully develop these skills and knowledge. 64 Therefore, adding college preparation goals early in high school may help autistic students search for and apply to colleges, make informed decisions, and feel academically and socially prepared for the transition.
Finally, for autistic young people themselves, knowing that tens or hundreds of thousands of other autistic individuals go to college may increase their interest in this path. Autistic youth and adults frequently value opportunities to develop relationships with other autistic people,65,66 and perceiving college as a place for meaningful social opportunities is associated with greater well-being in autistic college students. 67 Our findings may encourage incoming autistic students to look for community among peers they now know are likely to be on campus.
Implications for postsecondary leaders
As highlighted in RQ1, a considerable number of autistic high school students go on to college, a trend expected to continue given the rising autism prevalence estimates over the past two decades68,69 and our evolving understanding of how to effectively support autistic K-12 students. And as we note in our discussion of RQ2, the data commonly available to university administrators, such as the number of autistic students registered with their university’s DSO, often fail to capture the true size of this student demographic. This limited awareness may contribute to reluctance to devote significant financial resources to support a group that is, numerically, only a small proportion of a university’s broader student body. Access to a more accurate estimate of the autistic college student population in the United States (RQ3) can help advocates contextualize university-specific estimates and provide decision-makers with a more comprehensive understanding of the need for resources and support.
We encourage readers in postsecondary administrative roles to consider the number of autistic college students in the context of the broader higher education landscape. While it might be assumed that the primary responsibility for supporting autistic college students falls on DSOs, relying solely on DSOs is an inadequate and unsustainable position; the increasing number of autistic individuals pursuing higher education in the United States coupled with the understaffing and underfunding of DSOs 70 necessitates a campus-wide approach focused on acceptance, inclusion, and accessible support.71,72 This necessitates increasing resource allocations not only at individual institutions but also at local, state, and federal levels to support this growing student population.
Of course, moving from an awareness of the size of this population to developing and implementing tangible supports may seem daunting. Working against established systems that are misaligned with the diverse needs of autistic students49,73 presents challenges at multiple levels, from the number of task demands placed on individual change-makers to staffing and funding constraints. 70 However, campus leaders and staff do not have to navigate this process alone. A growing body of literature offers insights into how to support autistic college students,74,75 underscoring the importance of seeking input from autistic students themselves.72,76
Finally, there are networks of higher education professionals and researchers that collaborate to share insights about supporting autistic students. Institutions are increasingly creating autism-specific support programs, 33 with peer-reviewed literature documenting and evaluating their development77,78 and potentially providing guidance for developing a program at one’s own institution. In addition, incorporating principles of universal design for learning 79 across university operations—not just within classrooms—may decrease the number of barriers encountered by autistic students. This may reduce the number of formal accommodation requests that DSOs, faculty, and administrators need to manage. Several organizations (e.g., Association on Higher Education and Disability, Center for Applied Special Technology, College Autism Network) provide helpful resources, peer support, and training.
By reframing the support of autistic college students as a collaboration rather than placing the entire responsibility on individual DSOs and institutions, administrators can tap into the growing cross-university resources and infrastructure developed in response to the influx of autistic students on the scale documented here. This approach can support campus leaders as they advocate for resources and support, recognizing that even a small autistic population on a college campus is part of a larger, interconnected whole.
Implications for researchers
Researchers across various disciplines with an interest in autism, including higher education, special education, autism in adolescence and adulthood, and disability studies, likewise may find our estimates useful. Our estimates make clear that autistic college students are an understudied population of sufficient size around which emerging scholars can build a professional identity or develop a fruitful line of inquiry. The size of the population likewise highlights the potential for scholars to explore multidisciplinary collaborations addressing shared interests and complementary theories or methods. Scholars who seek to broaden the impact of their work can offer our estimates of autistic students as justification for inclusion within journals whose editors, reviewers, or readers may have heretofore thought the topic too niche or the population too small to warrant publication.
Thus, there is a clear need for the development of large-scale, multi-institutional datasets from which researchers could continuously monitor the number, distribution, and characteristics of autistic college students. Our calculations can help scholars generate evidence-grounded estimates of potential sample sizes when proposing studies targeting specific populations (e.g., community college vs. university students) or using particular recruitment strategies or data sources. Perhaps just as importantly, we hope our discussion of the limitations of each existing data source and the wide-ranging estimates resulting therefrom encourages scholars to pursue work from which we can draw more precise and generalizable estimates.
Future research also ought to consider a broader range of autistic individuals on college campuses. Some autistic undergraduates go on to pursue graduate degrees or join the professoriat.80,81 Graduate education generally is quite different from undergraduate 82 ; students’ experiences of autism likely have different effects as well. The hyperfocus typical of autistic individuals may yield intellectual benefits as they pursue highly specialized areas of study. However, seeking a faculty job often requires extensive in-person networking with unfamiliar people in unscripted situations at crowded conferences, 83 situations that can be environmentally and socially discomforting for many autistic individuals.84,85
Likewise valuable would be longitudinal studies following students from high school, through college, into graduate school, and out into the workforce. Such studies, however, would require considerable time and resources to complete. 86 Tracking students across these environments may take a decade or longer. Maintaining an adequate sample size through multiple waves of data collection would need a large base-year sample with monetary incentives 87 and barrier reduction strategies 88 for continuing participants. Studies of this scale would require a large and long-term investment from a constellation of foundation and government sources. However, the federal agenda for autism research—and the vast majority of funding for associated research—has emphasized early identification, clinical or K-12 intervention, or biological causes. 89 Therefore, we hope our estimates prompt both federal and private funders to provide increased financial support to studies focused on autistic students in higher education.
Conclusion
Of the approximately 3.6 million American children born each year, 90 roughly 3.2% or 116,000 are autistic. Of those who grow up and complete high school, approximately 43%–47% will subsequently pursue higher education. Yet, these students—the roughly 135,400 to 286,254 autistic individuals currently enrolled in colleges and universities—have long been overlooked and underserved by K-12 systems, postsecondary institutions, government agencies, and academic researchers.
Our calculations clearly demonstrate that this population is large enough to warrant more widespread attention from families, educators, policymakers, researchers, and funders. Now it is up to each of those stakeholders to translate this increased awareness into tangible actions. Doing so can help maximize the long-term well-being of autistic individuals and the contributions these individuals make to the educational, professional, personal, and societal environments in which they live.
Footnotes
Authorship Confirmation Statement
B.E.C. conceived of the article and coordinated the development thereof. C.R.K. and C.B.F. led the search for relevant literature, survey instruments, and government datasets in 2019; K.M.S. led a new round of those activities in 2024. B.E.C. led the calculations based on data extracted from those sources, with the assistance of K.M.S., C.R.K., and C.B.F. B.E.C., C.R.K., and C.B.F. wrote the first draft of the article; K.M.S. led subsequent revisions alongside B.E.C. The article has been submitted solely to this journal and is not published.
Author Disclosure and Ghostwriting
All authors report that no competing financial interests exist.
Funding Sources
This study did not receive funding.