
Abstract
Recent mining technology innovations such as robust shovel bucket mounted sensors allow ore grades to be measured at the mine face for every scoop and truck during extraction. There are currently limited established methods for estimating the ore control benefits of enhancing mining selectivity at a given deposit. A discretisation method is presented using blasthole grades where a selective mining unit block is first discretised to truck or shovel bucket sized subblocks. Subblock grades are assumed to follow a distribution with the same average grade as the host block and the variance scaled from locally surrounding blastholes. The ore control benefits are quantified by comparing the ore and waste grade tonnage of the coarser original blocks to the more selective subblocks. The discretisation methodology is applied reducing the selective mining unit on 2 months of production data from three distinctly heterogeneous open pit mines. Discretising to truck sized blocks resulted in a 10–30% decrease in dilution and ore loss depending on the coefficient of variation, strip ratio, average grades above and below cut-off, and spatial continuity. Operational considerations for bulk ore sorting are provided as productivity could be impacted as a tradeoff for the enhanced selectivity.
Introduction
Ore loss and waste dilution are inevitable in current mining operations due to natural ore variability and operational complexity, which challenges accurate ore control. Increasing degree of ore loss and dilution have been observed to be a function of deposit variability (Amirá et al., 2019) and grade control practices during extraction (Vasylchuk and Deutsch, 2018). The accurate sorting of material, especially along ore/waste contacts, is a significant challenge in the mining industry today where routine grade control relies on the measurement of element grades for samples from boreholes and estimation of these element grades to the rock volume (Toconasa et al., 2022). Blastholes used for open pit ore control are drilled and sampled on a typically staggered grid with a spacing of 5 to over 10 m, depending on the material being blasted. A dig plan that consists of a series of dig polygons for which the average material classification is estimated is generated either from the blasthole sample grades directly or from a grade control block model that was populated from those blasthole grades. In certain situations, dig polygons are adjusted for blast movement and estimation is monitored by geologists at the mine face, but not always.
The sparsity of grade measurements, difficulty of accurately sampling a blasthole, smoothing introduced through estimation and material displacement due to blast movement severely limit the performance of the current grade control processes (Rossi and Deutsch, 2013). Gerst (2008) demonstrates that how the deposit type has a large influence on the variance and grade continuity and this heterogeneity exacerbates the ore control challenges faced during extraction as more ore and waste will be in close proximity. Furthermore, all decisions based on this model are made at the current selective mining unit (SMU), which depends on the equipment being used, bench height, and various other parameters, but is always significantly larger than the truckload support often consisting of hundreds of truckloads.
Real time grade measurement technologies in recent years are starting to allow for bulk ore sorting opportunities at the mine face. Significant value can be achieved through bulk ore sorting by reducing the amount of ore loss to the waste stream and removing waste from material destined for processing. Currently only a few in pit solutions exist such as shovel bucket mounted X-ray fluorescence (XRF) sensors (Faraj et al., 2023) or the fully mobile surge loader which can be mounted with different sensors such as or prompt gamma neutron activation analysis or XRF based on the orebody (Aguayo et al., 2021; Moore, 2023). Belt mounted sensors with bulk ore sorting capabilities also exist but can only unlock a fraction of the total bulk ore sorting value as only the processed waste sent to the conveyor would be diverted reducing dilution but not recovering any additional ore.
The adoption of any new technology, especially in mining, requires an assessment of its value, cost of ownership and amenability to a given deposit (Sánchez and Hartlieb, 2020; Walter et al., 2022). Evaluation of the bulk ore sorting value will become more important as mines consider implementing sensor-based ore sorting systems and decide on the optimal loading units for shovel sensor installations. Few published studies exist that quantify and validate the potential value of bulk ore sorting, because sorting at the scale of the bucket or the truck was not feasible (Li et al., 2019, 2021). There is also a lack of understanding on how the scale of sorting and the variability of a deposit affect the value that can be derived from bulk ore sorting or how the current selectivity of a mine can handle its natural complexity.
This article seeks to establish a workflow for predicting the ore control benefits of mining with enhanced selectivity completing previous work validated by Faraj et al. (2022) and now extending to applications beyond porphyries to study distinctly heterogeneous deposits. The goal is to assess the recoverable grades and tonnages using bulk ore sorting systems assuming they can estimate grades with enough accuracy to distinguish ore/waste. The article is organised as follows: Section ‘SMU discretisation methodology to truck or shovel bucket subblocks’ describes the developed methodology for discretising coarser SMU to truck or shovel bucket sized subblocks. The discretisation is applied on 2 months of production data from three distinctly heterogeneous mines and the results are summarised in section ‘Application on various deposits with variable heterogeneity’. The potential and considerations of mining with enhanced selectivity is discussed in section ‘Discussion’ where the heterogeneity and other key variables influencing the bulk ore sorting benefits are also identified. Finally, the conclusions of the work are presented in section ‘Conclusions and future work’.
SMU discretisation methodology to truck or shovel bucket subblocks
The discretisation uses only the blasthole data and a few user defined inputs such as the SMU size and desired selectivity. The discretisation is conducted in 2D one bench at a time and is extended to 3D by repeating the procedure for each subsequent bench. The proposed approach is summarised in four steps and each is described further in the subsections below:
The SMU block is discretised to truck or shovel load sized subblocks The variance and if required the grade of each SMU block are estimated from local surrounding blastholes within a predefined search radius The variance for each SMU block is reduced to the discretised support size Grades are stochastically drawn from a selected distribution and assigned to each of the subblocks using the grade and reduced variance of the original selective mining unit block.
SMU to truck or shovel subblock tonnage discretisation
First the SMU blocks need to be discretised to truck or shovel bucket sized subblocks. The number of resulting discretised blocks will depend on the volume and density of the original SMU block which can be simply calculated using
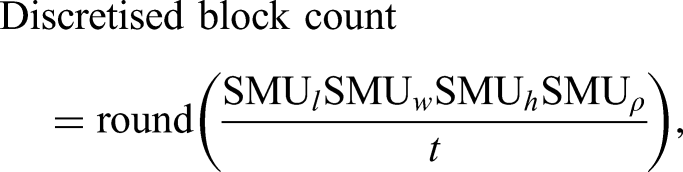
Schematic of the discretised block count from the SMU with a density of 2.55 t/m3 and typical truck and shovel bucket tonnages from large open pit mine equipment.
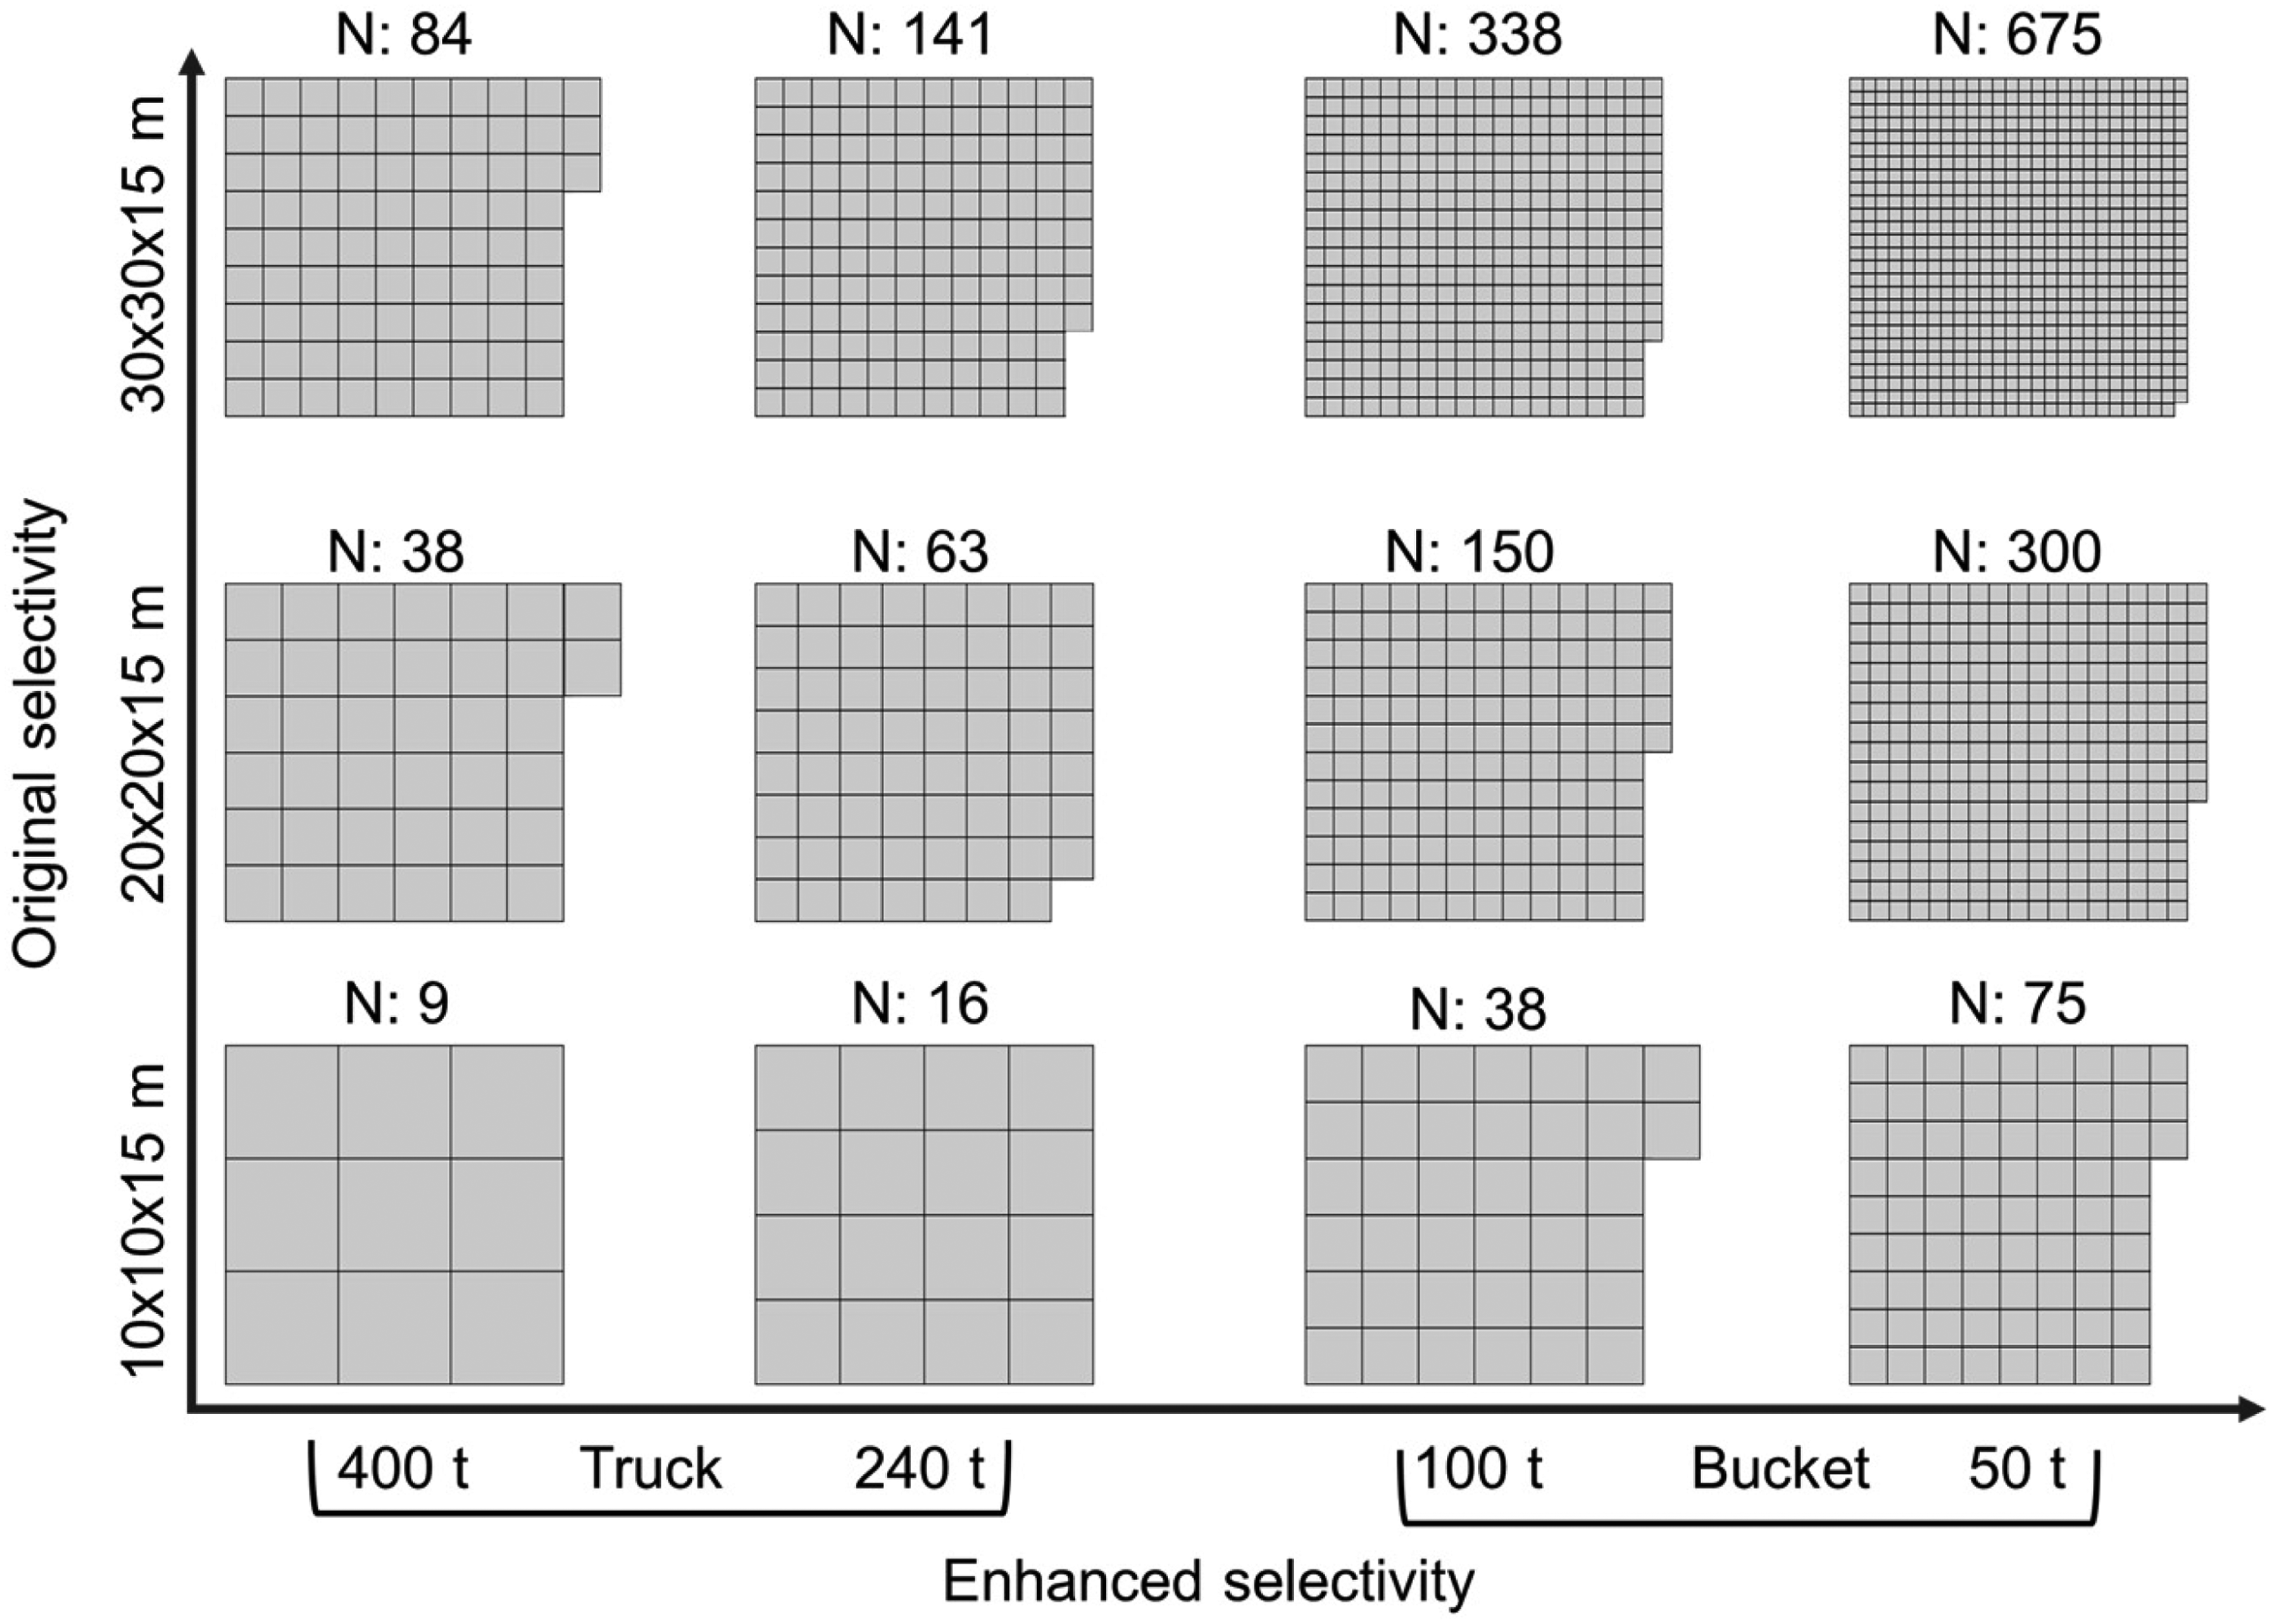
Schematic of a 25 m radius local surrounding blasthole search to calculate a grade variance to the block. Modified from Faraj et al. (2022).
Grade and variance estimate from local blastholes
If the grade of each SMU block is not known, it can be estimated from blastholes using any method. If the blastholes at a given deposit are preferentially sampled, they must be declustered before doing any kind of grade or variance estimate. To draw the variance for each SMU block a radius is specified and for each block the variance is calculated with the blastholes within the search radius of the block centroid. Note the grade estimation approach uses only local grade variances rather than rely on global variances. Previous tests on search radii indicate that a practical radius of 1.25–1.75 times the dimension of the block is adequate (Faraj et al., 2022).
Change of support and volume variance relation
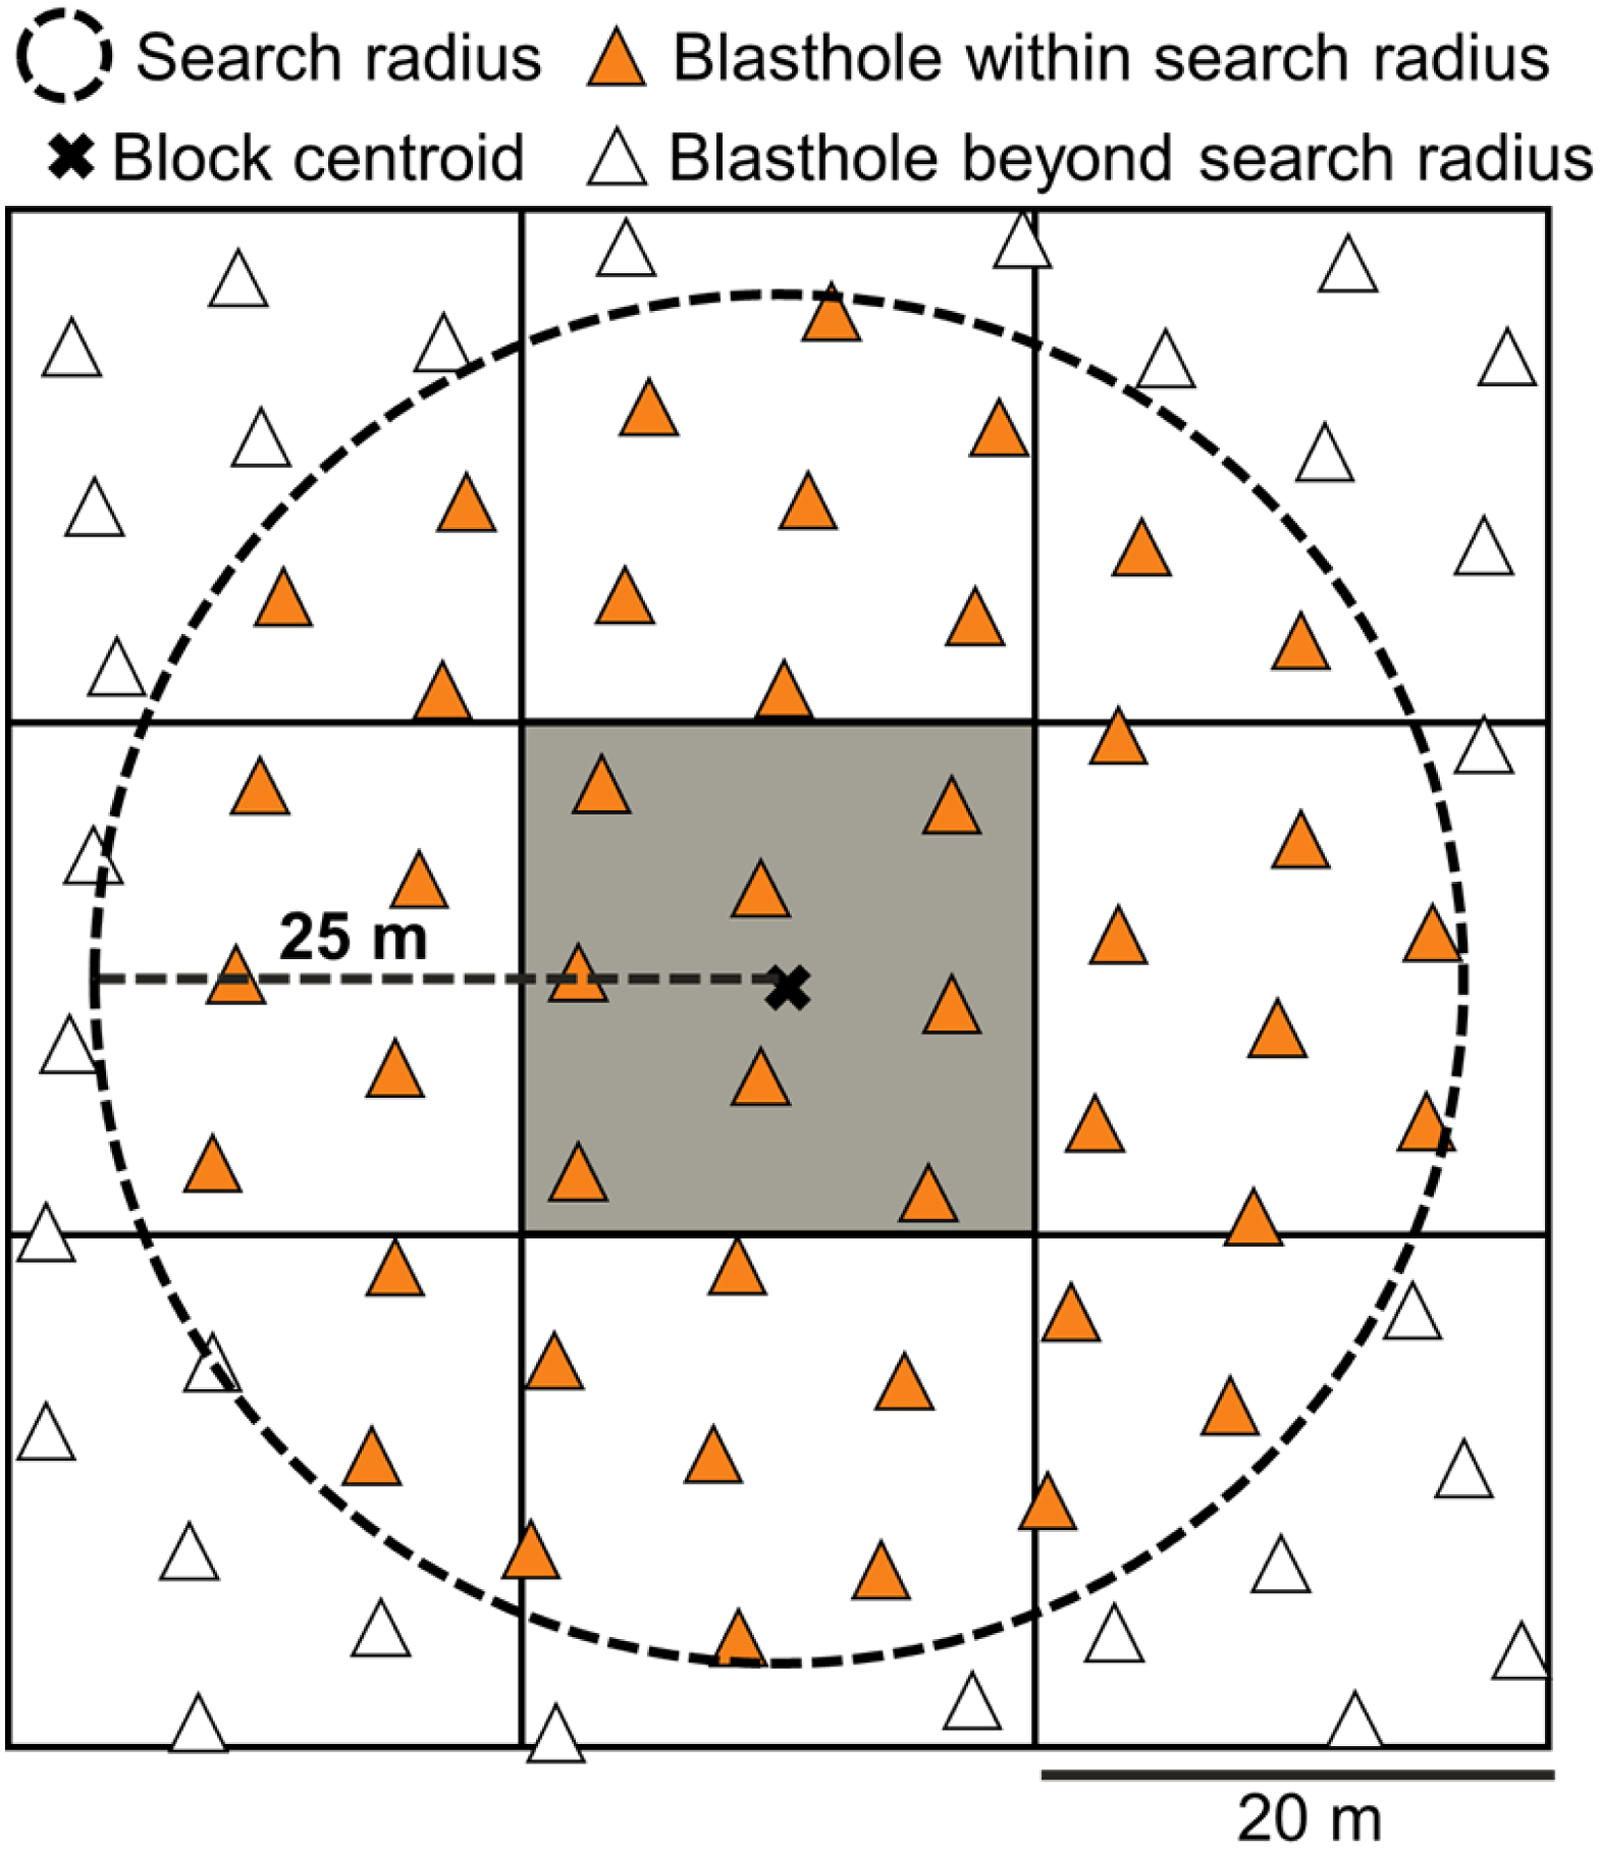
After the blasthole variance for each block is drawn from the local surrounding blastholes it must be reduced following the volume variance relation and change of support from individual blastholes to discretised blocks. The variogram model and discretising dimensions can be used to calculate the variance reduction factor. More discontinuous grades will have a larger variance reduction factor than more continuous grades since the highs and lows of more nuggety deposits will undergo a larger degree of smoothing. For example, considering two identical sets blasthole grades spatially distributed differently results in variance reduction factors ranging by over a factor of two from 68% to 29% for the discontinuous and continuous deposit respectively when discretising from blastholes to 20 × 20 m blocks (Figure 3). For each SMU block the variance is reduced by the variance reduction factor to draw the grades at the corresponding variance for the selected support and spatial continuity.
Comparison of two synthetic cases where the blasthole grade distribution is identical but varies spatially resulting in blasthole variance reduction factors of 29% and 68% for the continuous and discontinuous grades, respectively.
Distribution based grade assignment for discretised blocks
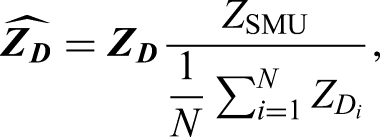
After the grade and reduced variance is known for each SMU block, discretised block grades are stochastically drawn from a selected distribution. Ore grades or deleterious element concentrations are always positive and usually have skewed distributions. They tend to fit and are typically represented using lognormal or gamma distributions depending on the length of the tail (Switzer and Parker, 1976). Any distribution can be selected and statistical tests can be done to see which distribution best fits the blasthole data. To ensure a metal balance between the discretised blocks and host SMU block, they need to be adjusted by a factor by comparing the average discretised block grade calculated using
Once a distribution is chosen the grades are assigned to the discretised blocks. The spatial position of each subblock within the SMU block will not have a significant effect in the univariate case since the discretised grades will simply be compared to their host block grade. If multiple elements are being discretised to calculate an equivalent grade, incorporate deleterious, or determine a net smelter return, each element needs to be matched such that multivariate correlations and relationships between elements are recreated and preserved best matching the blasthole data. For purely aesthetic and visualisation purposes, the grades are sorted following the local spatial distribution high and low spatial distribution of the blastholes grades. The drawing of discretised block grades is repeated for all SMU blocks until each has its corresponding set of subblocks.
Depending on the mean and variance of the SMU, the discretised block grades will have ore control benefits as ore and waste is more clearly segregated reducing dilution and ore loss. Figure 4 shows how 25 discretised subblock grades are drawn using a gamma or lognormal distribution from a host block indicating opportunities to reduce dilution and recover more ore from the original block. As the mean grade is closer to the cut-off and variance increases, the amount and degree of preventable dilution and ore loss increases.
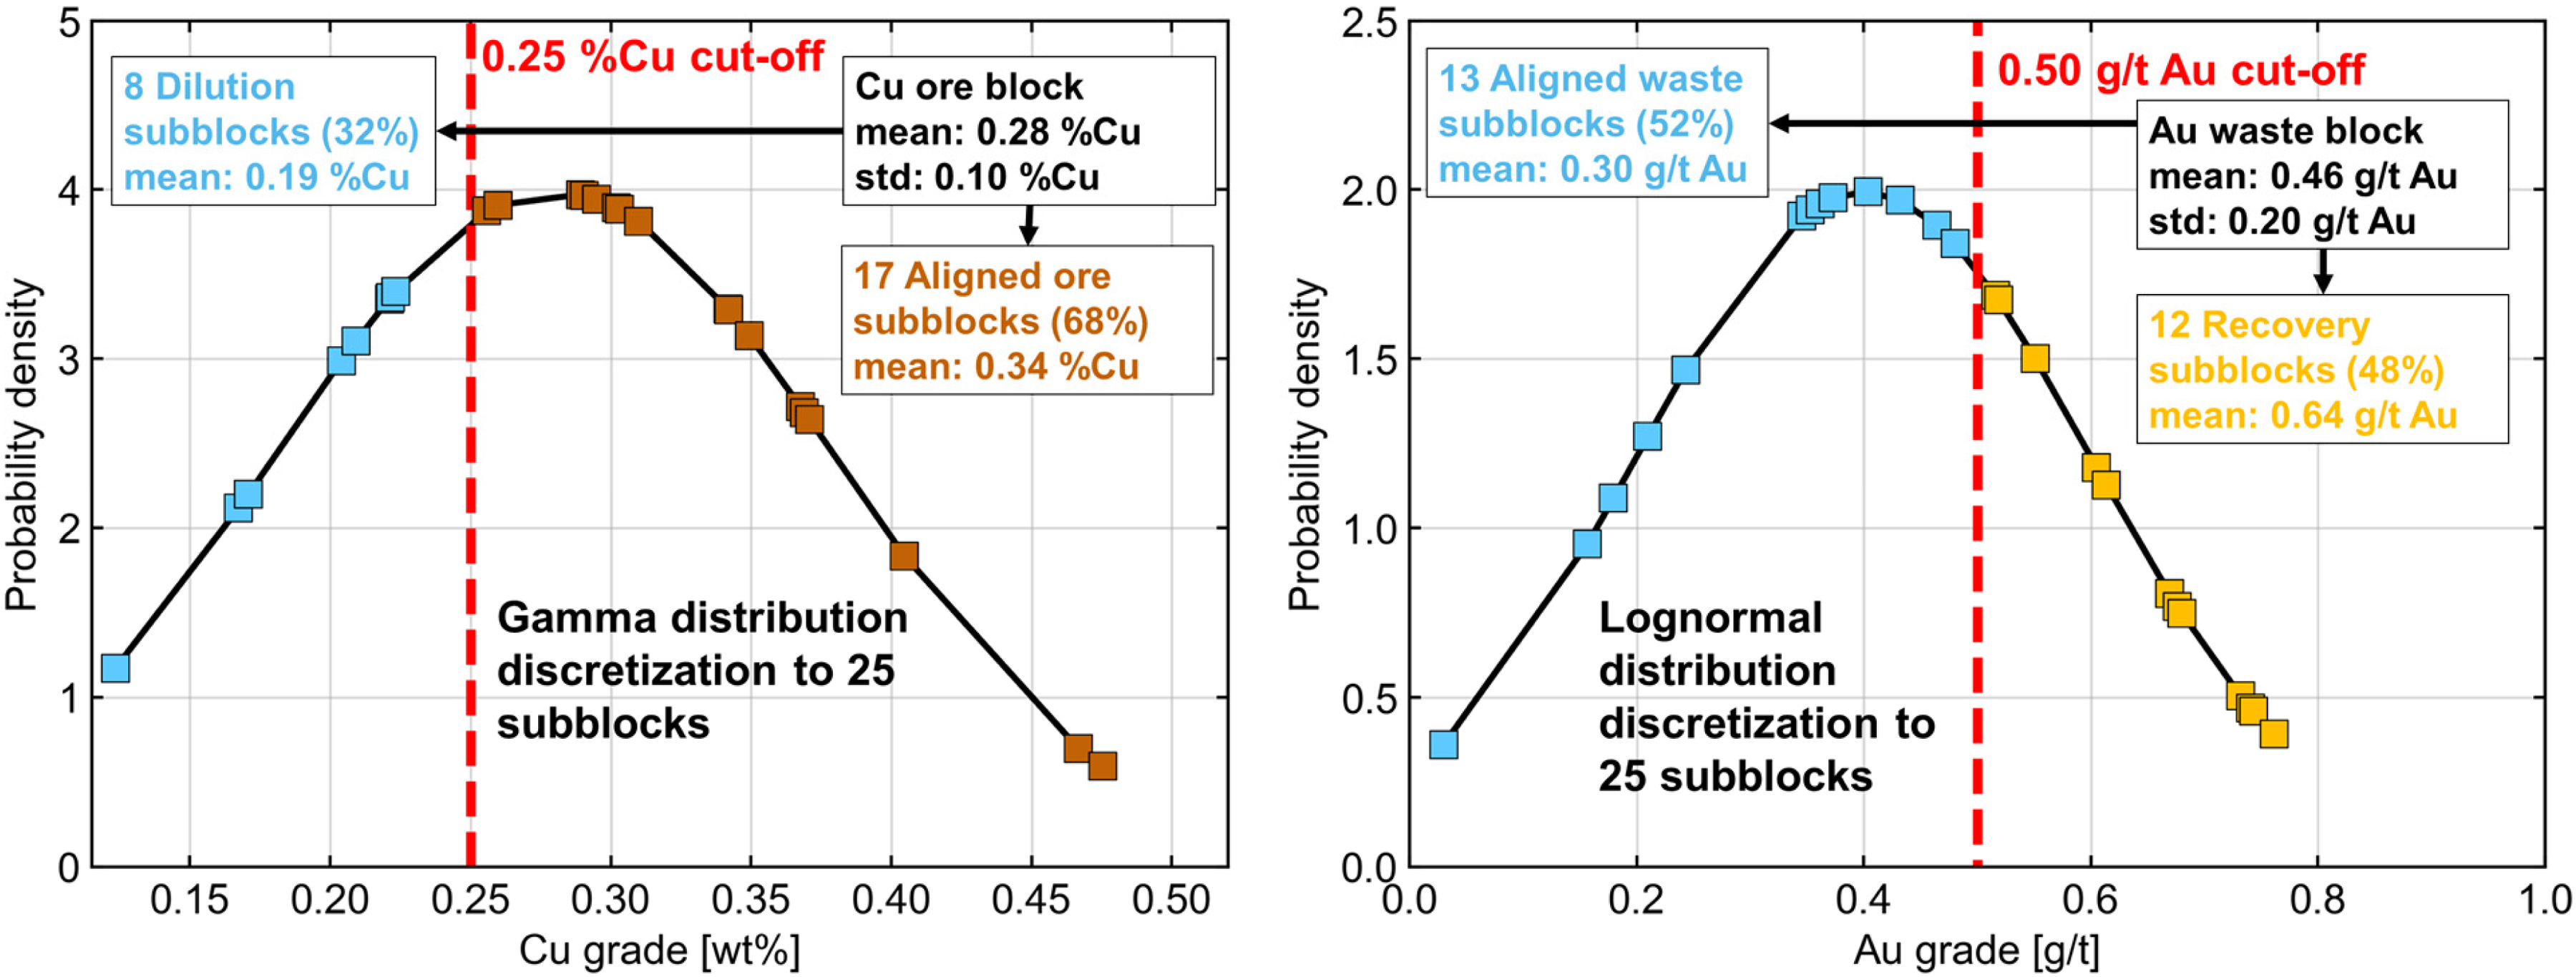
Probability density functions for a Cu ore block and Au waste block discretised to 25 subblocks with a gamma and lognormal distribution respectively highlighting dilution reduction and ore recovery opportunities.
Application on various deposits with variable heterogeneity
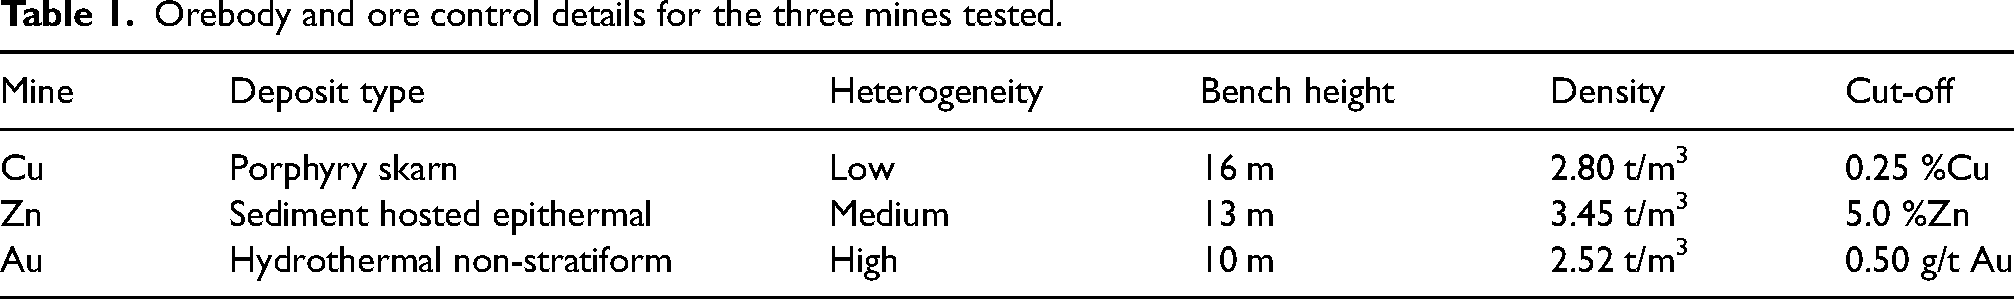
Blasthole data from three open pit mines with varying heterogeneity are used to evaluate the ore control benefits from enhanced selectivity at each mine. The three mines cover a wide range of spatial continuity and grade variability and consist in order of increasing heterogeneity of a continuous porphyry skarn Cu deposit, discontinuous sediment hosted epithermal Zn deposit with high grade contrasts, and a highly discontinuous hydrothermal non-stratiform vein hosted Au deposit. Each mine has distinct bench height and density which will impact the amount of discretised subblocks for each SMU block (Table 1). The blasthole data all comes from a single bench and the increasing heterogeneity and more prominent, sharper ore/waste contacts can be clearly seen in the spatial distribution of the blasthole data (Figure 5).
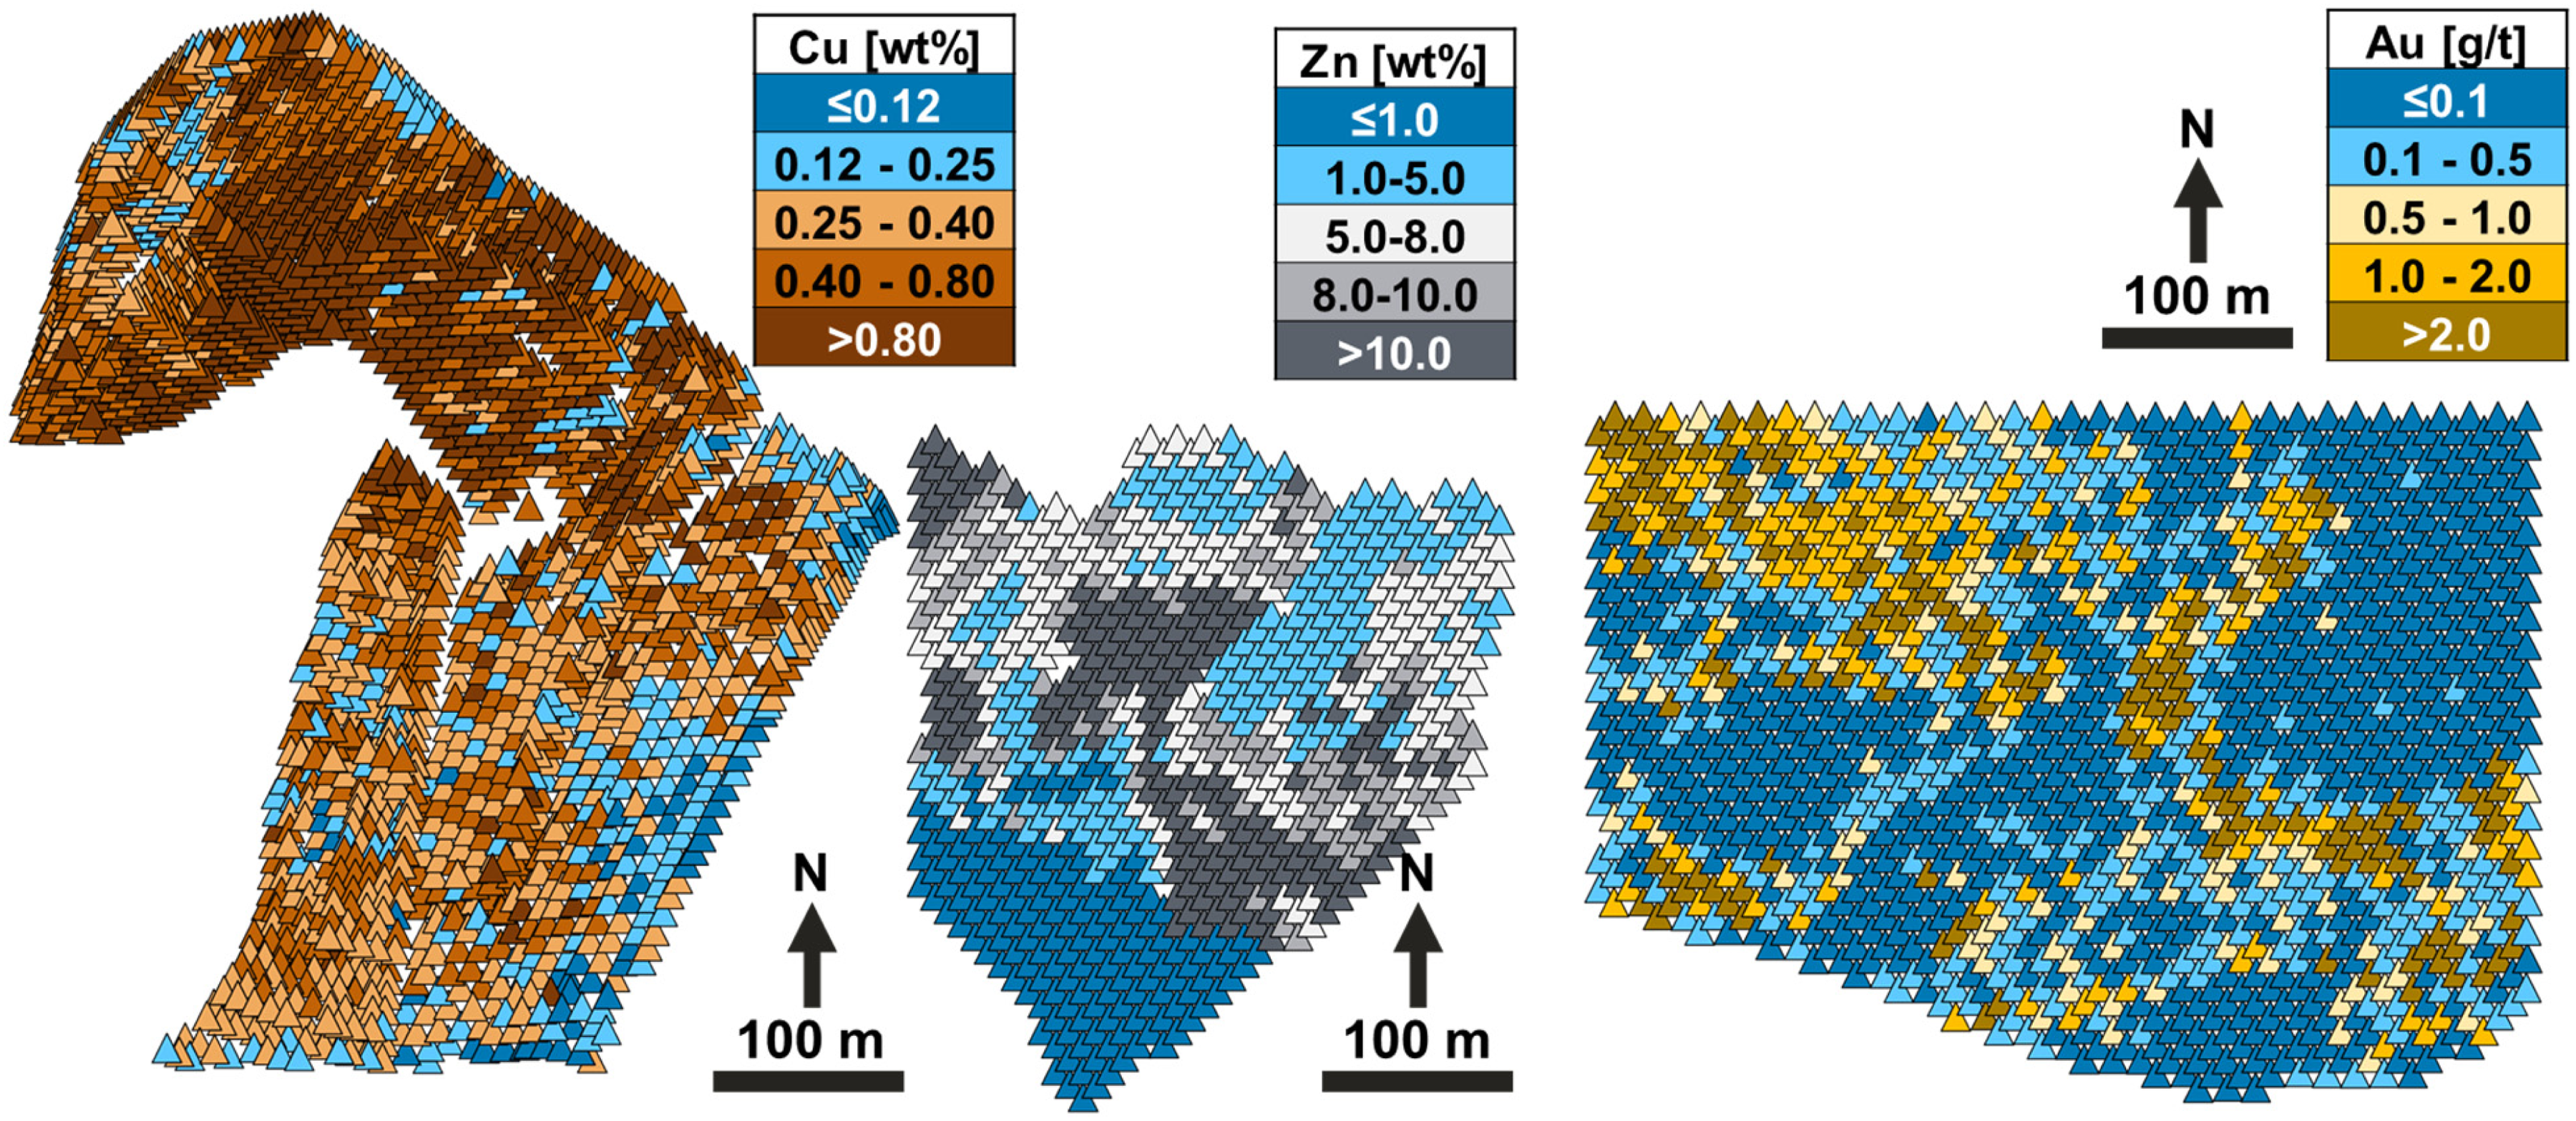
Spatial plots of the blasthole information available throughout the bench for the Cu, Zn and Au mine.
Orebody and ore control details for the three mines tested.
The variance reduction factor applied at each of the deposits will vary since the spatial continuity of the grades at each mine is distinct. The Cu mine is the most continuous with a relative nugget of 0.15 followed by the Zn mine which has a relative nugget of 0.2 and lastly the Au mine with a relative nugget of 0.35. The range also increases for the more discontinuous mines as shown with the omnidirectional variogram in Figure 6 demonstrating the difference in the spatial continuity of the ore grades at each mine. Despite the more discontinuous mines having a larger variance reduction factor, the benefits from mining with enhanced selectivity will be greater than continuous mines since there will be more dilution and ore loss. As more smoothing occurs, the grades tend to be closer to the critical cut-off grade, making the material classification more difficult. The smoothing effect is more significant in marginal deposits where the average grade is close to the economic cut-off grade.
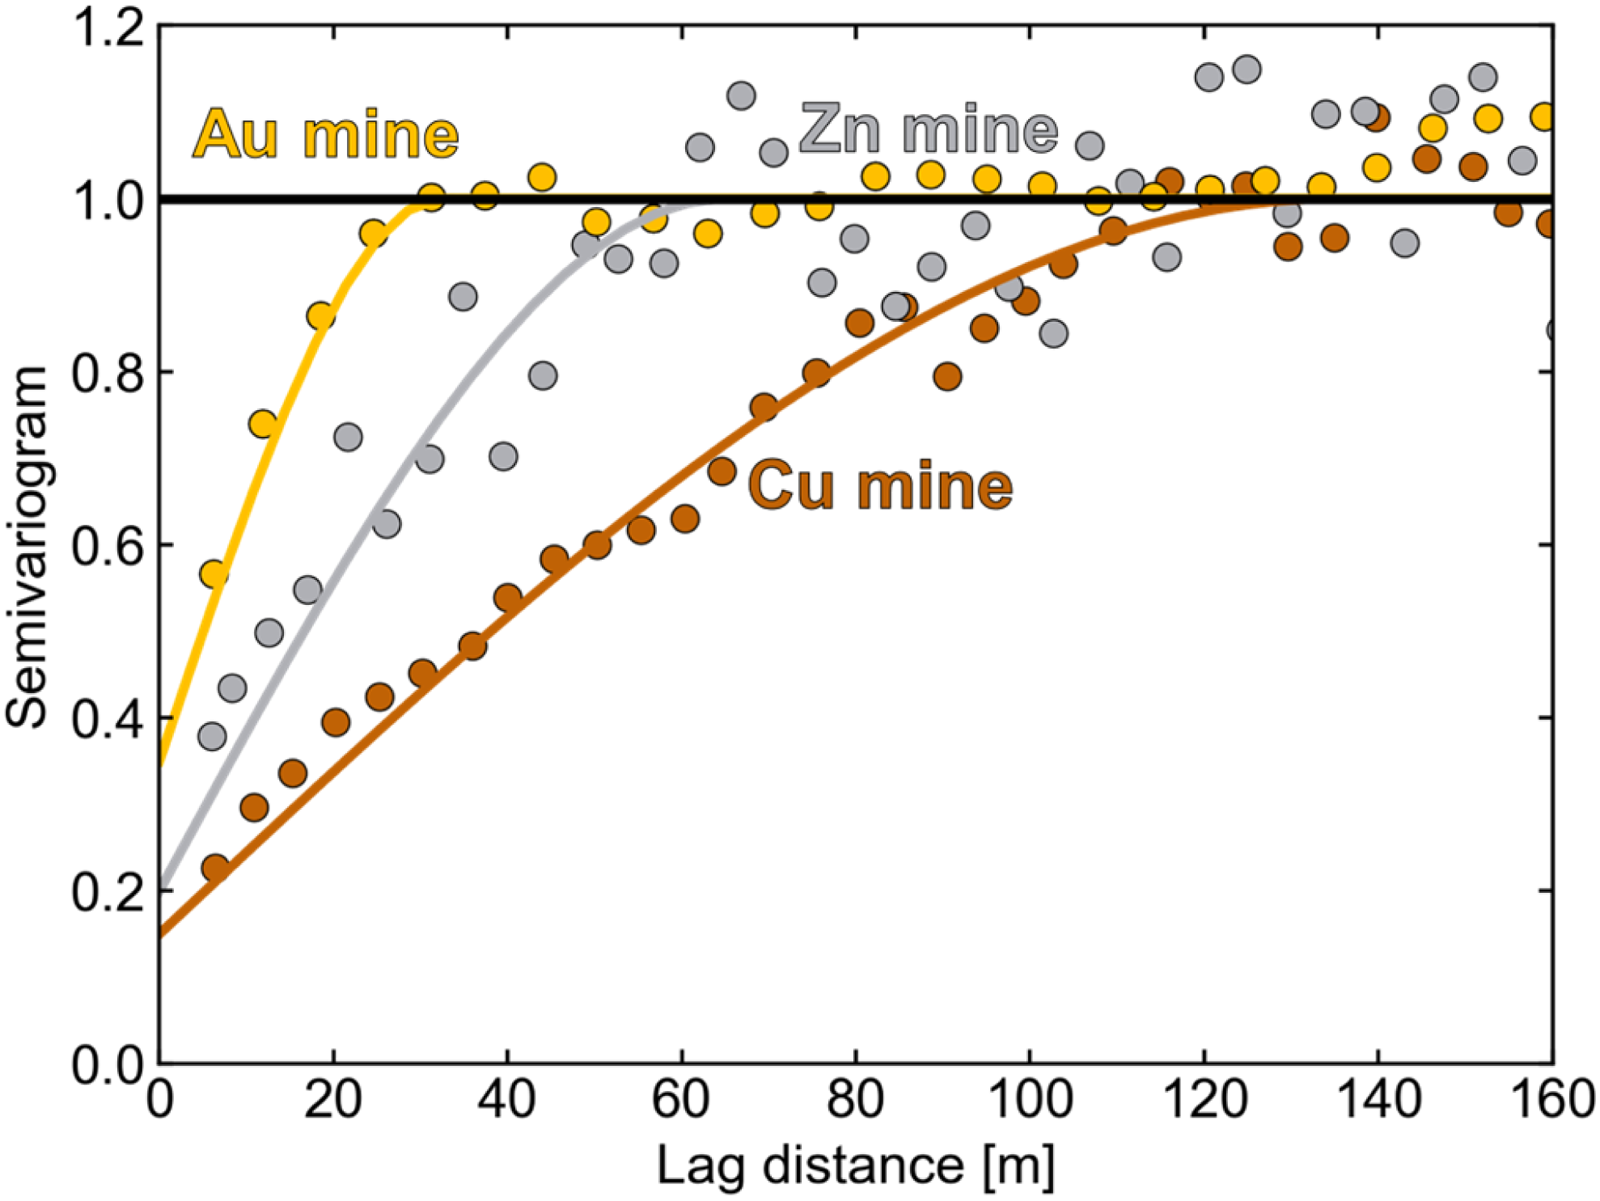
Omnidirectional variograms for the Cu, Zn and Au mine.
The SMU for all three mines was varied laterally from 10 × 10 m to 30 × 30 m, the larger SMUs are calculated by averaging the corresponding number of adjacent 10 × 10 m blocks. The discretisation to shovel bucket sized blocks are done from the 10 × 10 m SMU depending on the discretisation tonnage, density, and bench height of each mine. Four adjacent shovel bucket sized blocks are averaged to determine the truck support block grades. The data was assessed at five distinct selectivities for each deposit and blocks aggregated as shown in Figure 7 for the Cu mine.
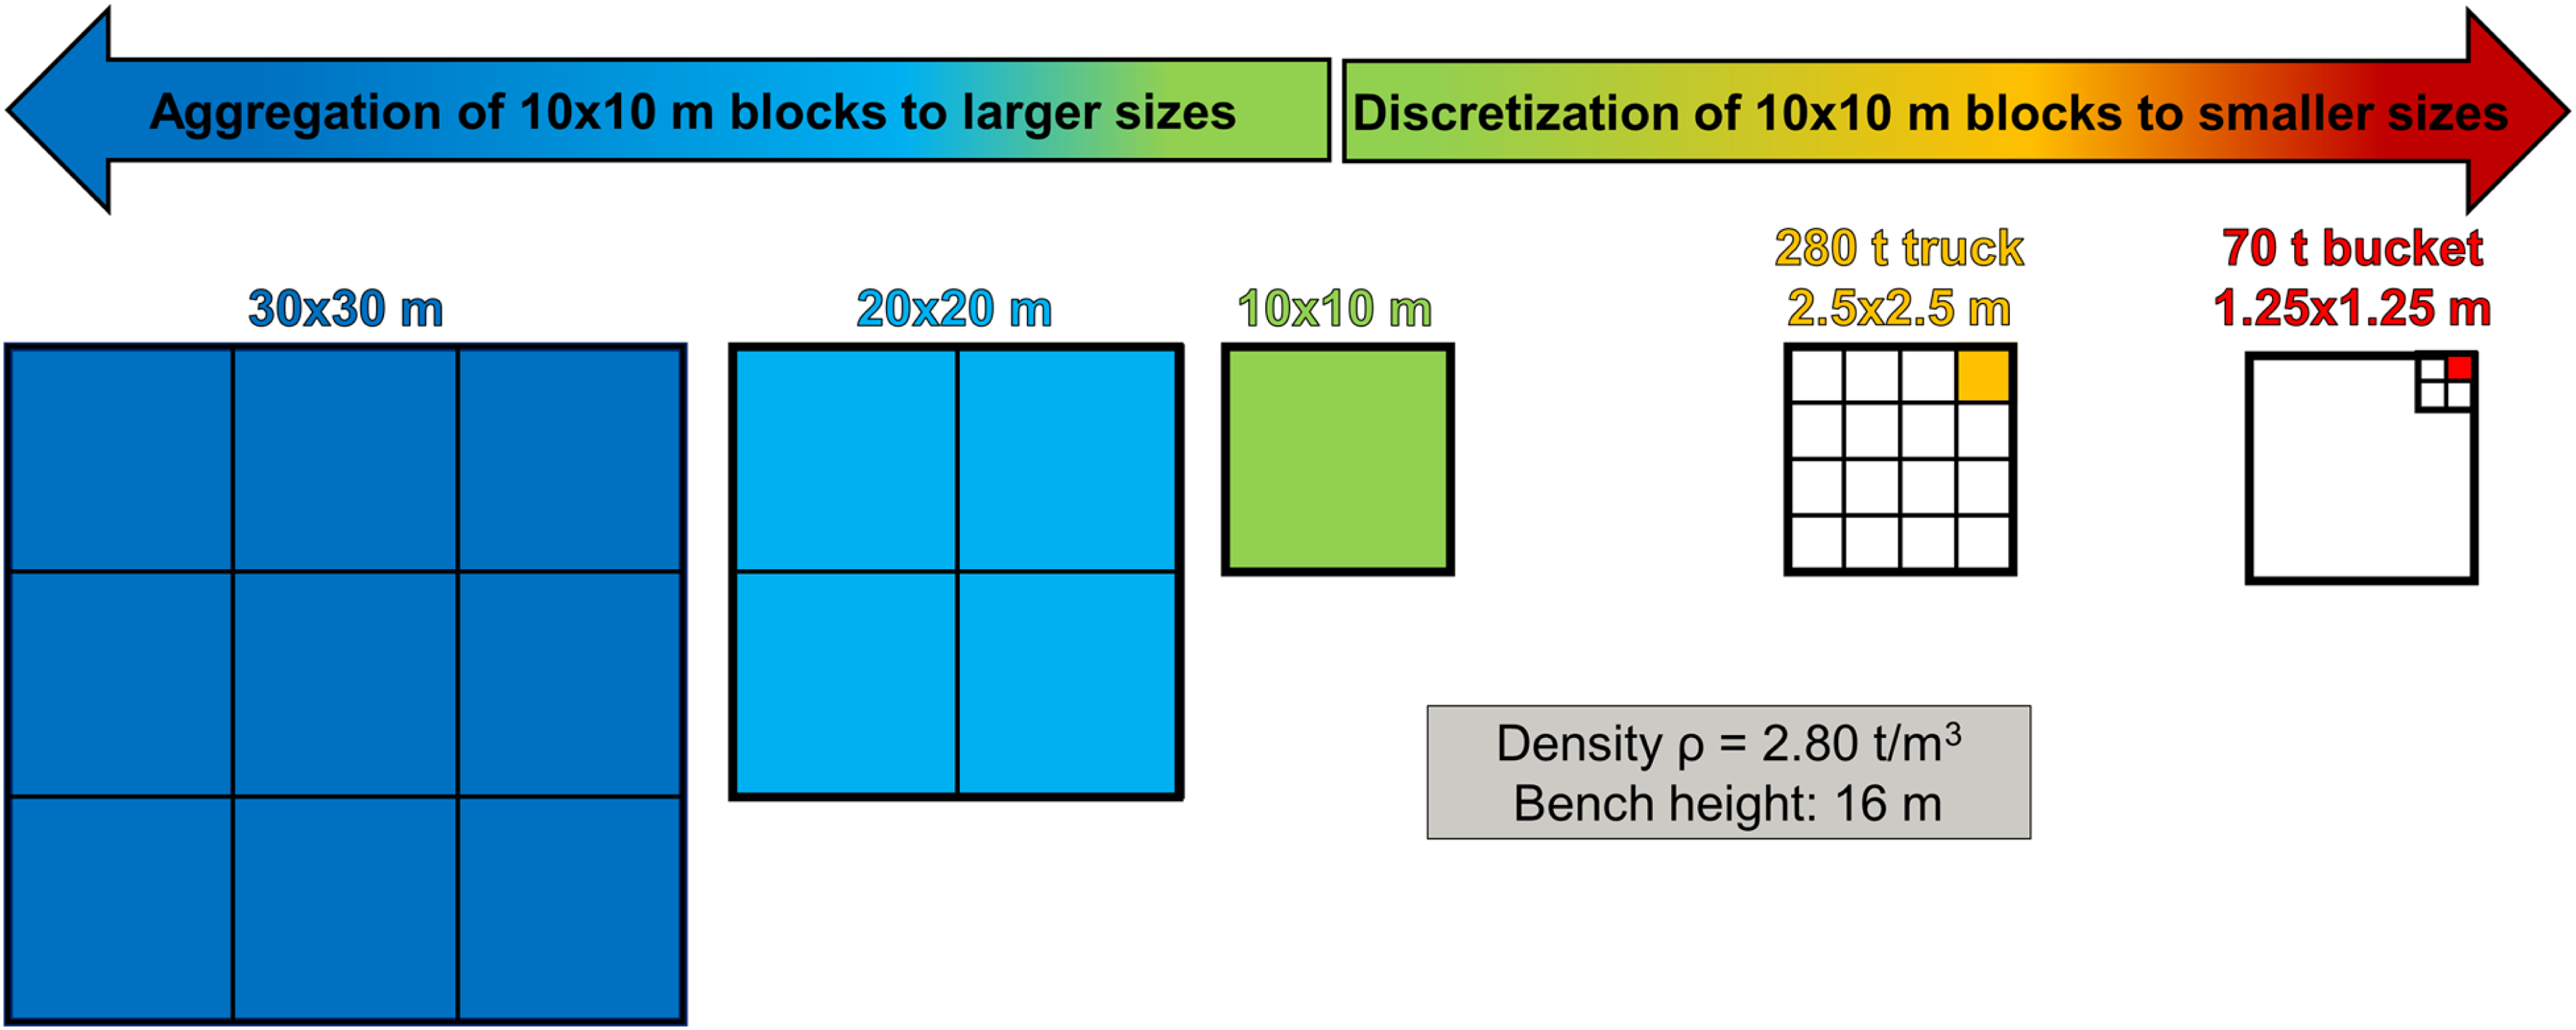
Schematic demonstrating the aggregation and discretisation of the 10 × 10 m blocks to generate the distinct SMUs illustrated for the Cu mine with a 16-m bench and 2.80 t/m3 density.
Two discretisation tonnages were selected representing a truck load and shovel bucket sorting case (Figure 7). The tonnage for the truck load and shovel bucket sorting tonnage discretisation are 280 t and 70 t, respectively, representing typical values for equipment used in large open pit mines. The discretised blocks from the 10 × 10 m SMU range identically for the Cu and Zn mine from 9 to 64 subblocks despite the Zn mine having 3.5 m smaller benches since the decreased volume is compensated by the higher density compared to the Cu mine. For the Au mine, which is more selective working in 10 m benches, the resulting discretised subblocks from the 10 × 10 m SMU ranged from 9 to 49 subblocks. The selected discretisation tonnages cover a range of equipment currently in use at open pit mines but these could still be larger or smaller. The specific values used here are average and ensure the discretisation has a perfect square number of blocks allowing for simple 2D visualisations and interpretation but could be set to any amount. The bucket or truck size subblocks are defined by a 2D discretisation and assumed to have the entire Z extent, which may not be the most realistic approximation, but provides a simple approach for the calculations. The discretisation size selected must be achievable with the mine equipment available. The original SMU can be discretised to smaller units as an exploratory exercise but, for example, trying to sort 50 t of material with a 100-t shovel bucket would not be possible.
Distribution goodness-of-fit and discretisation integrity
Various distributions such as the gamma, lognormal, Weibull, Chi-squared and Pareto among others were tested to determine which best fit the dataset for each of the mines. The best fits were achieved with the gamma and lognormal distributions which has also been observed with other metal grades (Emery, 2012; Faraj and Ortiz, 2021; Journel, 1980). The gamma and lognormal distributions are similar but increasingly variable datasets with longer tails such as the large nugget effect from Au grades will likely be better represented by the lognormal distribution while more continuous datasets are typically better represented by the gamma distribution (Agterberg and Divi, 1978). The gamma distribution proved to be a slightly better fit for the Cu and Zn mine data while the lognormal distribution fit the Au mine data much better with nearly half the RMSE compared to the gamma distribution (Figure 8). These fits are all approximate and the small degree of bimodality present in the Zn distribution was ignored in this study but should be further explored when encountered in a real application.
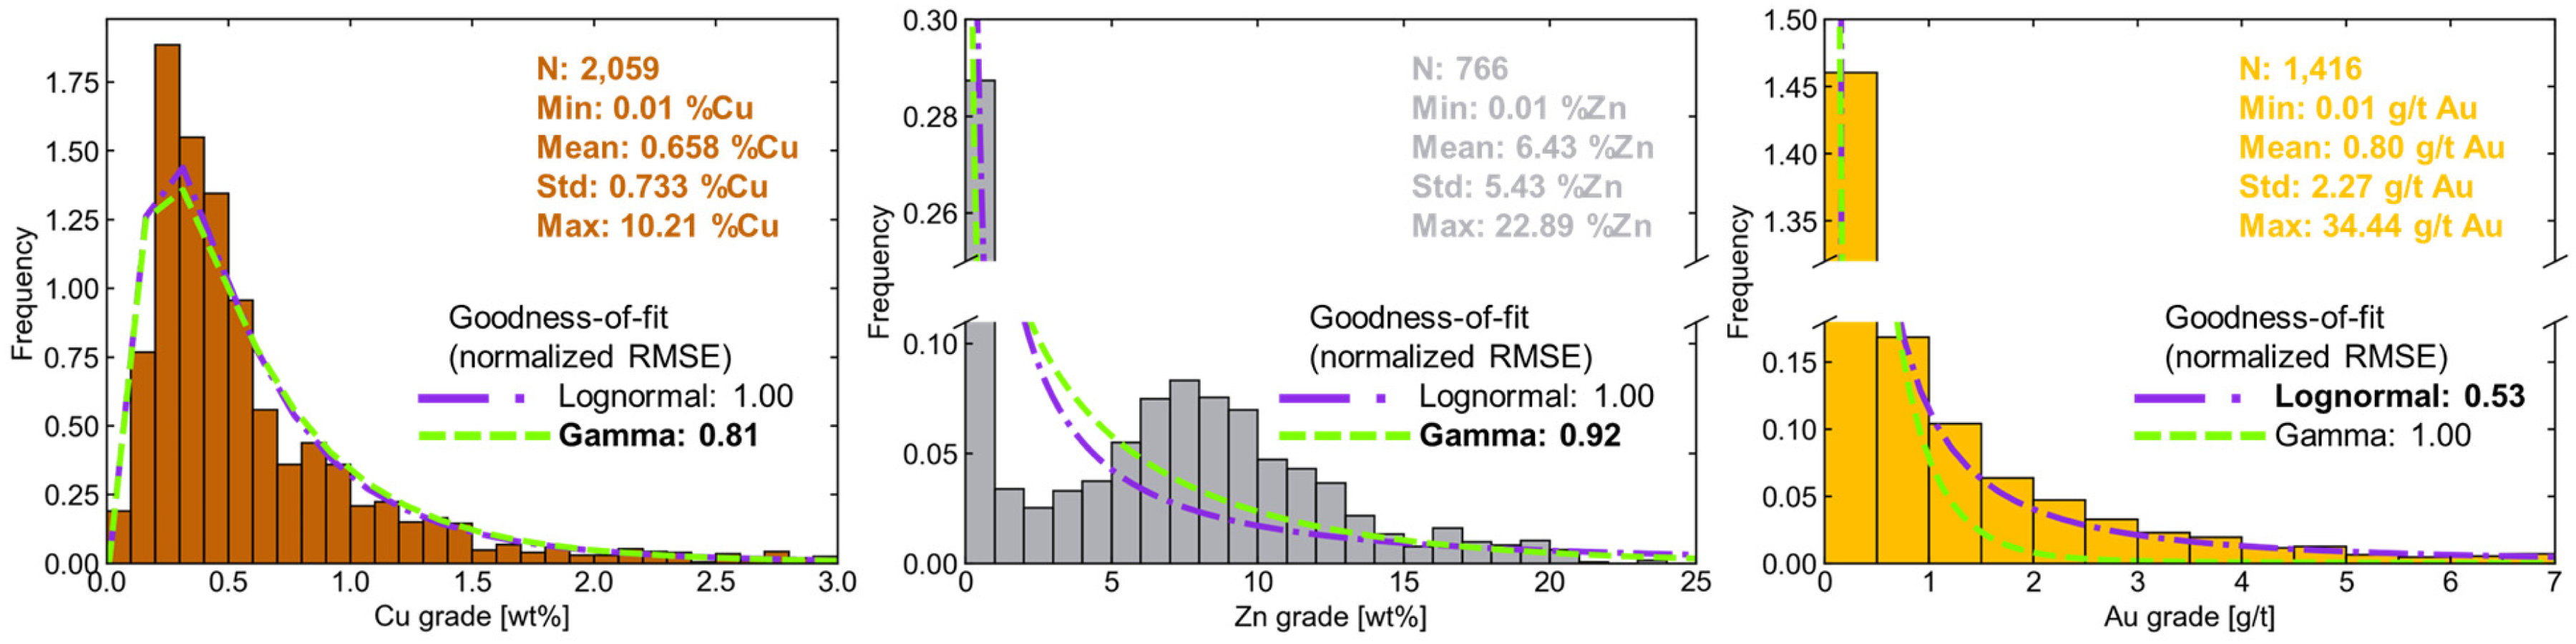
Histograms and descriptive statistics for the Cu, Zn and Au mine indicating which distribution better fits the blasthole data.
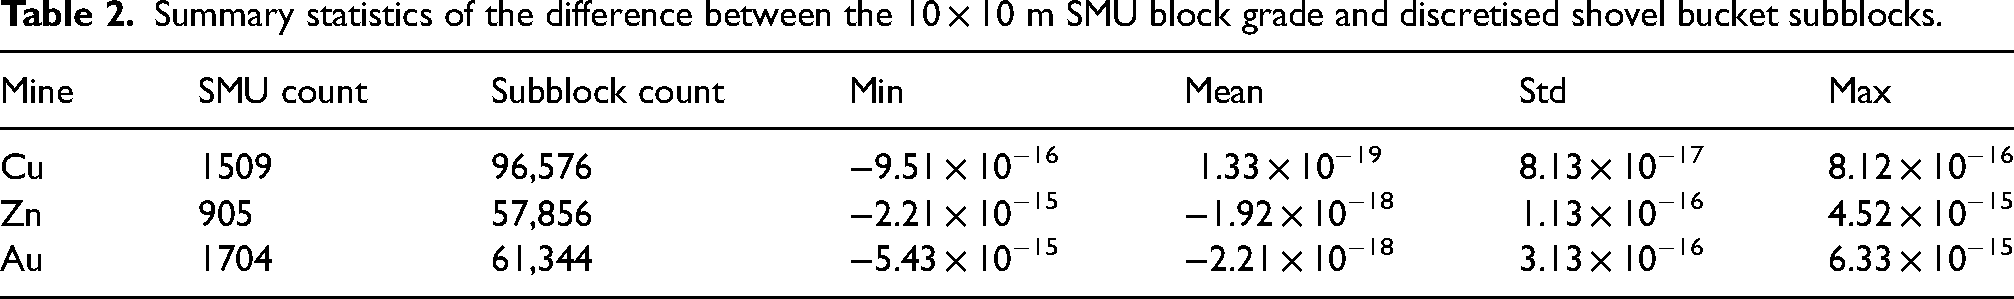
The total tonnage of the discretised blocks compared to their host SMU block matched within <1% for all three mines, a perfect match is usually not possible since the number of discretised subblocks must be an integer as each represents a truck or shovel bucket load. The grade of each SMU block was compared to the average grade of the discretised subblocks to ensure there is no metal mismatch. Since the adjustment factor was used to ensure the discretised subblock grades match the SMU grade, no significant errors were found even in the Au mine with the more extreme tail (Table 2).
Summary statistics of the difference between the 10 × 10 m SMU block grade and discretised shovel bucket subblocks.
Discretised subblock grade variability
The variance reduction factor for each mine will have a significant impact on the variability of the discretised subblock grades. The variogram model differed greatly in the mines from a relative nugget of 0.15 with ranges of 70 and 200 m for the Cu mine compared to the 0.35 relative nugget with ranges of 20 and 55 m for the Au mine which had the biggest impact on the resulting variance reduction factor. The variance reduction factor increased slightly for the increasing discretised subblock size and the reduction effect due to larger support scaled with the discontinuity of the blasthole grades (Figure 9).
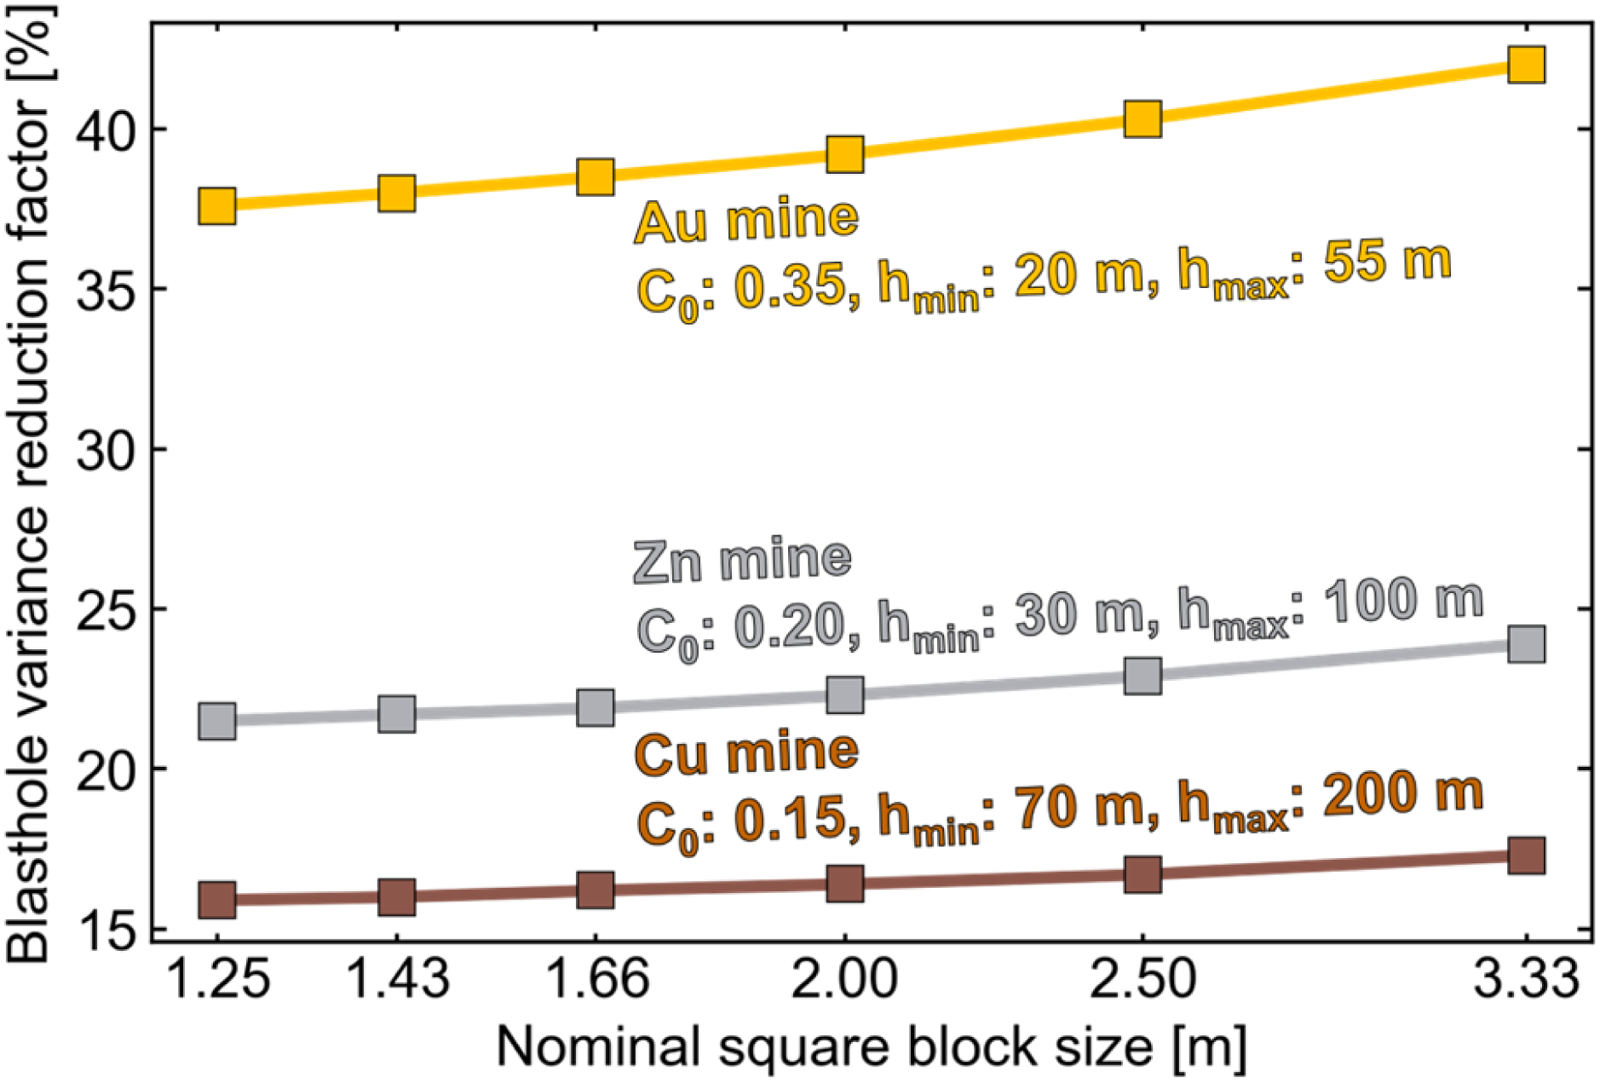
Variance reduction factor for the range of discretised subblock sizes in the Cu, Zn and Au mine.
Increasing the selectivity from each tested SMU size to the discretised truck or shovel bucket sized subblocks shows clear spatial distributions of grades (Figure 10). Comparing the 30 × 30 m to the smaller 10 × 10 m SMU blocks for each mine shows how more ore and waste gets revealed as the smoothing decreases from averaging smaller tonnages. When taken to the discretised shovel bucket or truck size subblock level, many more opportunities to further reduce dilution and ore loss are present as the grades variance gets closer to matching the blasthole variance. For the continuous Cu mine most of the waste within ore SMU blocks or ore within waste SMU blocks are marginal and within 25% of the cut-off grade but various opportunities are present throughout. The more discontinuous Zn mine shows how contacts between high grade ore and barren waste are better captured with the more selective units. The enhanced selectivity benefit is most clearly observed with the most discontinuous, vein hosted Au mine where each increasingly selective blocks shows increasing opportunities to separate larger amounts of barren waste and high grade ore.
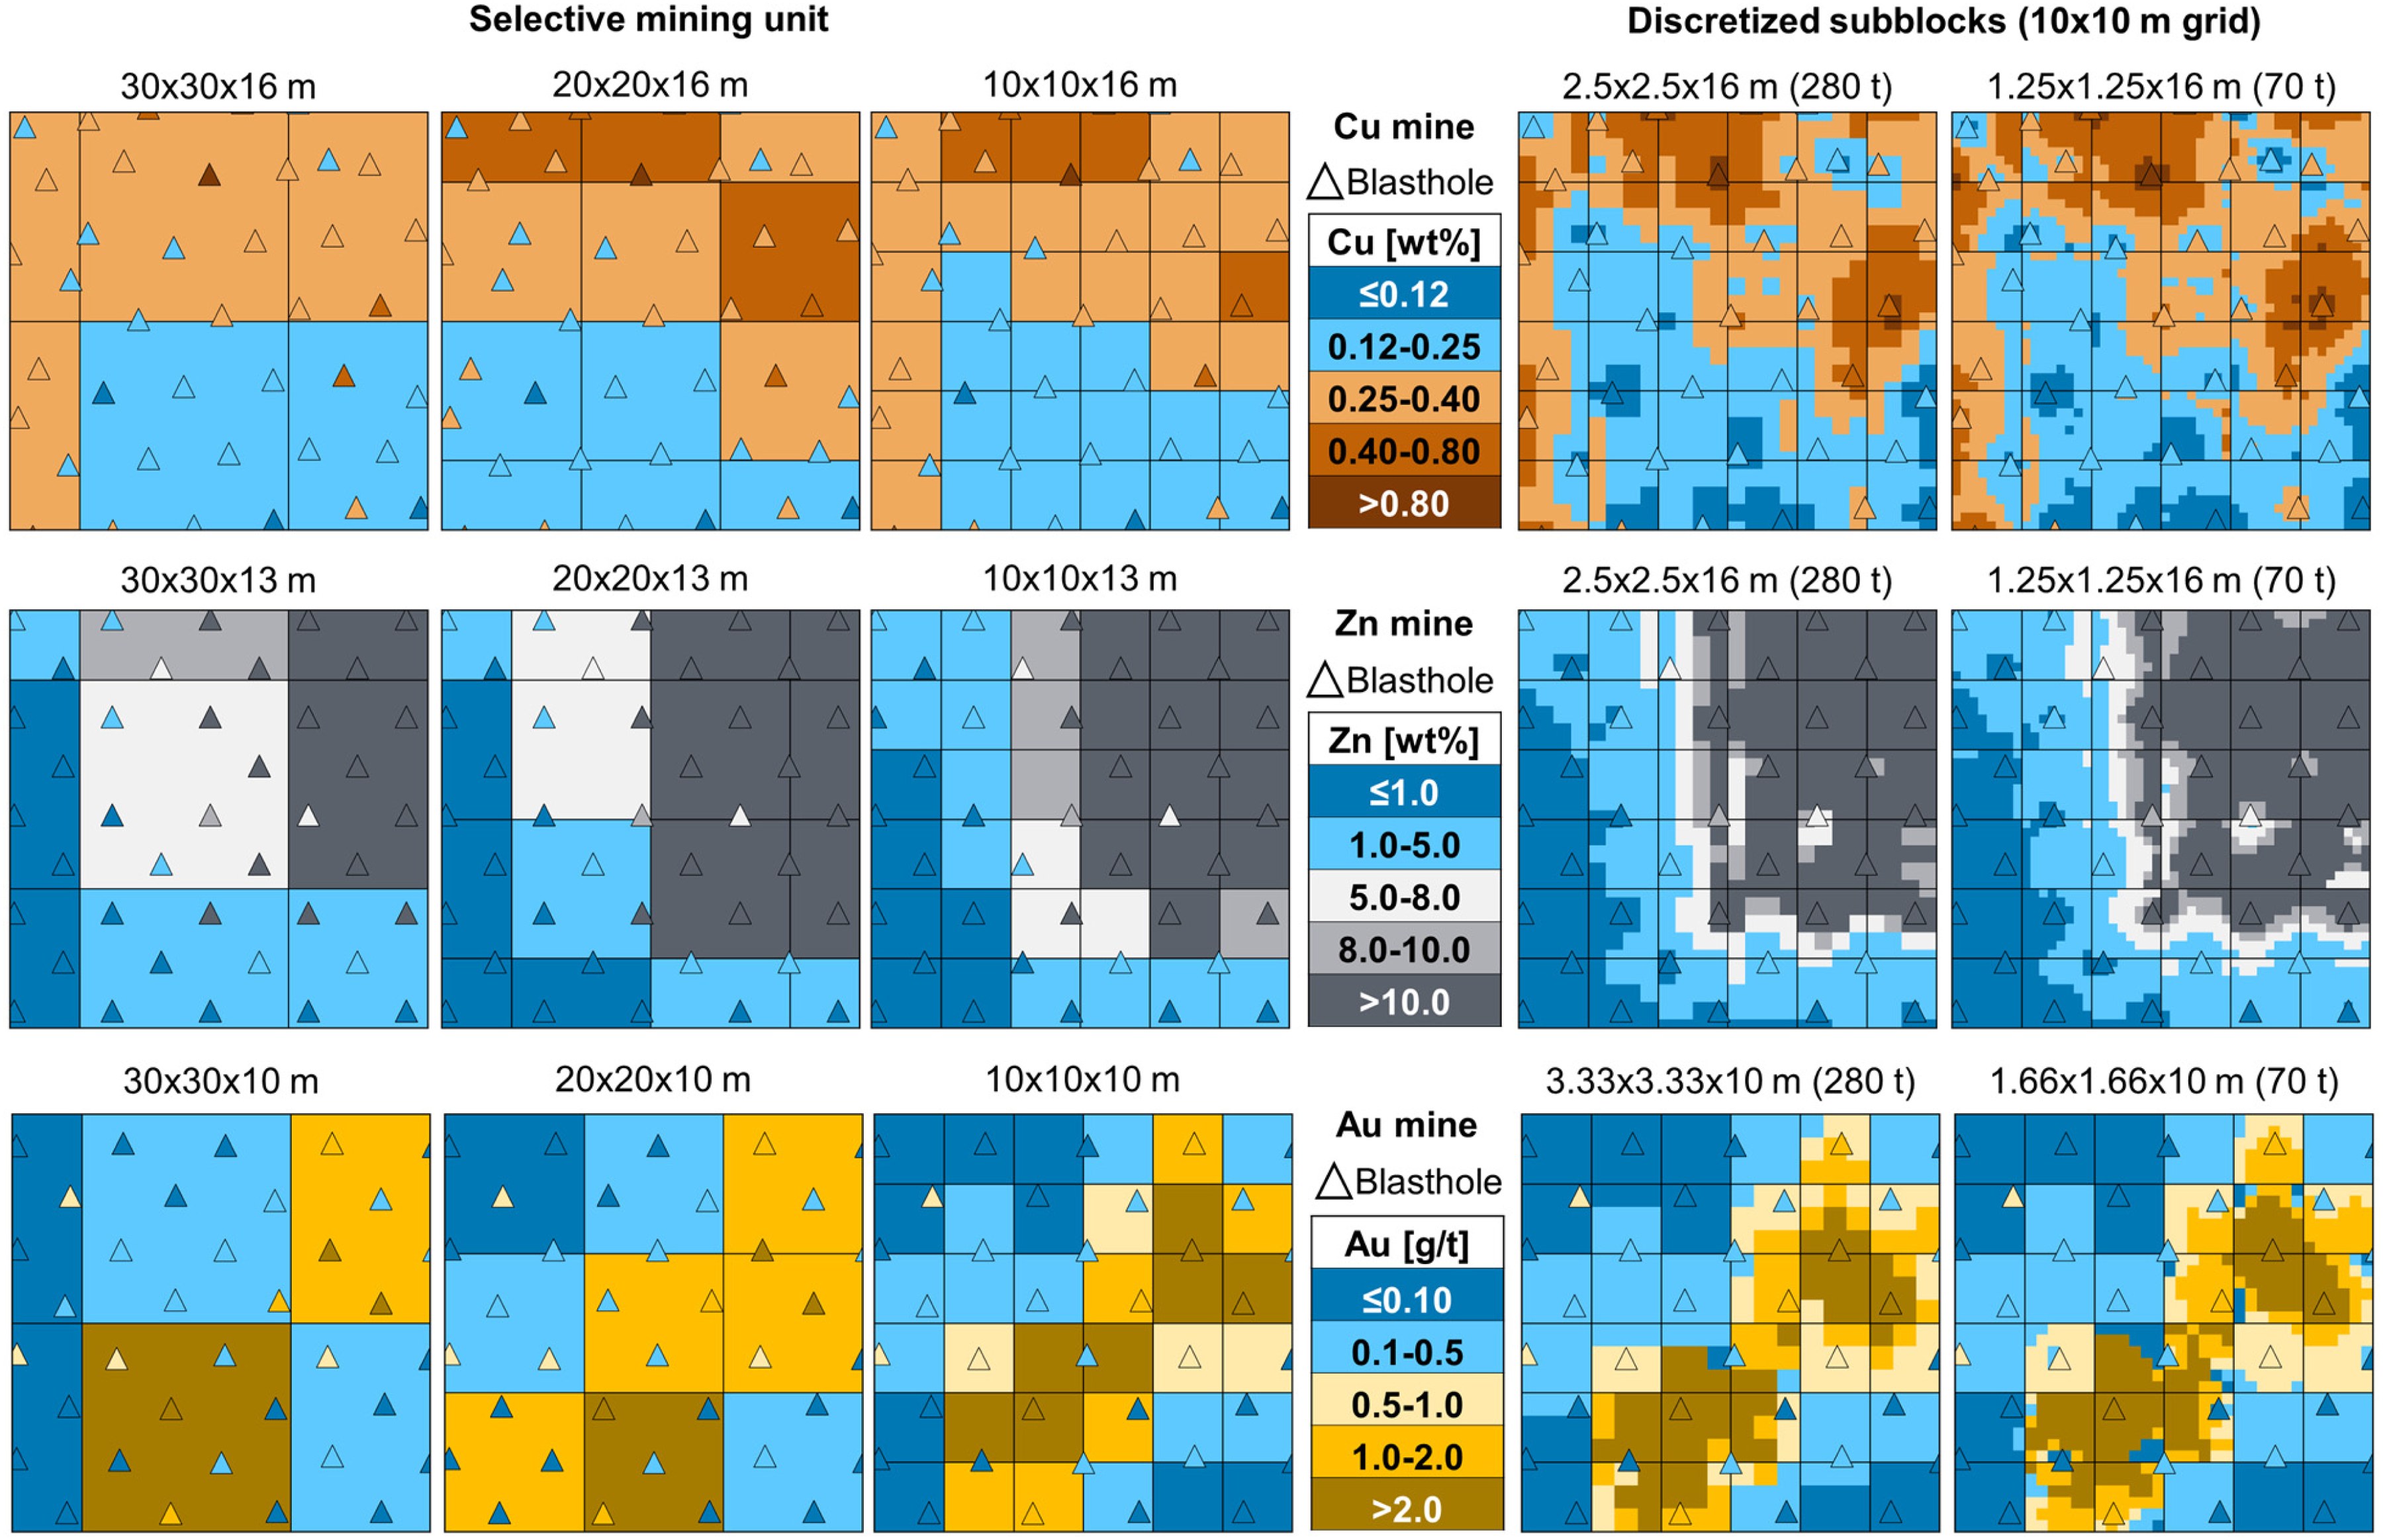
Spatial plots of grades at the original selective mining units and enhanced selective blocks for the Cu, Zn and Au mine.
Grade tonnage benefits from enhanced selectivity
Any study where the selectivity is enhanced will show similar trends such as increasing the head grade of ore and reducing the grade in the waste driven by the reduction of dilution and ore loss. The degree of improvement will mainly depend on the number of opportunities present to reduce dilution and ore loss and the difference in grade from the cut-off. For example, for the Cu mine there is a large amount of tonnage which would be re-classified with enhanced selectivity but most of the grades are marginal resulting in a relatively small yet significant increase in head grade. For the more heterogeneous Zn or Au mine, while there may not be as many material reclassifications, the waste separated from ore will be much lower grade and the ore recovered from waste much higher in grade relative to the Cu mine. The grade tonnage curves shown in Figure 11 clearly highlight the increasing head grade with increasing selectivity at any selected cut-off. Typical of any aggregation or smoothing, as the cut-off grade increases there are less opportunities to reduce dilution and more opportunities to recover additional ore.
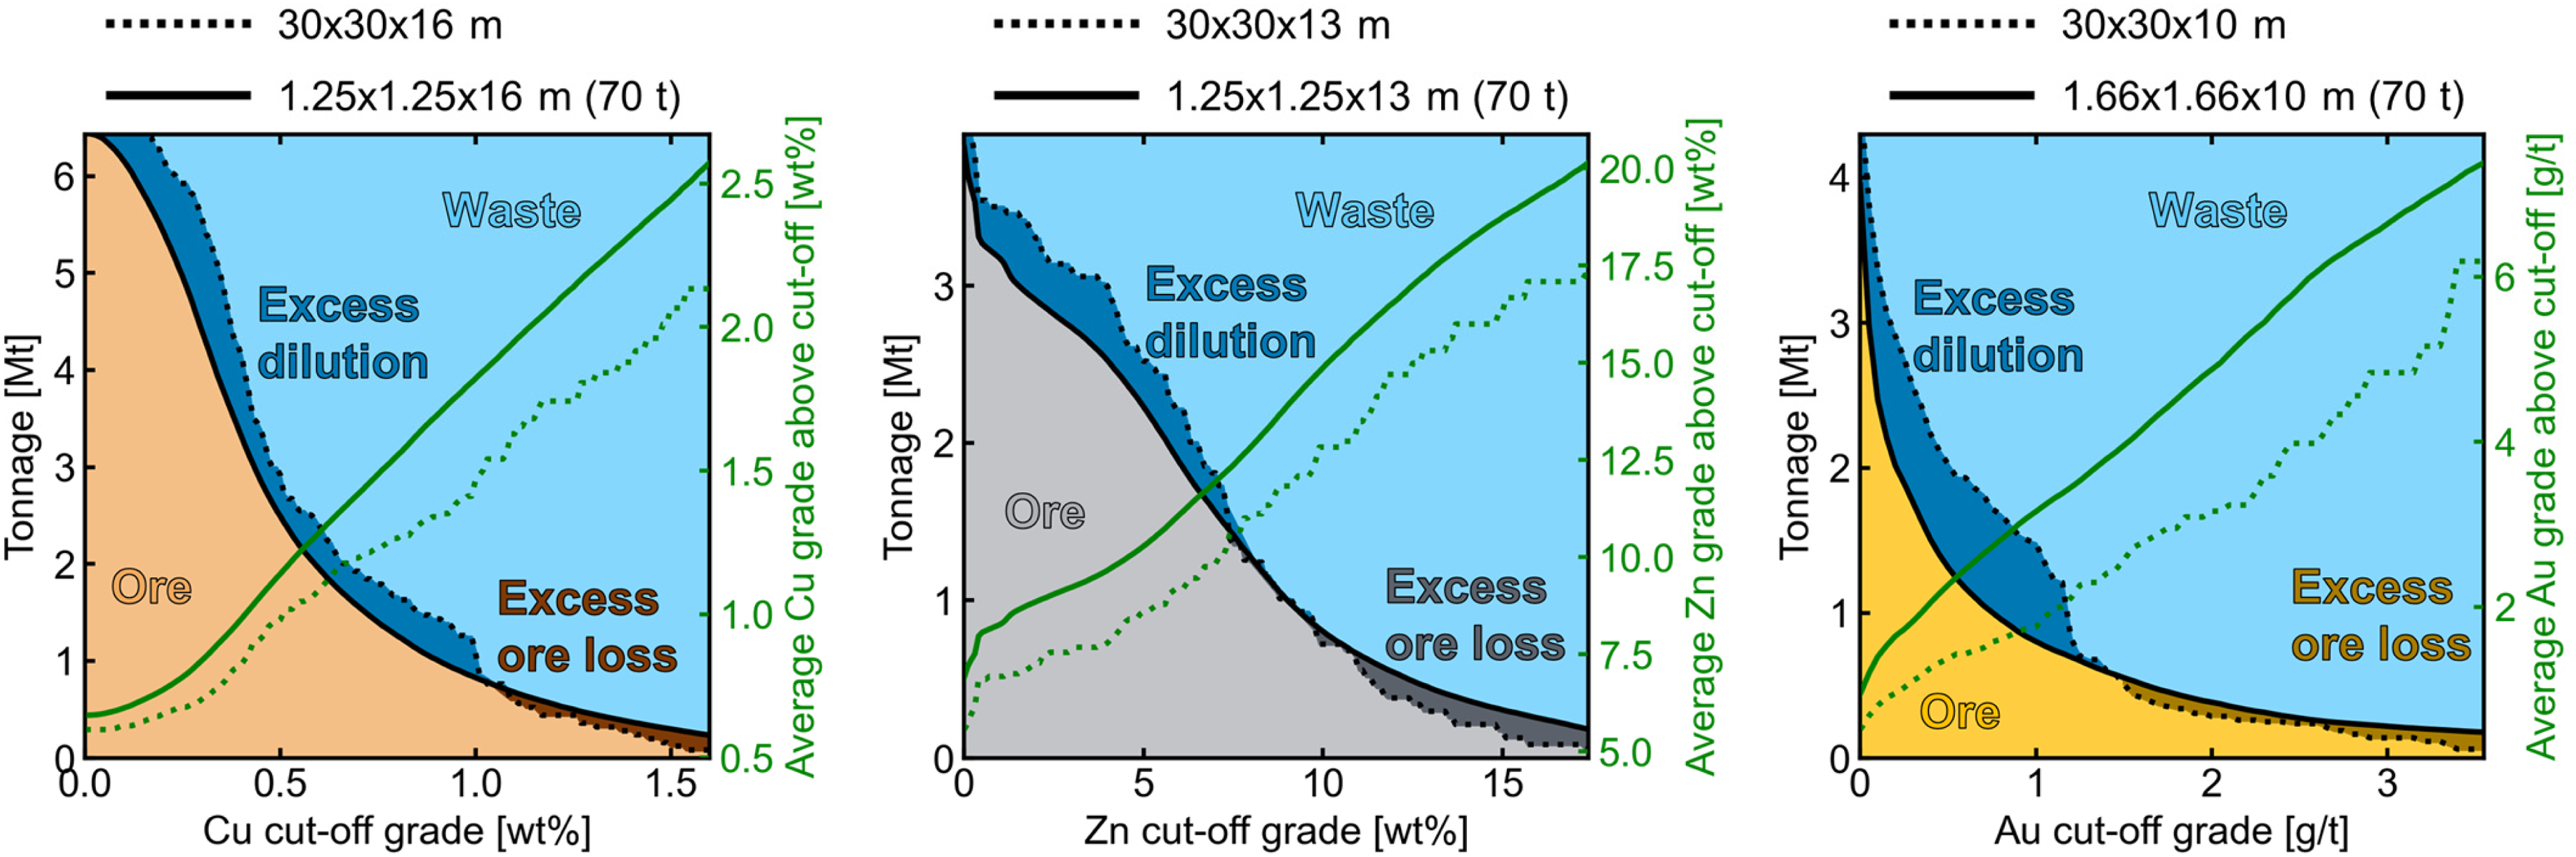
Grade tonnage curves comparing the least and most selective unit for the Cu, Zn and Au mine.
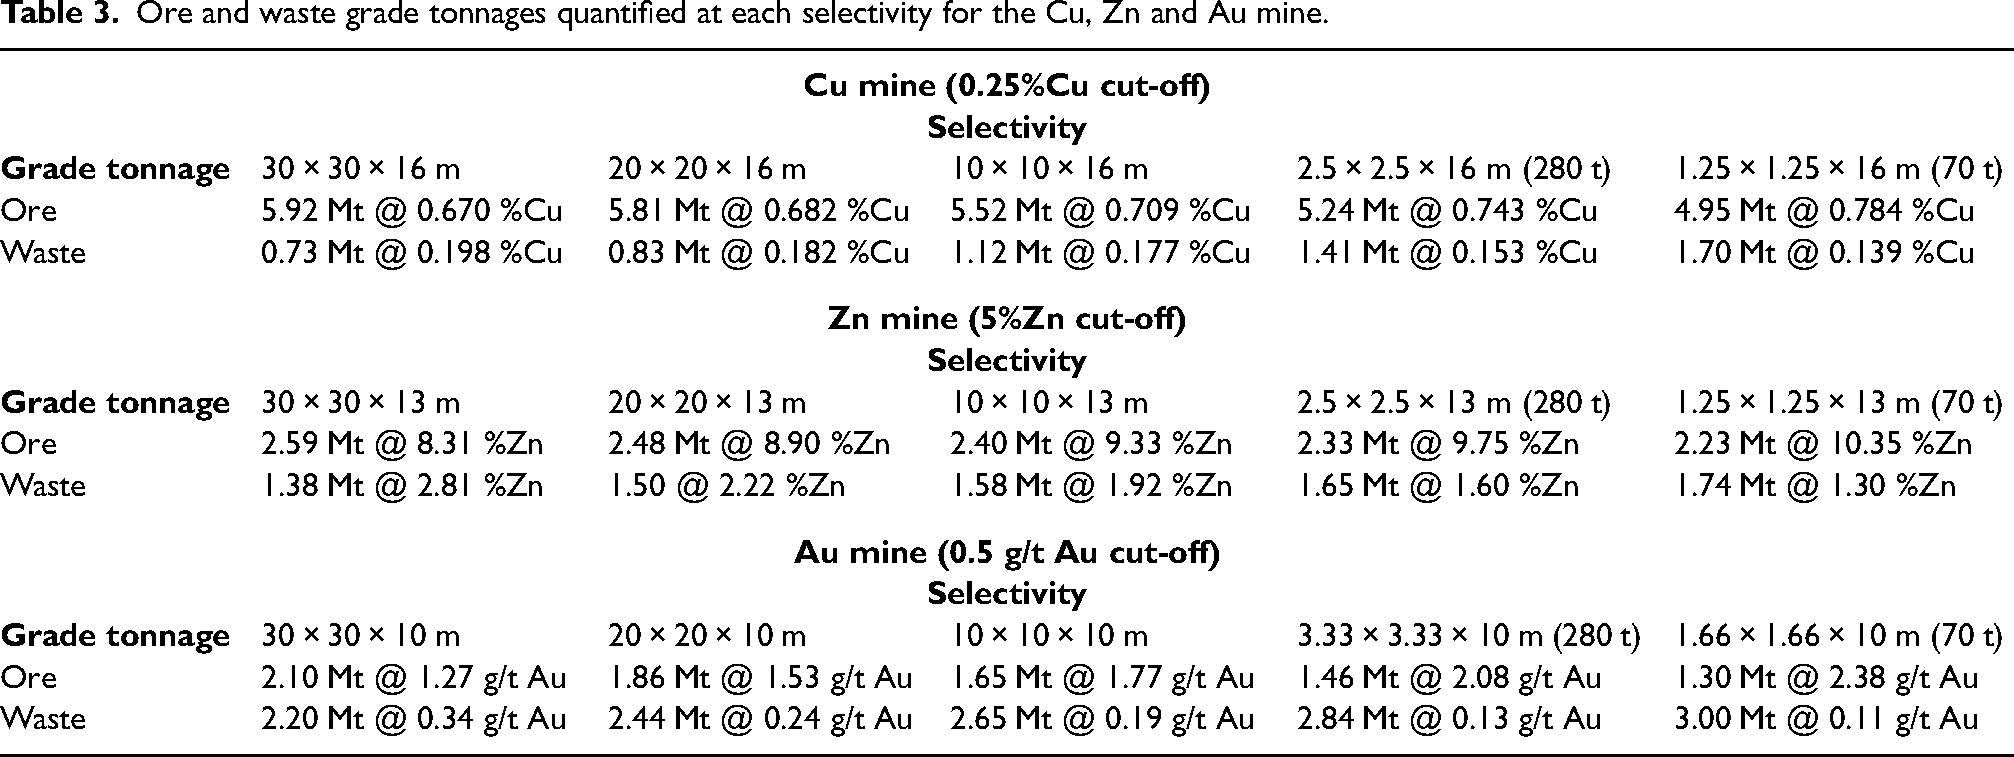
The cut-off grade is important to consider when deciding to change the mining selectivity. If the selectivity is enhanced there will typically be a decreased ore tonnage and increased waste tonnage, the opposite is also true when changing to a coarser selectivity. Depending on the operational bottlenecks, mine design parameters such as mining rate, processing rate, or cut-off grade will need to be re-optimised to maximise the net present value. The impact of enhancing the selectivity will mainly depend on the heterogeneity of the deposit, more discontinuous mines will see a larger impact while more continuous mines will not change significantly. Comparing the 20 × 20 m SMU block to 280 t discretised subblocks for the Cu mine results in a 9.8% decreased ore tonnage while for the Au mine the ore tonnage decreases by more than double at 21.5%. The ore and waste tonnage grades relationship with enhanced selectivity is similar at each of the three mines and the more heterogeneous mines experience a larger difference from the original SMU (Table 3).
Ore and waste grade tonnages quantified at each selectivity for the Cu, Zn and Au mine.
The dilution and ore loss was quantified by comparing the ore and waste classifications of each block to the most selective shovel bucket subblock. The dilution and ore loss increased for all mines as the selectivity decreased and was most significant for the Au mine especially at the 30 × 30 × 10 m SMU block size although this selectivity is much coarser than a mine of this deposit type would operate at (Figure 12). Dilution is always greater than ore loss except in the case of the Cu mine likely due to having a much smaller waste tonnage relative to the total tonnage. While the ore loss and dilution is greater for the Cu mine compared to the Zn mine, the enhanced selectivity benefit at the Zn mine is greater likely related to the higher recoverable ore grades and lower reduceable waste grades relative to the cut-off.
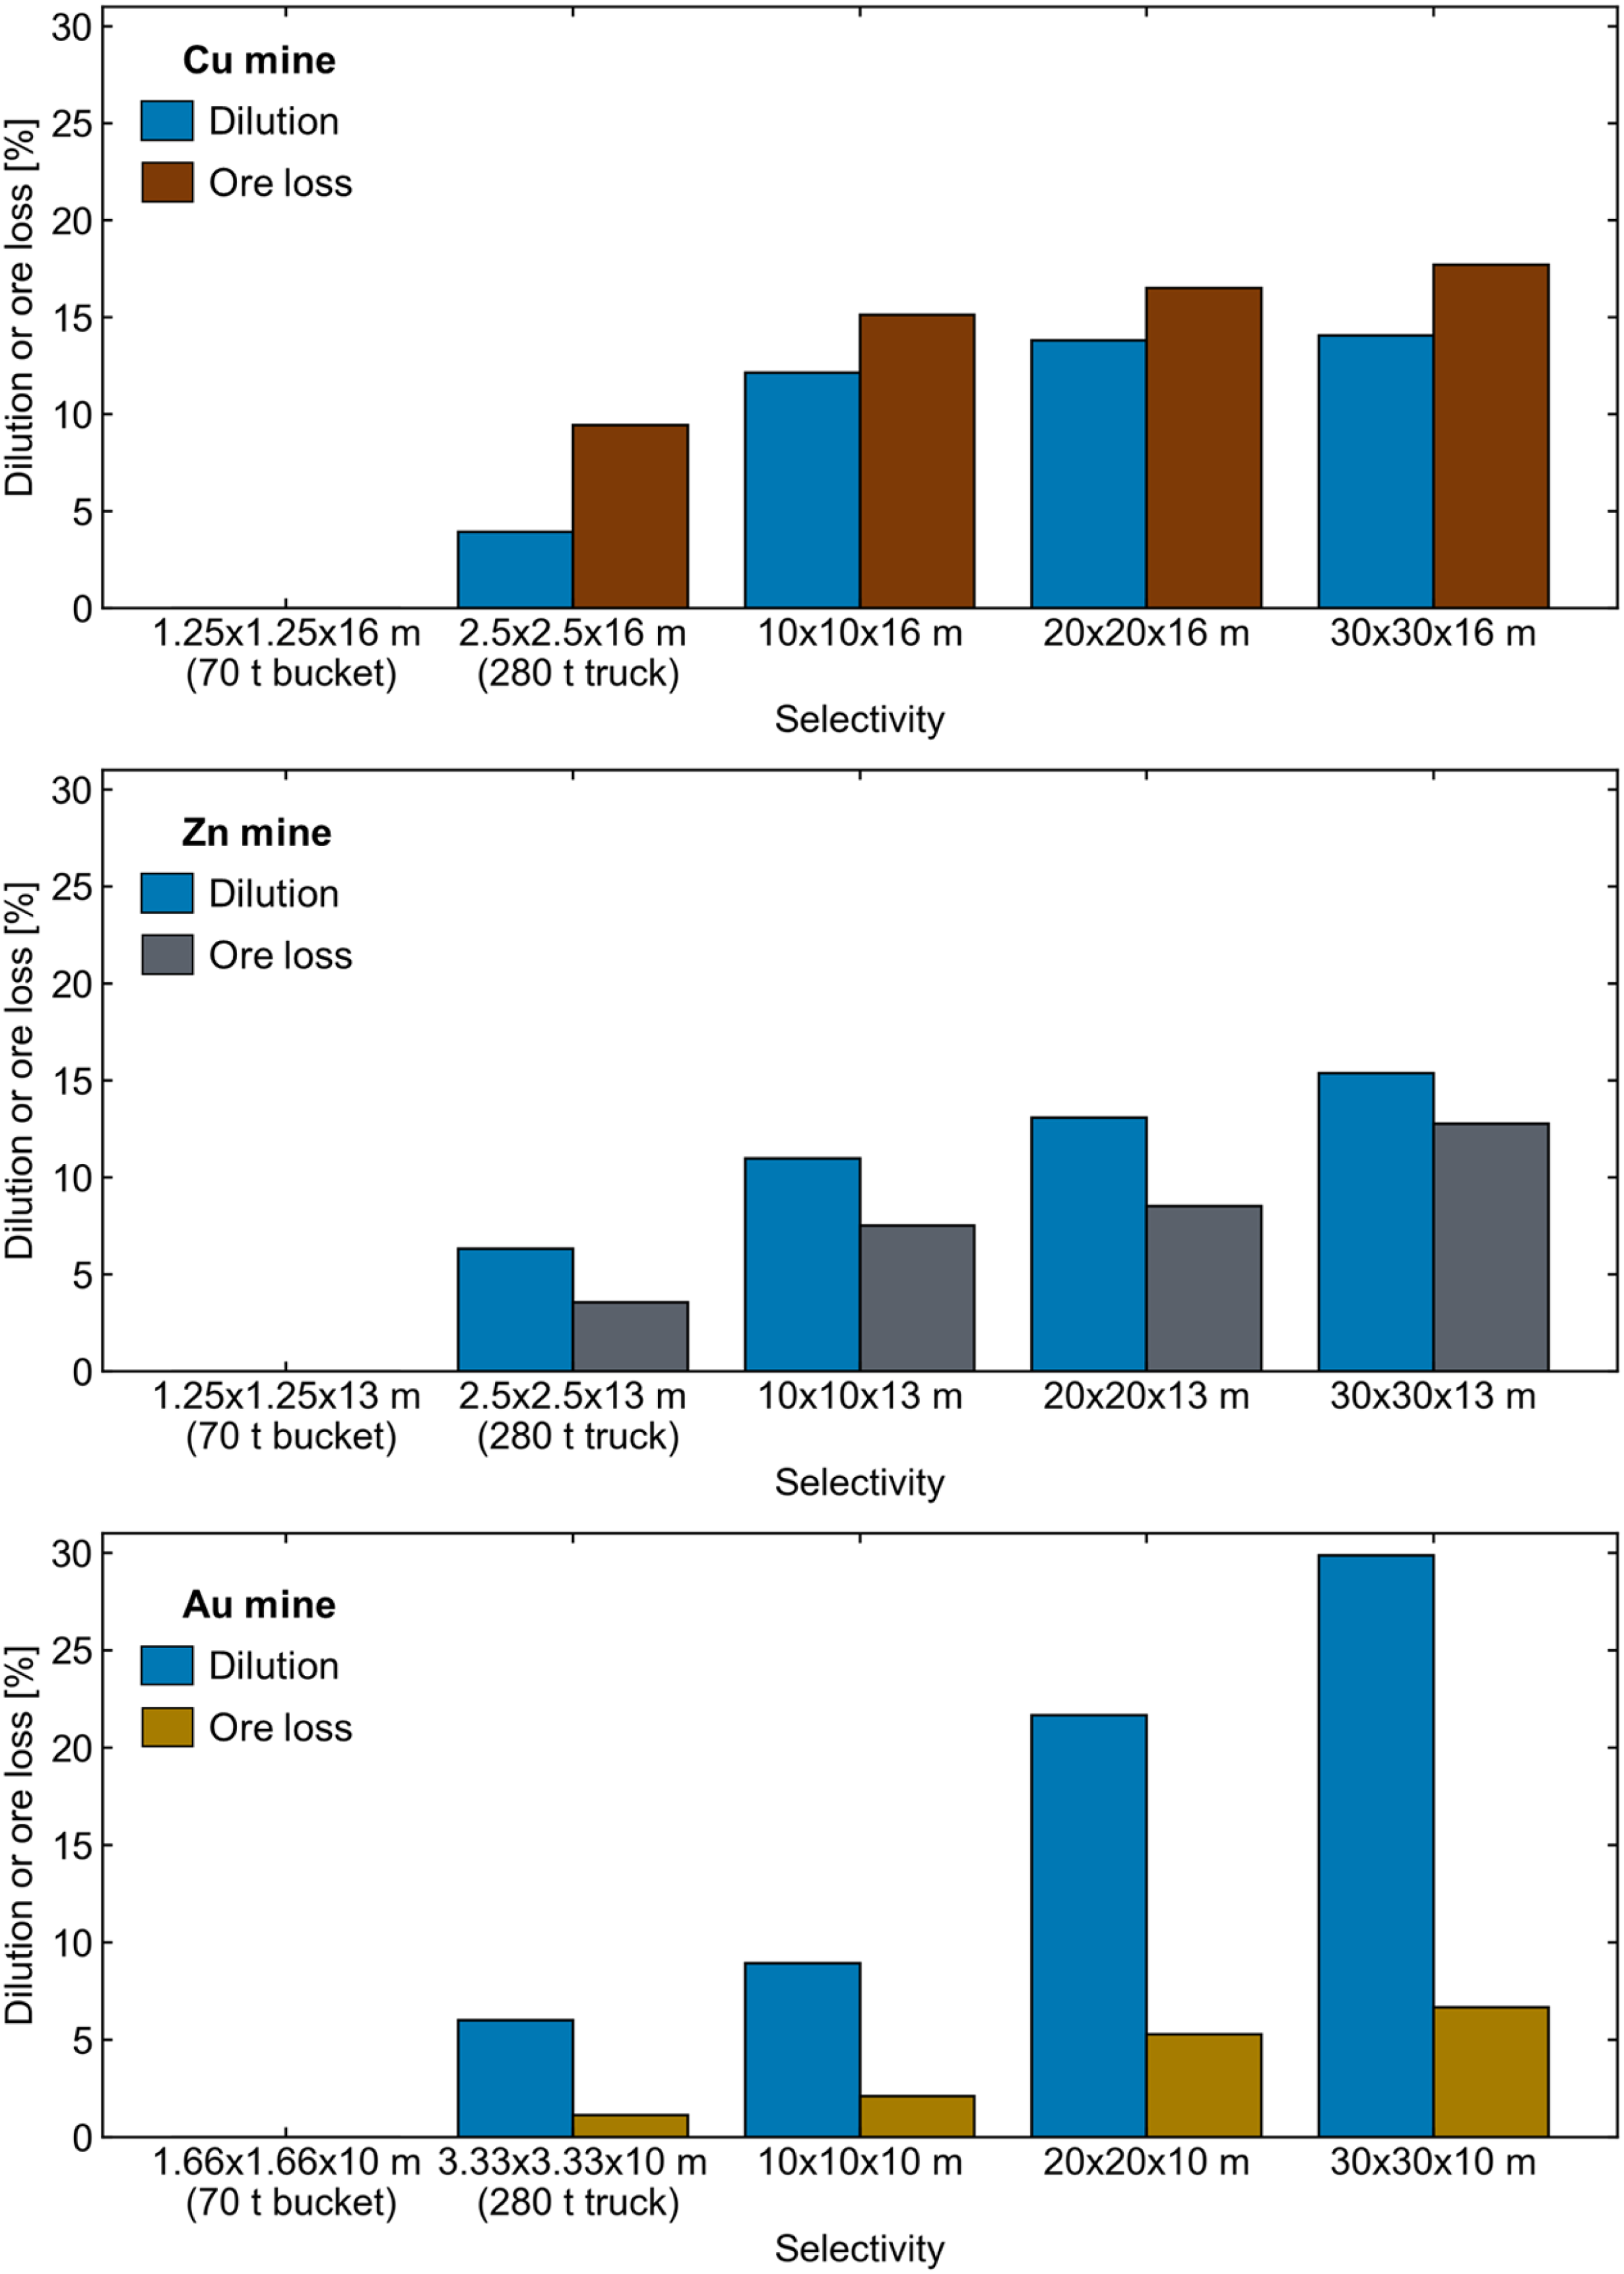
Bar charts showing the increasing dilution and ore loss with less selective units for the Cu, Zn and Au mine.
Discussion
Head grade and selectivity relationship with heterogeneity
A clear trend was identified with the head grade and mining selectivity. As the selective unit decreases from ∼30 kt to a shovel bucket load of 70 t the normalised head grade increases loglinearly with an average Pearson correlation coefficient of 0.98 for the Cu, Zn and Au mine (Figure 13). The strong relationship indicates that the head grade improvement can be modeled to obtain a rough approximation of the benefit for mining with enhanced selectivity. Interestingly the slope of decreasing head grade with coarser selectivity increased gradually with heterogeneity meaning the spatial continuity would need to be known or roughly approximated to ensure a close estimate. Given the difference in head grade selectivity trend for the continuous Cu mine and highly discontinuous Au mine, selecting the wrong slope could result in significant errors especially when modeling at more enhanced selectivity.
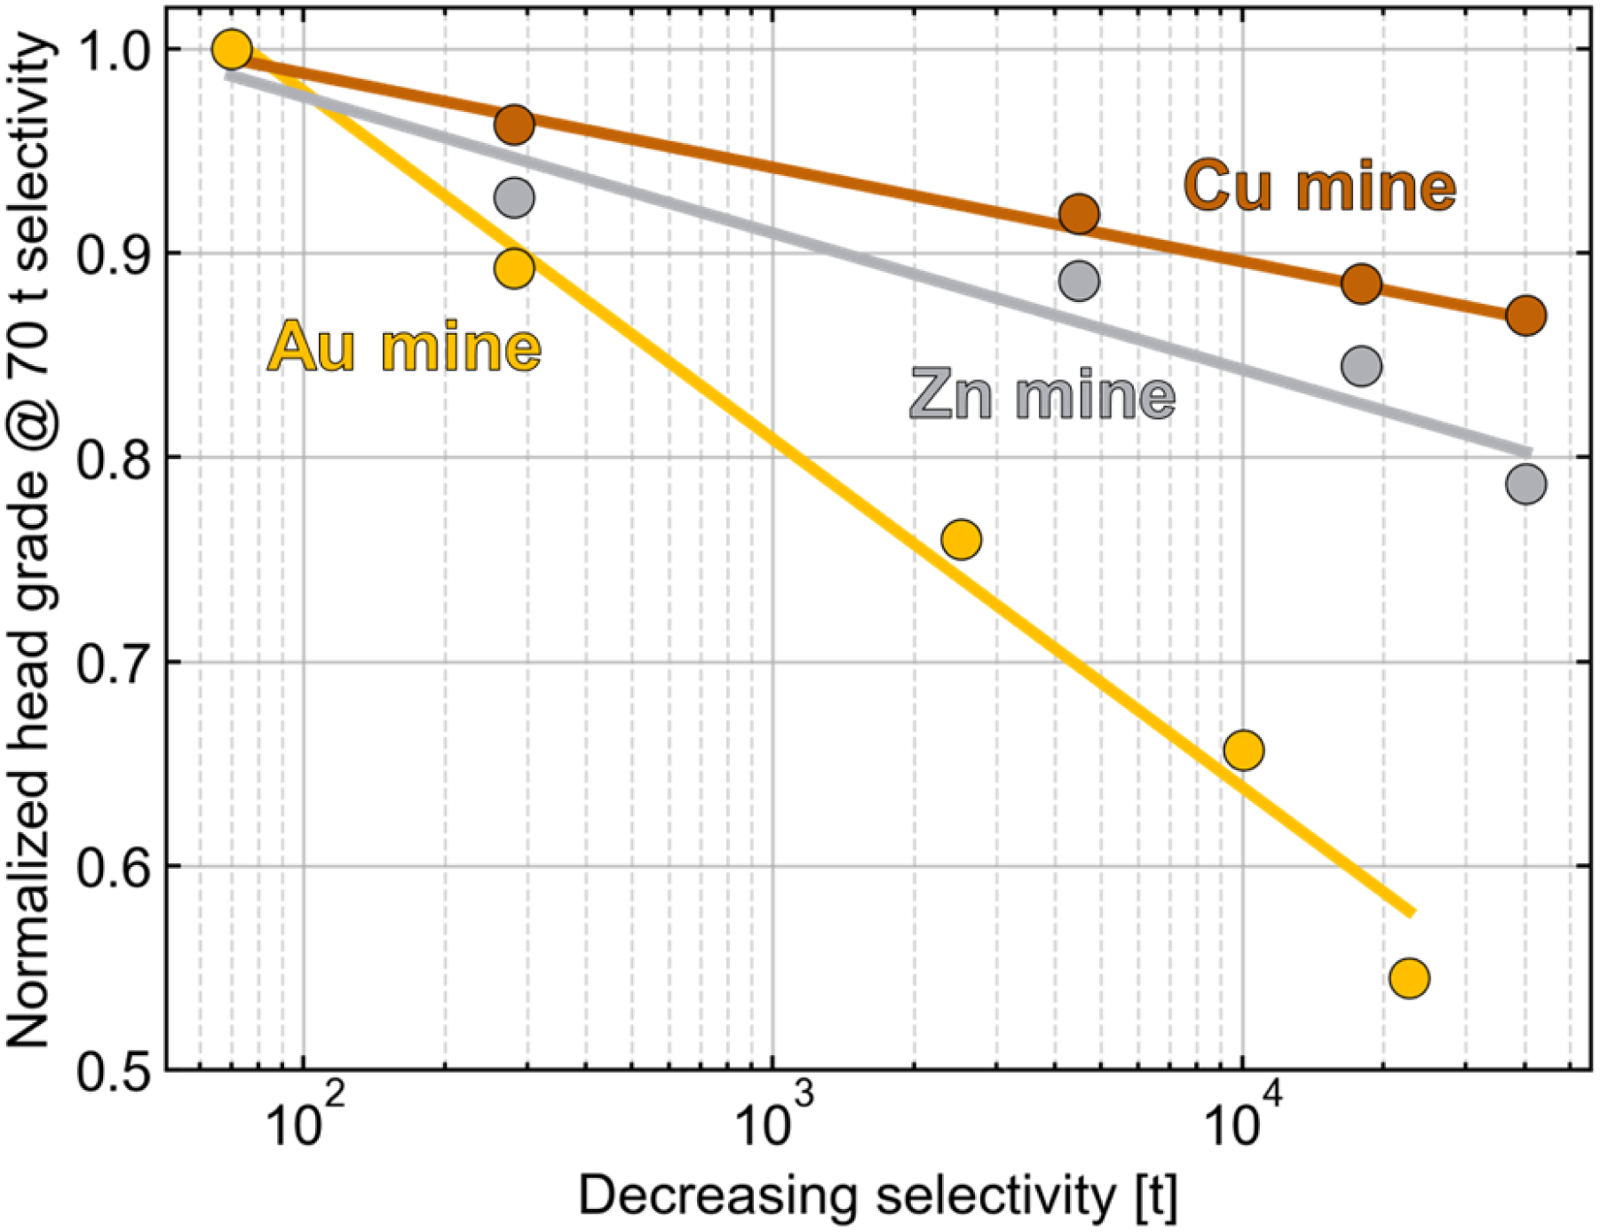
Linear log relationship of decreasing normalised head grade with decreasing selectivity for each mine.
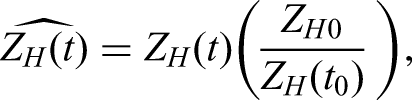
The relationship between normalised head grade and selectivity for each of the three mines can be calculated using


Factors influencing bulk ore sorting potential
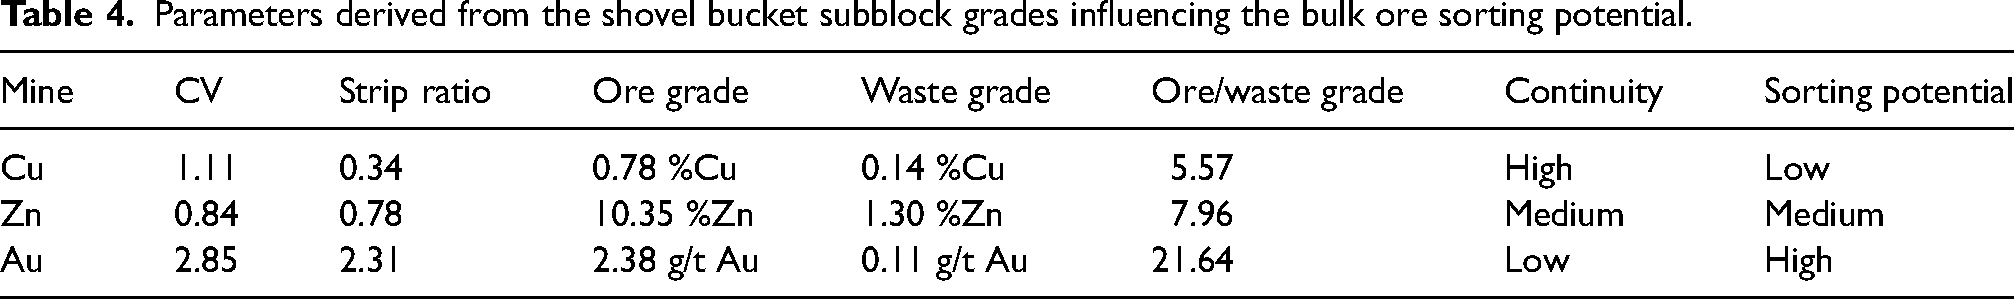
Heterogeneity is a clear driver in the bulk ore sorting potential for any mine site and geostatistical analyses of the block model or blastholes grades can highlight factors influencing the potential value for mining with enhanced selectivity. The most relevant variables identified in the three mines with distinct heterogeneity studied here include the coefficient of variation (CV), strip ratio, ore grades above cut-off, waste grades below cut-off and spatial continuity. These could reveal how beneficial it would be to invest in more selective mining methods for a given mine. For example, the ore grade above cut-off for the Cu mine is three times higher than the cut-off while for the Au mine it doubles at almost six times higher. Similarly, the waste grade for the Cu mine is 28% lower than the cut-off grade while for the Au mine it is nearly three times higher with a waste grade 80% lower than the cut-off grade. The ratio of the ore to waste grade increases by nearly a factor of four from 5.57 for the Cu mine to 21.64 for the Au mine suggesting it is also a good indicator of the bulk ore sorting potential. The Zn mine follows the same trends usually in between the two extremes with some differences such as having a smaller CV than the Cu mine. Similar trends are observed between the bulk ore sorting potential and the CV, strip ratio or spatial continuity (Table 4).
Parameters derived from the shovel bucket subblock grades influencing the bulk ore sorting potential.
Operational considerations in the productivity selectivity tradeoff
There are clear benefits to mining with enhanced selectivity especially at the shovel bucket scale with double sided truck loading. While the intrabucket dilution and ore loss within a shovel bucket cannot yet be separated, the interbucket ore/waste segregations can be done with double sided truck loading. Despite the ore control benefits, operational considerations must be made as production could be negatively impacted especially in the case of shovel bucket ore/waste sorting with two trucks. Double sided truck loading or using smaller, more selective mining equipment will negatively impact the utilisation of trucks and likely reduce productivity. The deposit's heterogeneity will likely be the main driver in optimising productivity and selectivity to maximise the NPV, more heterogeneous deposits will benefit more from using more selective equipment while the opposite is also true where more homogeneous deposits will benefit more from higher productivity (Figure 14).
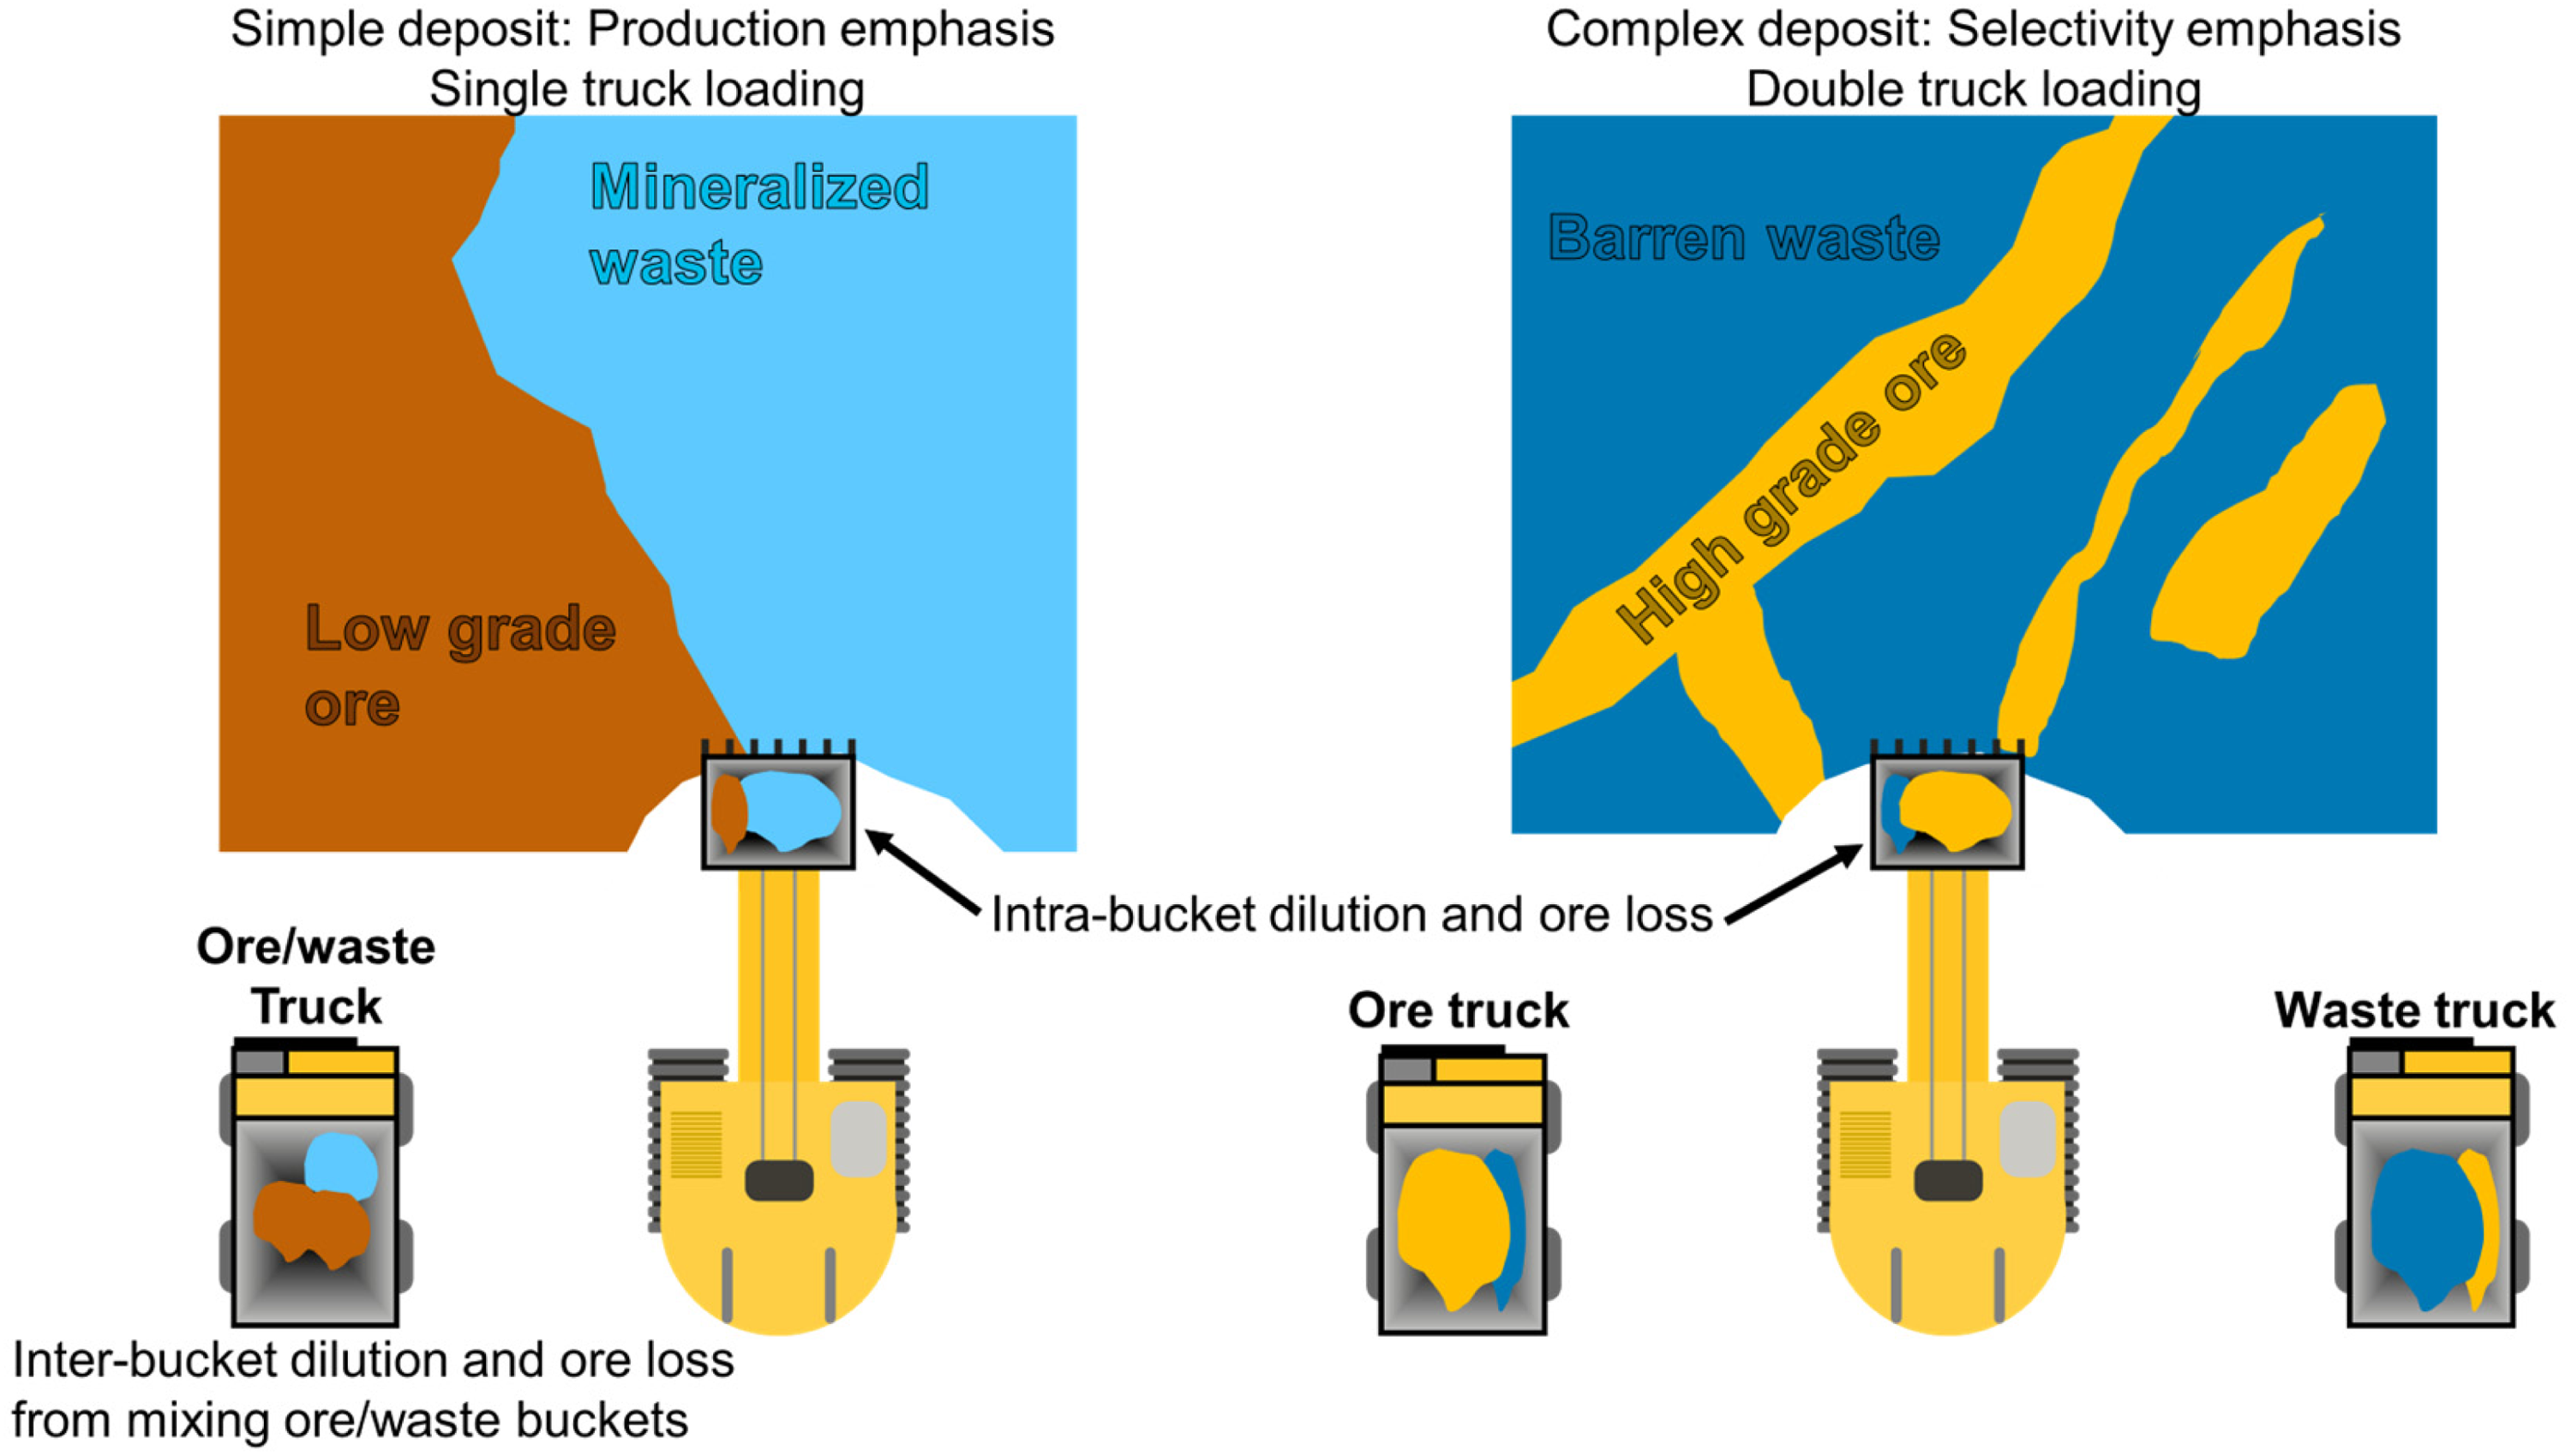
Schematic comparing a simple deposit where production is prioritised over selectivity with single truck loading and a complex deposit where selectivity is prioritised with double truck loading to segregate ore and waste.
Another consideration is the change in ore and waste tonnage as mining with enhanced selectivity could result in additional unexpected tonnage based on the deviation from the mine plan based on coarser selectivity. Mine planning parameters may need to be re-optimised to make the most of the enhanced selectivity with bulk ore sorting (Faraj, 2024). This is especially true if bulk ore sorting systems are installed on the full fleet of loading equipment at a mine. If the amount of ore recovery diversions is significantly higher than the dilution reduction diversions or vice versa, there could provide room for improvement by adjusting the mine planning parameters such as the production rate or cut-off grade. For example, Figure 15 illustrates a typical scenario where ore recovery significantly exceeds dilution reduction. In this case, NPV can be maximised by increasing the cut-off grade, instead of the usual proposal to increasing production. There are many additional variables which should be considered when optimising the mine plan and further work is needed to understand how to maximise value with the increased selectivity that is offered through bulk ore sorting at the face. For example, considering truck selectivity during mine design could reduce the size of the required processing facility thus reducing a significant capital expenditure in the project.
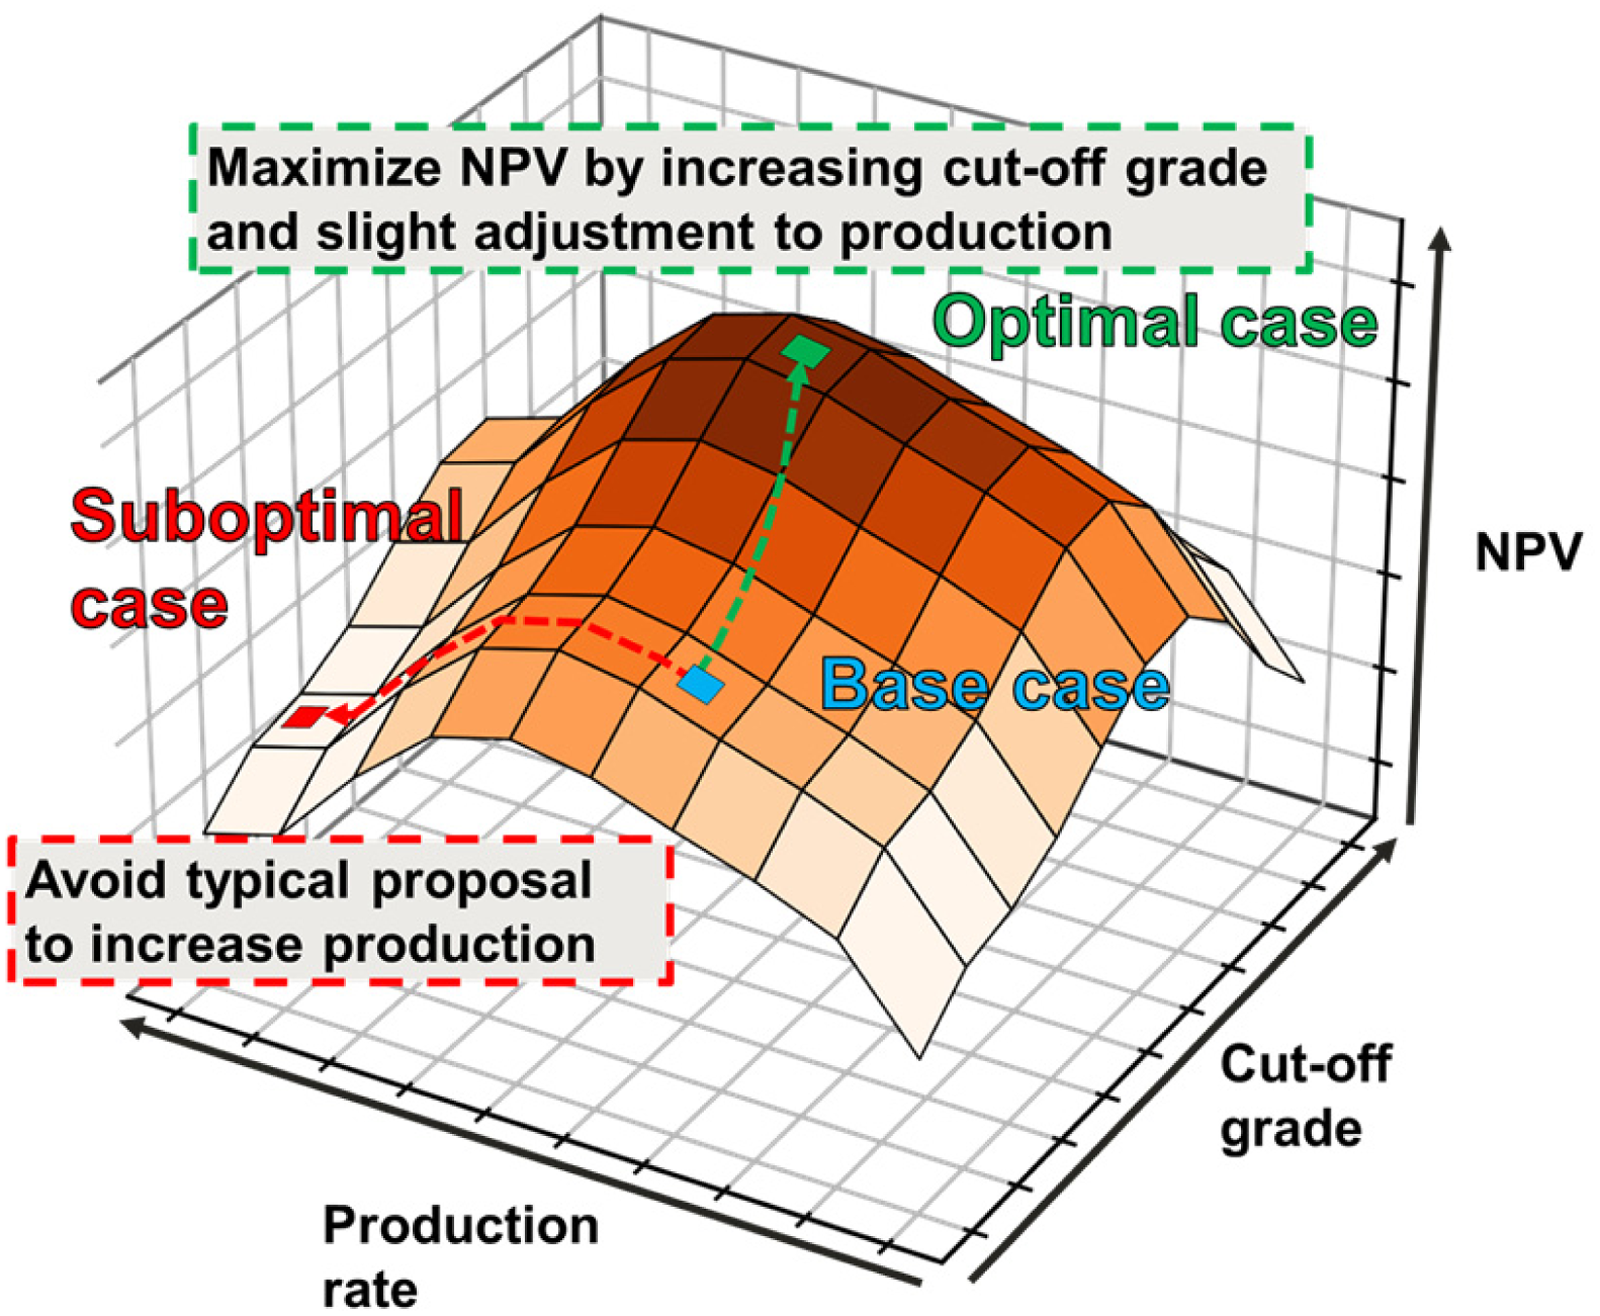
Hill of value schematic where bulk ore sorting is incorporated in a hypothetical mining operation where more trucks of ore are recovered from waste than waste trucks are rejected out of the ore stream and NPV can be maximised by increasing the cut-off grade. Modified from Faraj et al., (2023).
Conclusions and future work
The developed discretisation methodology is a practical tool which allows the practitioner to easily predict the ore control benefits of mining with enhanced selectivity for any open pit mining operation. Without running the discretisation algorithm, practitioners can also study simple geostatistical variables such as the CV, strip ratio, ore and waste grades all which are indicators of the potential benefit from more selective mining or use developed models to approximate head grade improvements. The results presented on three distinctly heterogeneous mines demonstrate how the bulk ore sorting value scales with more variable mines. In addition to the heterogeneity, greater benefits are achieved with finer discretisations allowing ore and waste to be better segregated but operational considerations must be made especially in the case of double truck loading or switching to a smaller loading system which negatively impacts production.
Future work is required to understand the optimal balance between production and selectivity which will depend on the grade heterogeneity of the mine. More heterogeneous deposits such as the Au mine in this study will benefit more from more selectivity while more homogeneous deposits such as the Cu mine will likely benefit more from higher productivity. Additionally, only two months of production data are studied here, a complete analysis of the heterogeneity throughout different pushbacks of a mine can inform mining equipment, investment in more selective mining techniques, and mine design parameters as distinctly heterogeneous zones are encountered. Finally, in-field validation using data from bulk ore sorting systems will allow for improvements in estimating the benefits and limitations of mining with enhanced selectivity.
Footnotes
Acknowledgements
Stewart Langley and the anonymous reviewers are acknowledged for their valuable contributions to the paper.
Declaration of conflicting interests
The authors declared no potential conflicts of interest with respect to the research, authorship and/or publication of this article.
Funding
The authors received no financial support for the research, authorship, and/or publication of this article.