
Abstract
Background
Retina is a non-invasive channel for assessing changes in brain microvasculature, which has been implicated in the pathophysiology of Alzheimer's disease (AD). Previous studies revealed significant relationship between clinically diagnosed AD and retinal vasculature. However, clinical diagnosis has limited sensitivity and specificity, and those investigations were conducted from traditional retinal fundus photographs which only captured a narrow section of the fundus.
Objective
Determining changes in retinal vasculature from larger area of retina between subjects with positron emission tomography (PET) biomarker-confirmed AD compared to controls.
Methods
Participants were recruited from the community and cognitive disorder clinics. Diagnosis of AD was confirmed by significant amyloid-β (Aβ) and tau uptake on PET scan. Retinal vasculature was imaged with ultra-widefield (UWF) scanning laser ophthalmoscopy and a series of vessel parameters were quantified using the semi-automated Singapore I Vessel Assessment (SIVA) software. Statistical analyses were adjusted for age, gender and systolic blood pressure. In addition, arteriole parameters were adjusted against the same measurements in venules, and vice versa.
Results
Out of the 39 patients, 18 had radiologically confirmed AD. These individuals with AD showed significantly smaller arteriolar fractal dimension (p = 0.032) in UWF images and greater venular tortuosity (p = 0.011) in standard fundus images compared with controls. Presence of significant Aβ and tau burden was associated with lower arteriolar caliber (OR 3.857; 95% CI 1.014–14.67; p = 0.048).
Conclusions
Reduction of fractal dimension in retinal arterioles observed in UWF imaging is associated with cerebral Aβ and tau burden in people with biomarker-confirmed AD. Wide field retinal imaging provides an alternative perspective in demonstrating microvascular alterations related to AD in this pilot study.
Keywords
Introduction
Alzheimer's disease (AD) is the most prevalent form of dementia worldwide and contributes to a significant socioeconomic burden. 1 Hallmarks of AD include extracellular amyloid-β (Aβ) plaques and neurofibrillary tangles comprised of intracellular phosphorylated tau protein, which gradually leads to neuronal death that manifests as amnesic symptoms. 2 There has been a consensus on the presence of the “preclinical AD” stage when pathological molecules accumulate while patients remain asymptomatic. 3
Historically, clinical diagnosis of AD is based on clinical signs of memory loss and declining cognitive function detected on neuropsychiatric testing. 4 However, this approach is limited by the non-specific nature of AD symptoms and signs, and the inability to identify patients at the early stages of the disease. Definitive diagnosis would require a post-mortem examination of an individual's brain. Improved technology allows a move towards the use of biomarkers for AD diagnosis—namely the AT(N) model—as proposed by the National Institute on Aging and the Alzheimer's Association (NIA-AA). 5 Under this framework, biomarkers are grouped into those related to Aβ (A), pathological tau aggregation (T), and neurodegeneration (N). AD is defined by the presence of both Aβ and tau biomarkers, as Aβ alone only indicates Alzheimer's pathologic change. Neurodegeneration signs and cognitive symptoms, neither of which are specific to AD, act as additional markers for disease severity. Positron emission tomography (PET) and cerebrospinal fluid (CSF) assays have become the gold standard to diagnose AD in vivo, and to identify individuals at preclinical stage. 6 Early diagnosis allows the opportunity for intervention with cholinesterase antagonists, N-methyl-D-aspartate (NMDA) antagonists or recently Food and Drug Administration (FDA) approved monoclonal antibodies (i.e., aducanumab and lecanemab),7,8 with the potential to mitigate symptoms and slow down the progression of disease, respectively. In addition, it has many personal benefits to patients and their loved ones to have a clear recognition of the pathology. 9 Nonetheless, these methods are lengthy, costly, sometimes invasive, and are not available in less developed countries with limited resources. They can also be impractical and unsafe to be carried out on frail elderly people who are most likely to require these tests.
As the eyes share the same embryological origin as the central nervous system, cerebral pathology could potentially be reflected in the ophthalmic apparatus. Postmortem studies have suggested increased Aβ deposition over retinal vessels in AD. 10 The same study showed that pericyte loss and low platelet-derived growth factor receptor-β (PDGFRβ) signaling—prominent features in predicting cognitive decline in AD patients—was observed in the retina and inversely correlated with retinal Aβ level. Observing the retina through fundoscopic imaging can act as a non-invasive method for assessing changes in the brain microvasculature, which has been implicated in the pathophysiology of AD. 11 Previous retinal imaging studies have revealed significant relationships between clinically diagnosed AD and alterations in retinal vasculature,12–15 mainly in arteriolar and venular caliber and fractal dimension, with mixed findings for changes in vessel tortuosity. However, the case definition of AD in these studies was not supported by biomarkers and the relationship of retinal vascular changes with intracranial Aβ and tau burden remains unclear. Also, vasculature from a limited view of the fundus was assessed in most previous studies, up to a 45-degree view with standard non-widefield fundus photography. With the emergence of ultra-widefield (UWF) imaging, the retina can now be assessed up to 200 degrees of the posterior pole and a substantial portion of the peripheral retina, with high resolution and short acquisition time (less than 0.4 s).16,17 Inclusion of a larger area of the retina might provide a more comprehensive picture of retinal vascular characteristics. Although a recent study attempted to evaluate retinal vascular changes in AD using UWF images, its AD case selection was based on clinical diagnosis and cognitive testing that is limited by examiners’ subjective judgement. 18
This cross-sectional study aims to determine changes in vasculature from a larger area of the retina captured on UWF imaging to obtain a more representative picture of vessel distribution and characteristics between subjects with PET biomarker-confirmed AD compared to controls, in line with recently updated NIA-AA diagnostic guidelines. 19
Methods
Participants were recruited from the Chinese University of Hong Kong - Screening for Early Alzheimer's Disease (CU-SEEDS) study. 20 The study protocol was approved by the human ethics boards of the Joint Chinese University of Hong Kong-New Territories East Cluster Clinical Research Ethics Committee and the Kowloon Central/East Research Ethics Committee, Hong Kong. Written consent was obtained from all individuals or their legal representatives.
Standardized inclusion and exclusion criteria were applied to avoid confounding comorbidities. Inclusion criteria include (1) Chinese ethnicity; and (2) 50 to 80 years old. Exclusion criteria were (1) known diagnosis of non-AD dementia; (2) history of significant organic cerebral disease (e.g., brain tumor, psychiatric condition, parkinsonism, epilepsy); (3) contraindication for PET; (4) inability to cooperate due to advanced dementia or unstable medical condition; (5) concurrent use of medications known to affect cognition (e.g., sedative narcotics); (6) known history of retinal disease or surgery; (7) known history of glaucoma; or (8) significant media opacity affecting visualization of retina. An experienced dementia specialist and an ophthalmologist independently examined all potential subjects for eligibility of this study.
All participants received 11C-Pittsburgh compound B (PIB) and 18F-T807 intravenously 35- and 85-min before PET scan, respectively. Uptake of biomarkers was quantified using the global cortical to cerebellum standard uptake value ratio (SUVR). Significant Aβ burden was defined as increased PIB uptake in regions known to be affected by AD (i.e., frontal lobe, parietal lobe, lateral temporal lobe, posterior cingulate, precuneus, caudate) or SUVR ≥1.42.20,21 Significant tau level was defined as increased 18F-T807 uptake in regions known to be affected by AD (i.e., medial temporal lobe, inferior and middle temporal lobe, medial and lateral parietal lobe, occipital and frontal lobe) or SUVR ≥1.14. 20 According to the level of Aβ and tau, each individual was classified according to the NIA-AA AT(N) system. Those exhibiting both A+ and T+, with any combinations of (N)+/− were placed in the “radiologically confirmed AD”, while others were in the “control” group (Table 1). N+/N- status was determined using FDG-PET. If hypometabolism was identified by a qualified clinical radiologist in certain brain regions consistent with AD (i.e., temporal lobe, superior parietal lobe, frontal lobe, posterior cingulate gyrus, precuneus), it would be classified as N+ and vice versa.
Demographic characteristics of individuals with and without significant Aβ burden or tau.
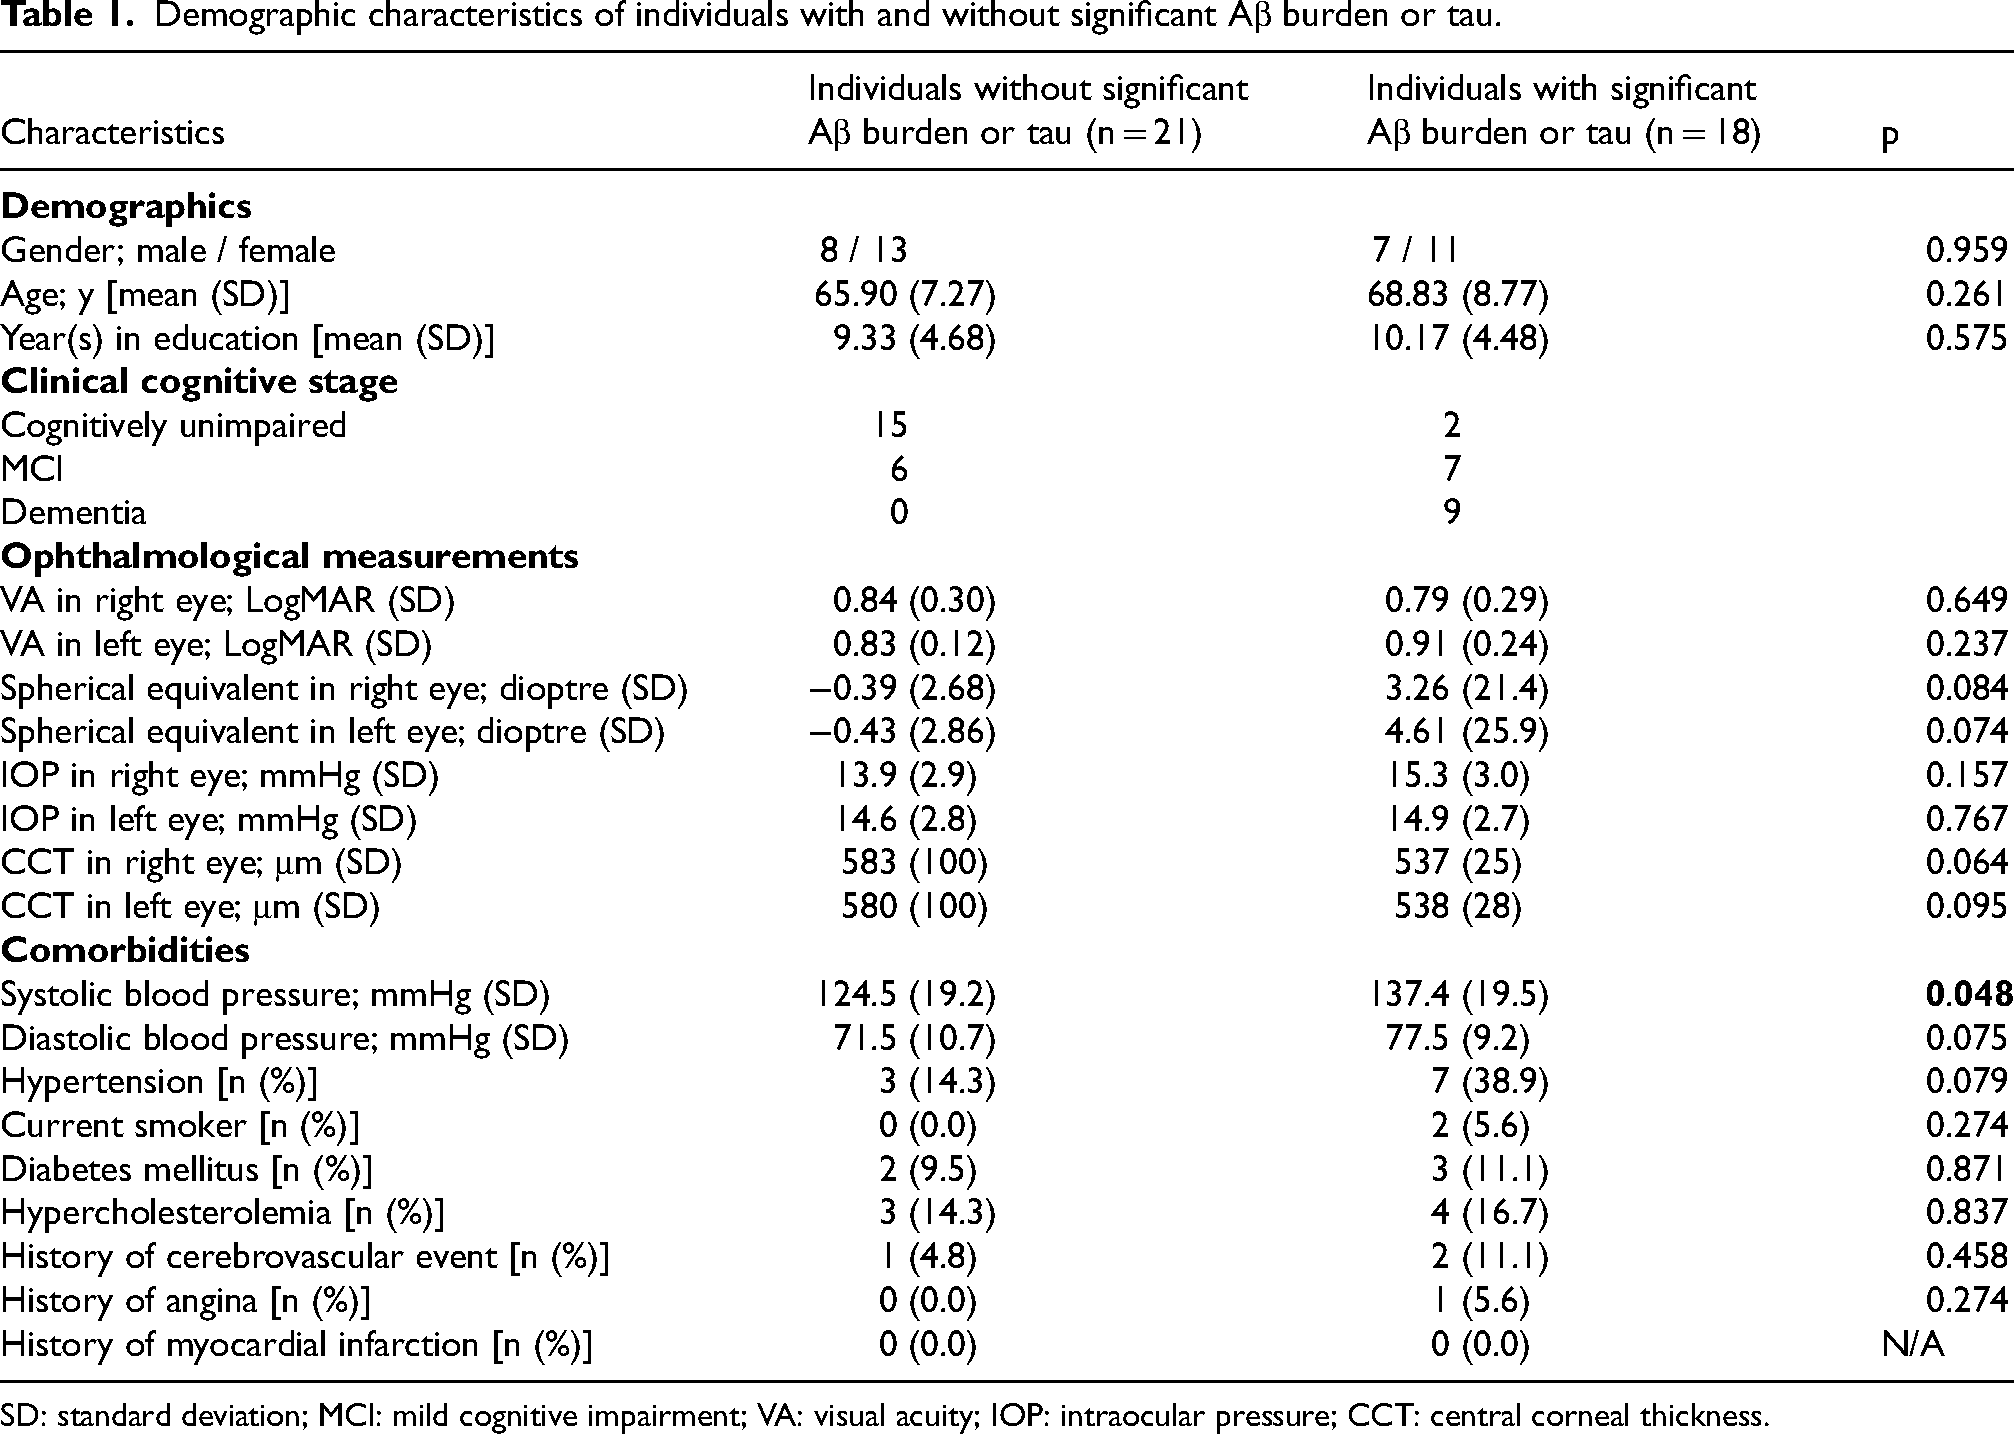
SD: standard deviation; MCI: mild cognitive impairment; VA: visual acuity; IOP: intraocular pressure; CCT: central corneal thickness.
Colour UWF-SLO imaging was performed with Daytona (Optos, Dunfermline, UK) obtained with resolution of 3698 × 2448 pixels, using red (635 nm) and green (532 nm) wavelengths lasers. Images which were degraded by media opacity, motion artefacts or significant interference from eyelashes were excluded from analysis. If data from both eyes were eligible for analysis, a random number generator is used to choose only one eye for subsequent analysis. Retinal vasculature was analysed using semi-automated Singapore I Vessel Assessment (SIVA) software (version 3.0). SIVA analysis was performed both over the conventional 2-disc diameter (2DD) area from the optic disc and an extended area of 7DD from the optic disc (Figure 1). The SIVA software automatically generates vessel tracing and classifies vessel type (arteries versus veins). The automatic vessel tracings were evaluated and, if necessary, manually adjusted by a trained grader according to a standardized protocol. 22
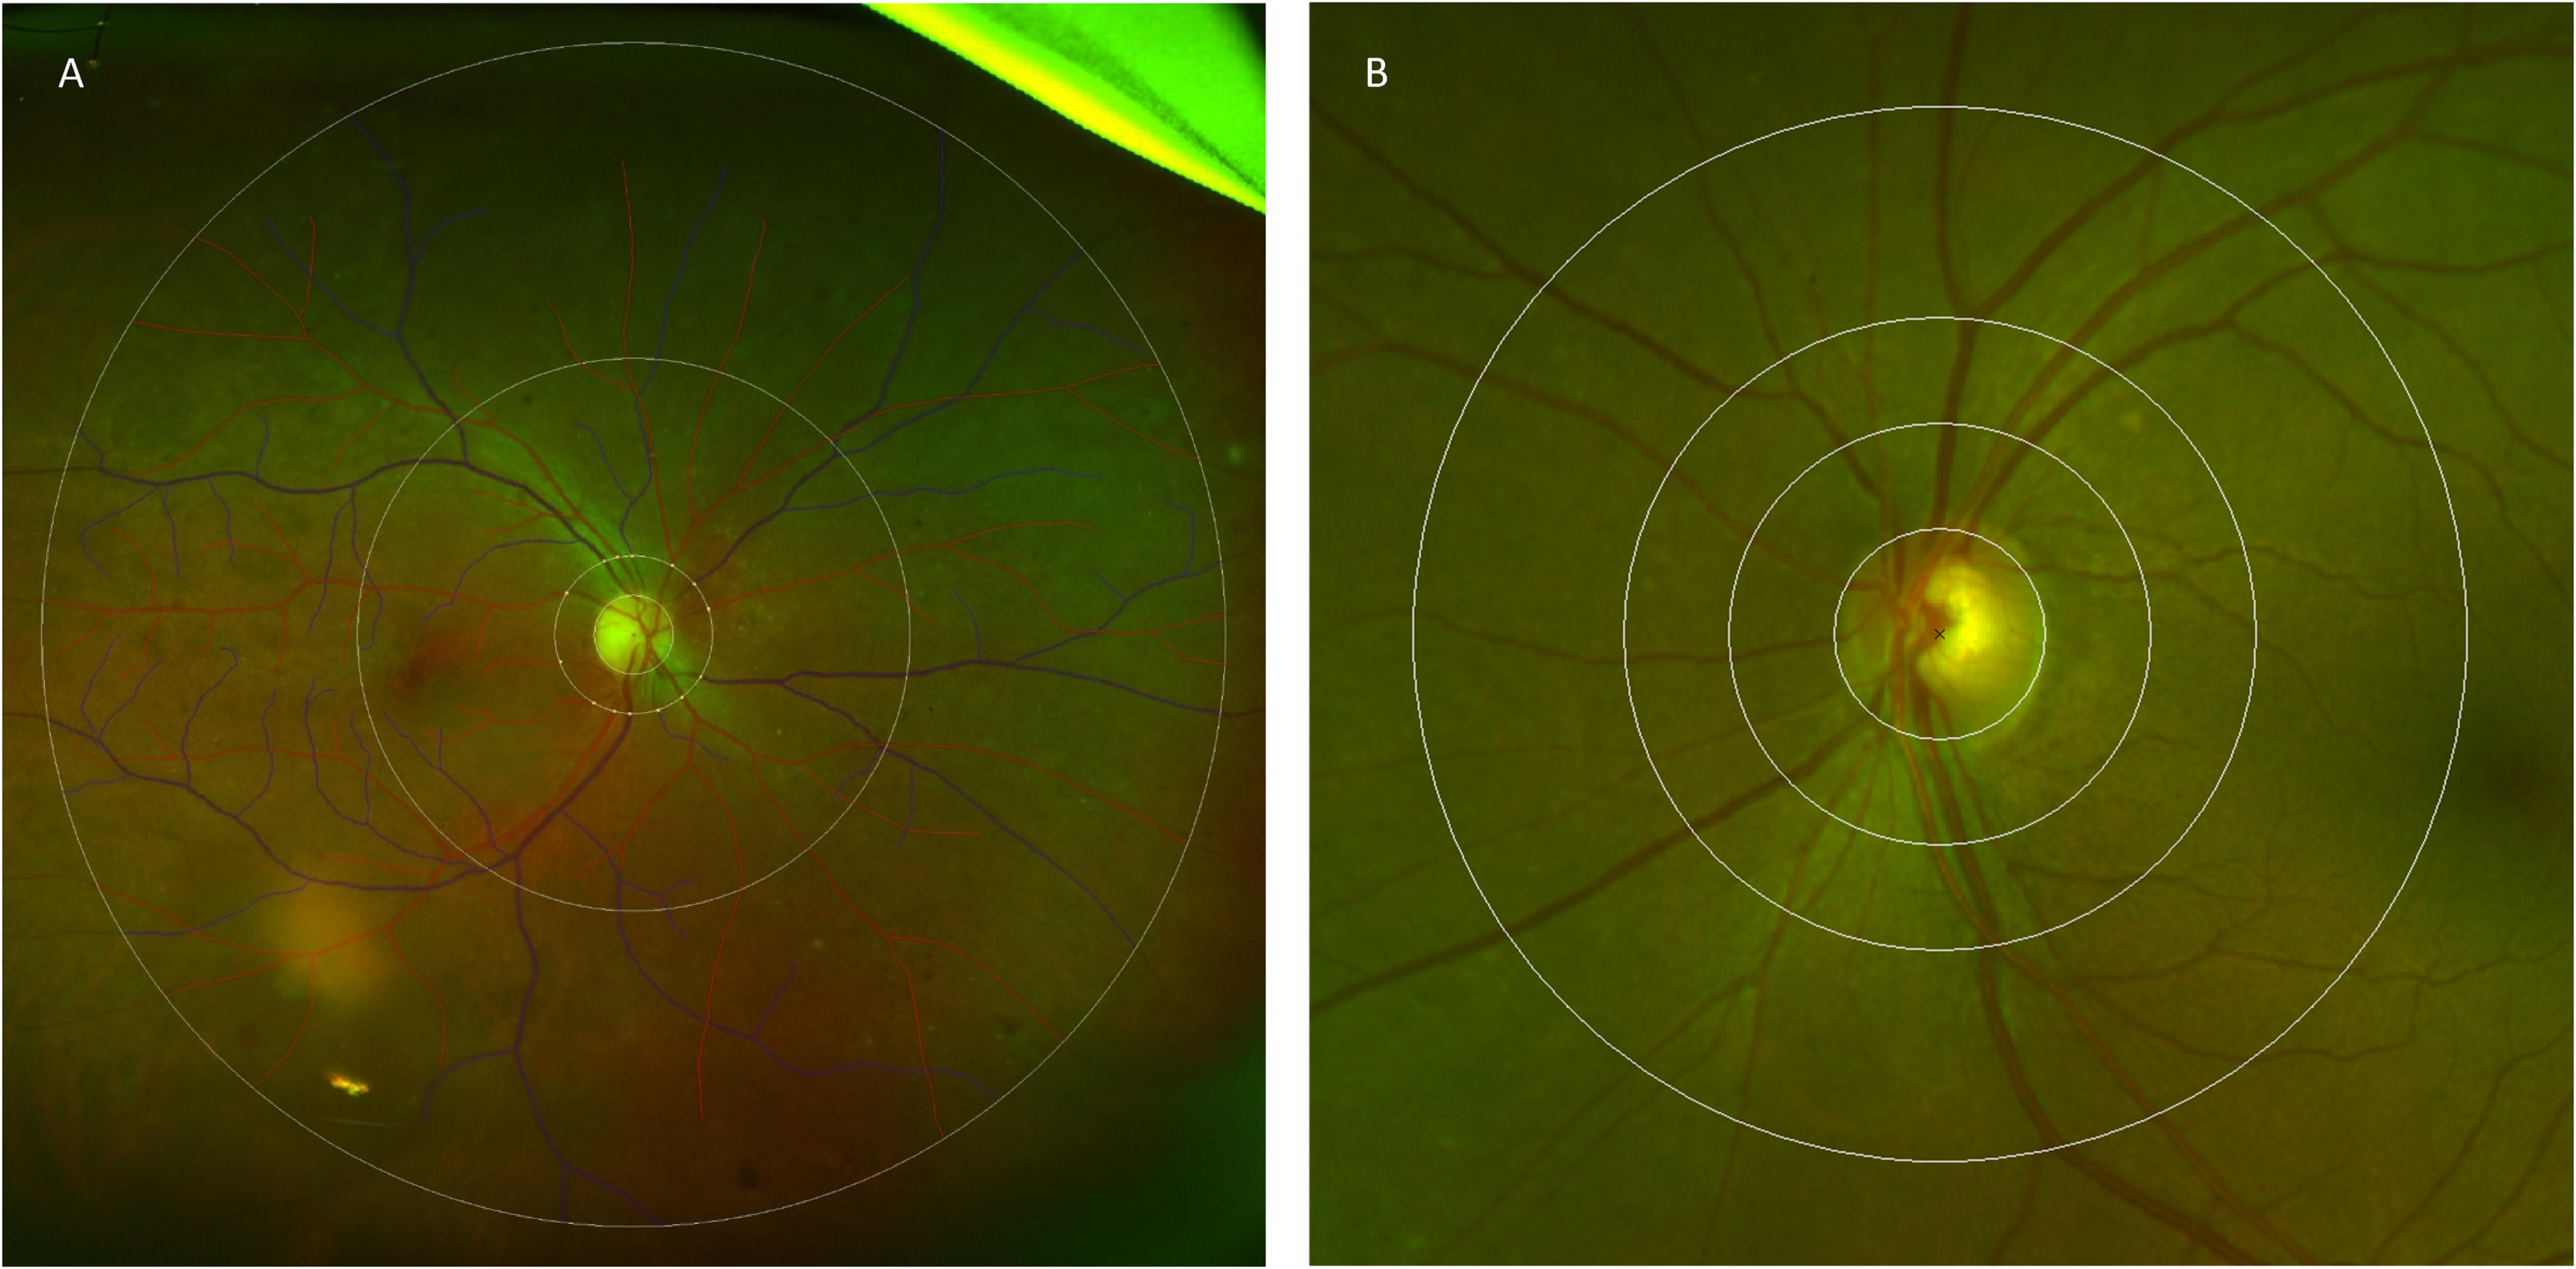
Ultra-wide field (UWF) retinal photograph assessed by Singapore I vessel assessment (SIVA) software. Retinal vascular parameters were measured either between 0.5- and 7.0-disc diameters (A) and 0.5- to 2.0-disc diameters (B) away from the disc margin.
Retinal vascular parameters were automatically measured by the SIVA program within the area of interest, 23 including central retinal artery equivalent (CRAE), central retinal vein equivalent (CRVE), fractal dimensions and vascular tortuosity. Applying the revised Knudtson-Parr-Hubbard formula, retinal arteriolar and venular caliber values were converted to CRAE and CRVE, respectively. 24 Fractal dimensions of vessels were calculated using the box-counting method following a sequence of line tracing, with each straight line perpendicular to direction of vessel growth connecting the periphery of vessel wall. The resultant value summarizes the general branching pattern of the retinal vascular tree covered within the imaged area, and larger values correlate with more complex branching pattern. Retinal vascular tortuosity is a dimensionless ratio derived from dividing the integral of curvature square along arteriolar or venular path by the total path length, obtaining average retinal arteriolar and venular tortuosity respectively. 22 Higher values of tortuosity reflect greater curvature within vessels, and vice versa for straighter ones. For continuous analysis, retinal vascular tortuosity was log-transformed because of its skewed distribution.
Demographic information and co-morbidities of all individuals were recorded, including age, gender, prevalence of active smokers, hypertension, diabetes, dyslipidemia and history of cerebrovascular disease. Subjects were diagnosed with hypertension if 1) systolic blood pressure (SBP) equals to or is above 140 mmHg and/or diastolic blood pressure (DBP) equals to or is over 90 mmHg; 2) previous known diagnosis of hypertension; 3) current use of hypertensive medications.
All statistical analyses were performed using SPSS statistics version 28.0. Independent t-test and chi-squared test were used to compare the demographic and ophthalmic characteristics between AD and control group. Logistic regression analyses were performed to determine the odds of retinal vessel parameters with the presence of cerebral Aβ and tau. Multivariable logistic regression models were adjusted for age, gender, SBP and fellow vessel parameters. Any vessel parameter found to be significantly associated with the presence of cerebral Aβ and tau was then rendered for further multiple regression analysis to characterize its association with the biomarker levels.
Results
Out of the 39 patients, 18 were found to have radiological biomarker confirmed diagnosis of AD on PET scans. Between AD and control groups, there were no statistical differences in baseline demographics. Although SBP was found to be higher in individuals with AD compared to controls (124.5 mmHg versus 137.4 mmHg), the mean values of both groups were lower than the cut-off of hypertension.
Subjects with AD showed a significantly smaller arteriolar fractal dimension within 7DD when compared to control (control 1.373 versus AD 1.322, p = 0.032), while this difference was not observed when only 2DD of the retina was examined (Table 2). Analysis of vessel parameters within 2DD of optic disc (Table 2) found a higher venular tortuosity (control 1.084 versus AD 1.098, p = 0.011) in AD subjects.
Retinal vascular parameter in ultra-wide field (UWF) and standard fundus photos between individuals with and without significant Aβ burden or tau.
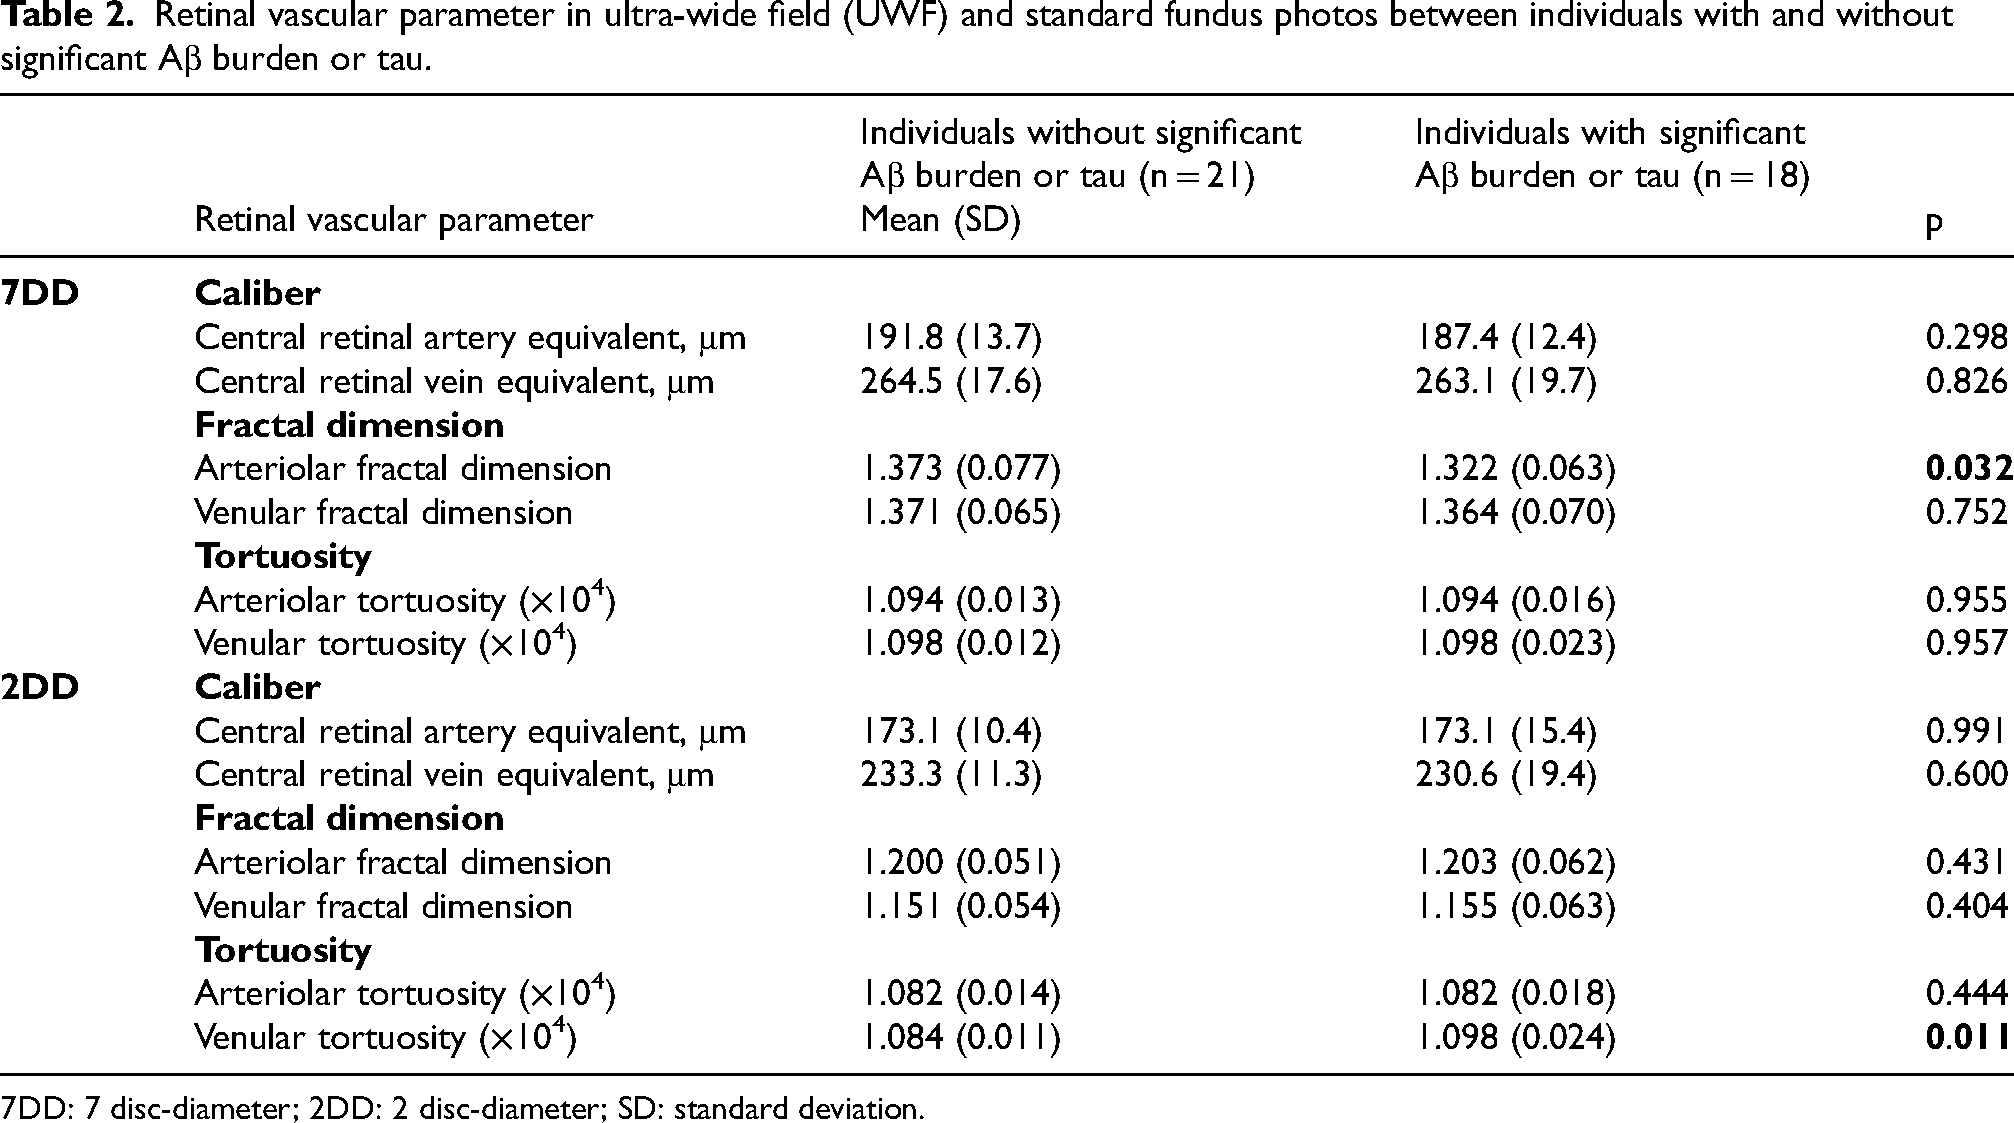
7DD: 7 disc-diameter; 2DD: 2 disc-diameter; SD: standard deviation.
In the logistic regression model controlling for age, gender, SBP and fellow vessel caliber, a smaller CRAE over 7DD area (odds ratio [OR] per SD decrease, 3.857; 95% confidence interval [CI] 1.014–14.67; p = 0.048). None of the vessel parameters measured over 2DD area was associated with a higher odd of being diagnosed with AD (Table 3).
Association between Alzheimer's disease (AD) and retinal vascular parameters in ultra-wide field (UWF) and standard fundus photos adjusted for age, gender, systolic blood pressure (SBP) and fellow vessel parameters.
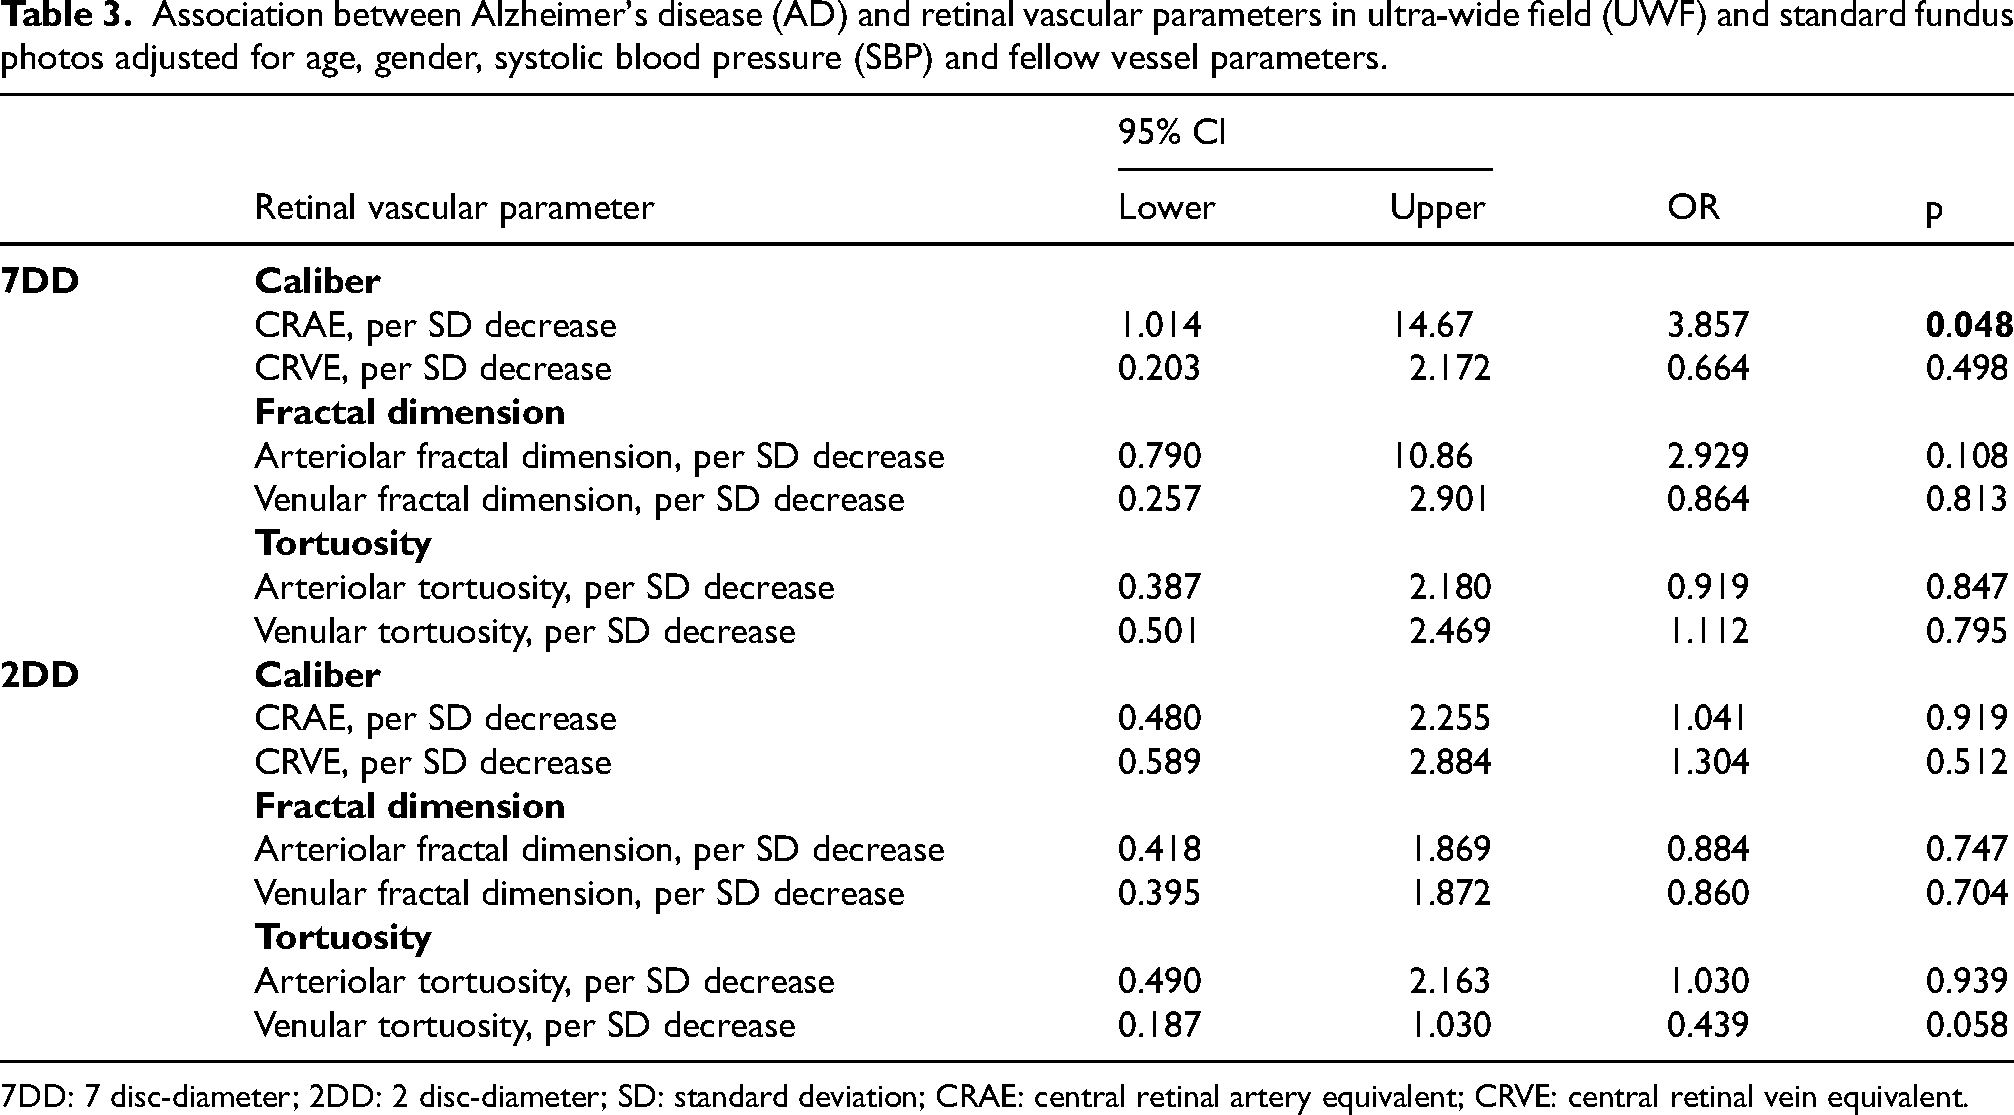
7DD: 7 disc-diameter; 2DD: 2 disc-diameter; SD: standard deviation; CRAE: central retinal artery equivalent; CRVE: central retinal vein equivalent.
Multiple regression revealed statistically significant correlation between CRAE and arteriolar fractal dimension measured in UWF images with Aβ or tau burden below threshold for AD diagnosis (Table 4; Figure 2). On the other hand, multiple regression of data collected from standard fundus photo demonstrated association between venular tortuosity and tau level in the AD group (Table 5).
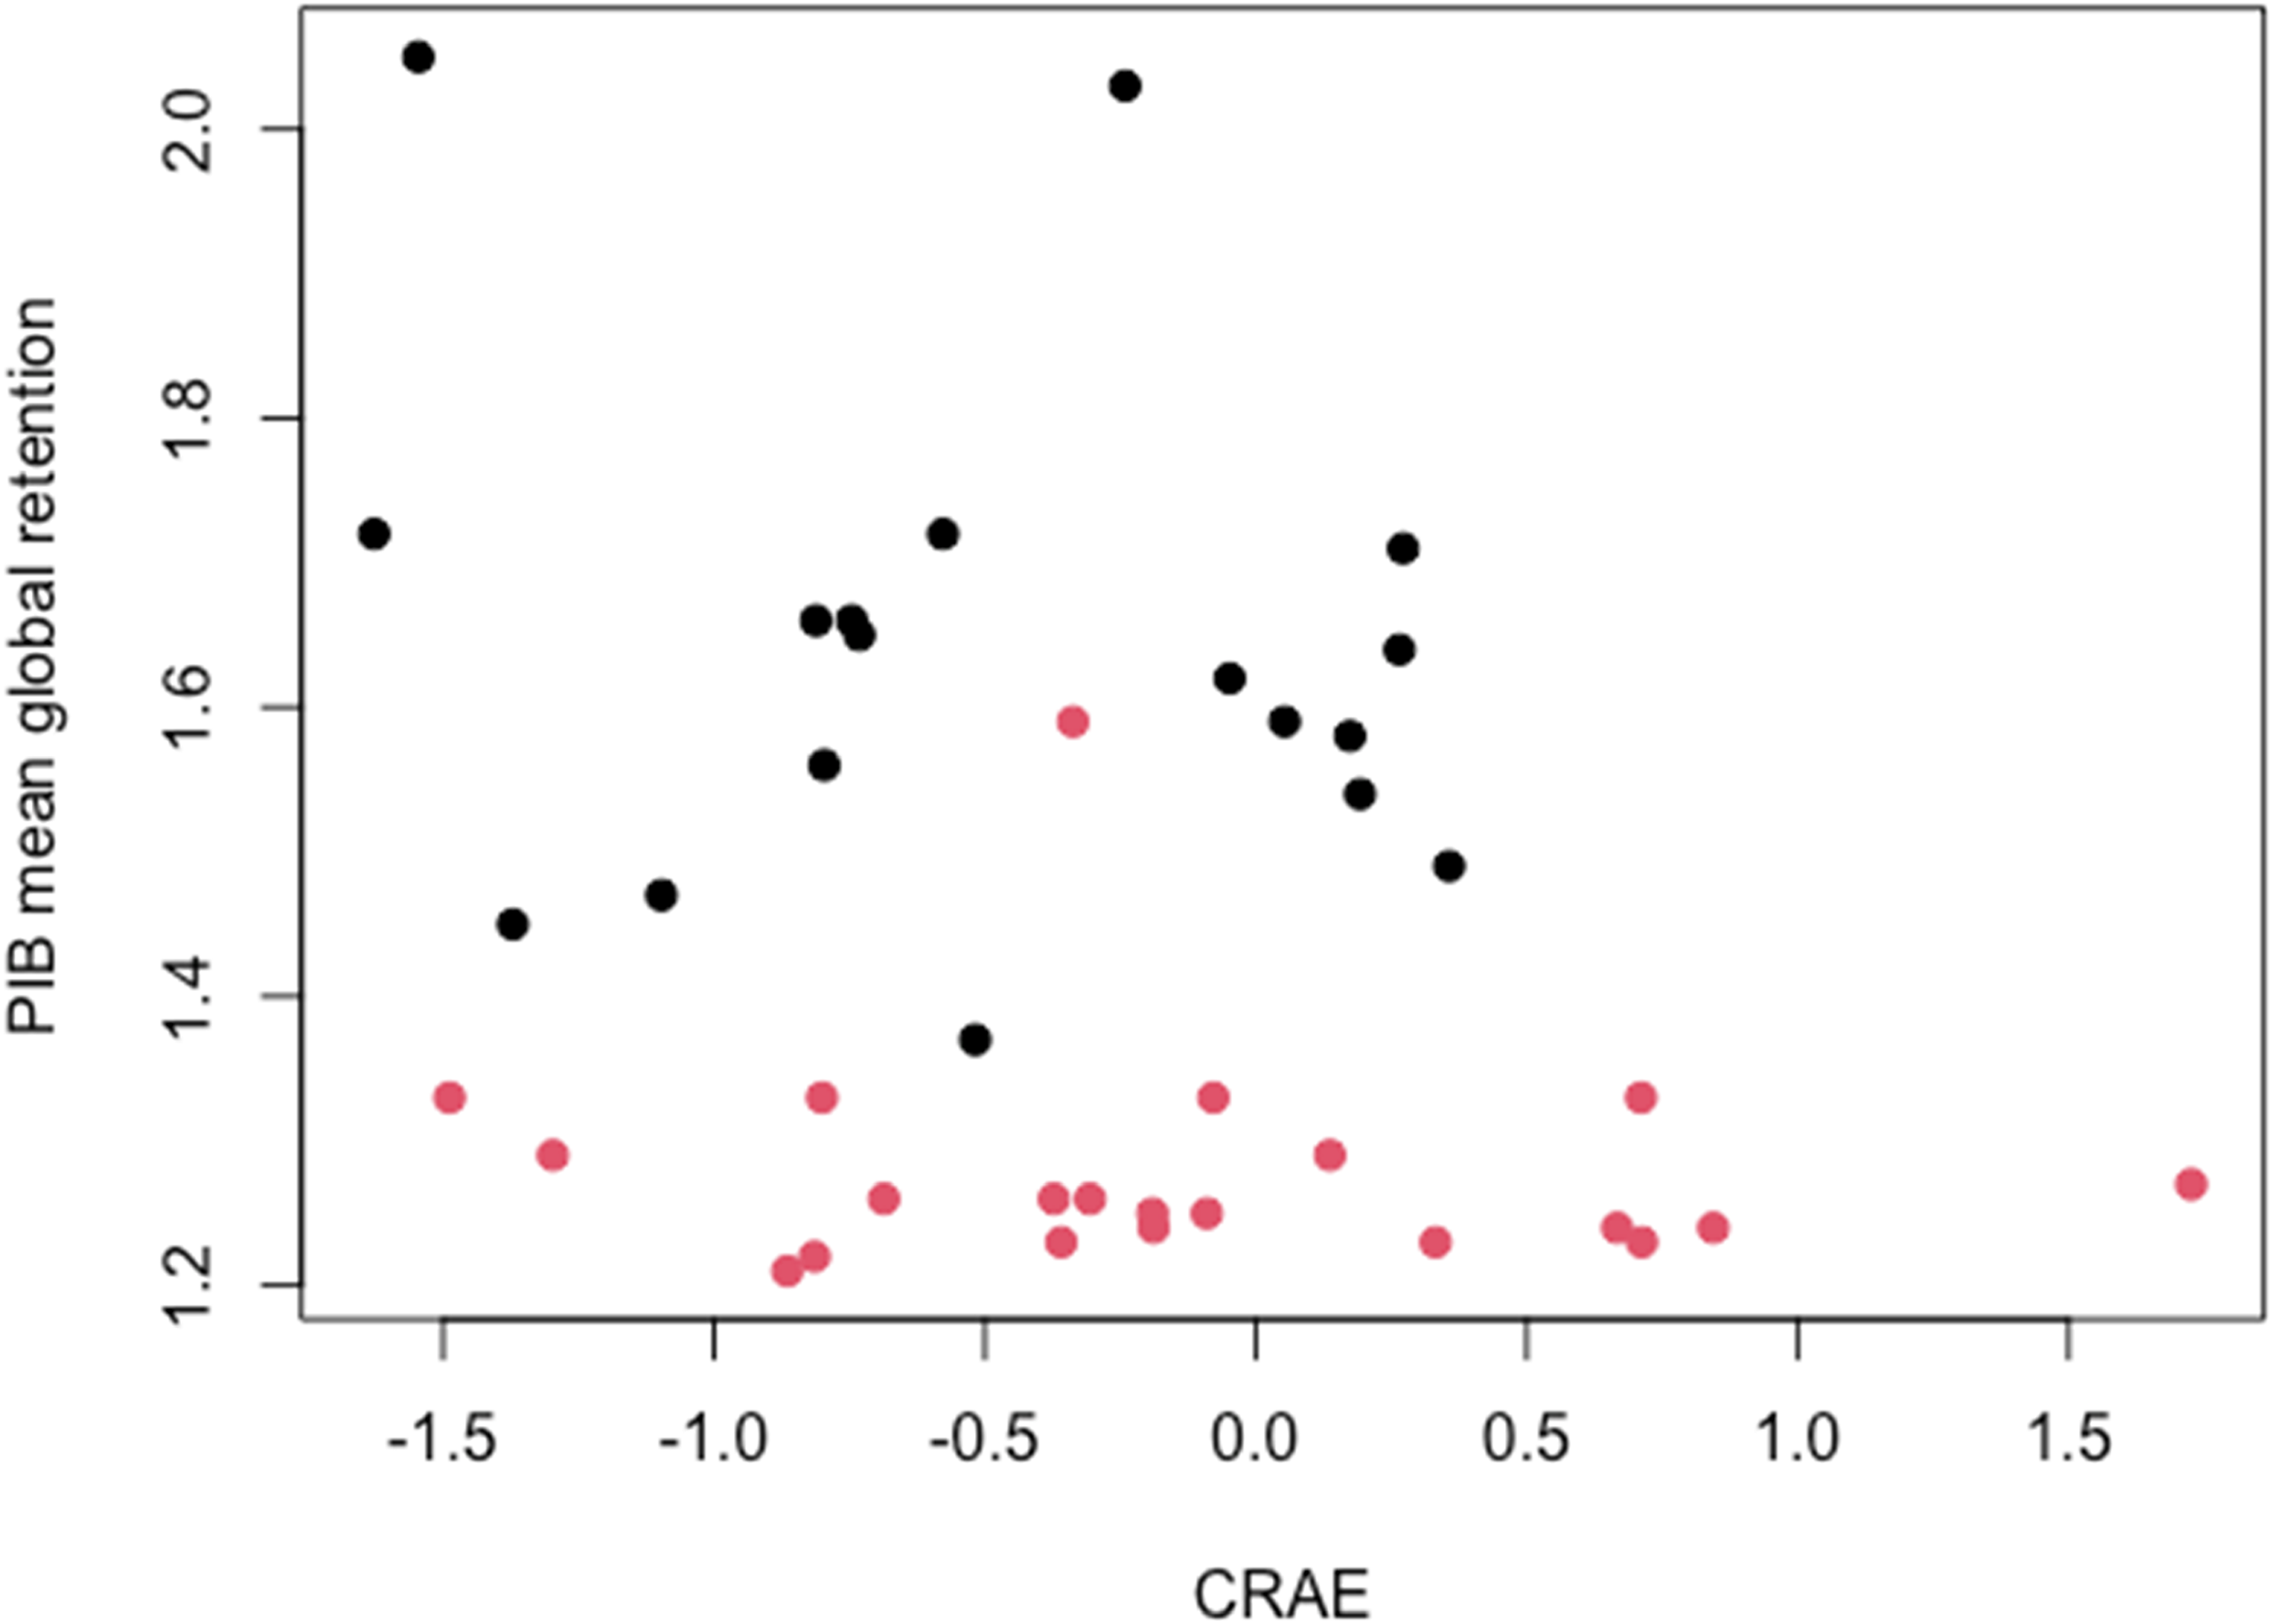
Scatter plot showing relationship between Aβ burden represented by 11C-PIB mean global retention and adjusted Z-scores of central retinal artery equivalent (CRAE) of the control group (red) and AD group (black) extracted from ultra-wide field (UWF) images over 7-disc diameter (7DD) area.
Multiple regression analysis between biomarker index and arterial parameters within 7-disc diameter area (7DD) adjusted for age, gender, and systolic blood pressure (SBP).
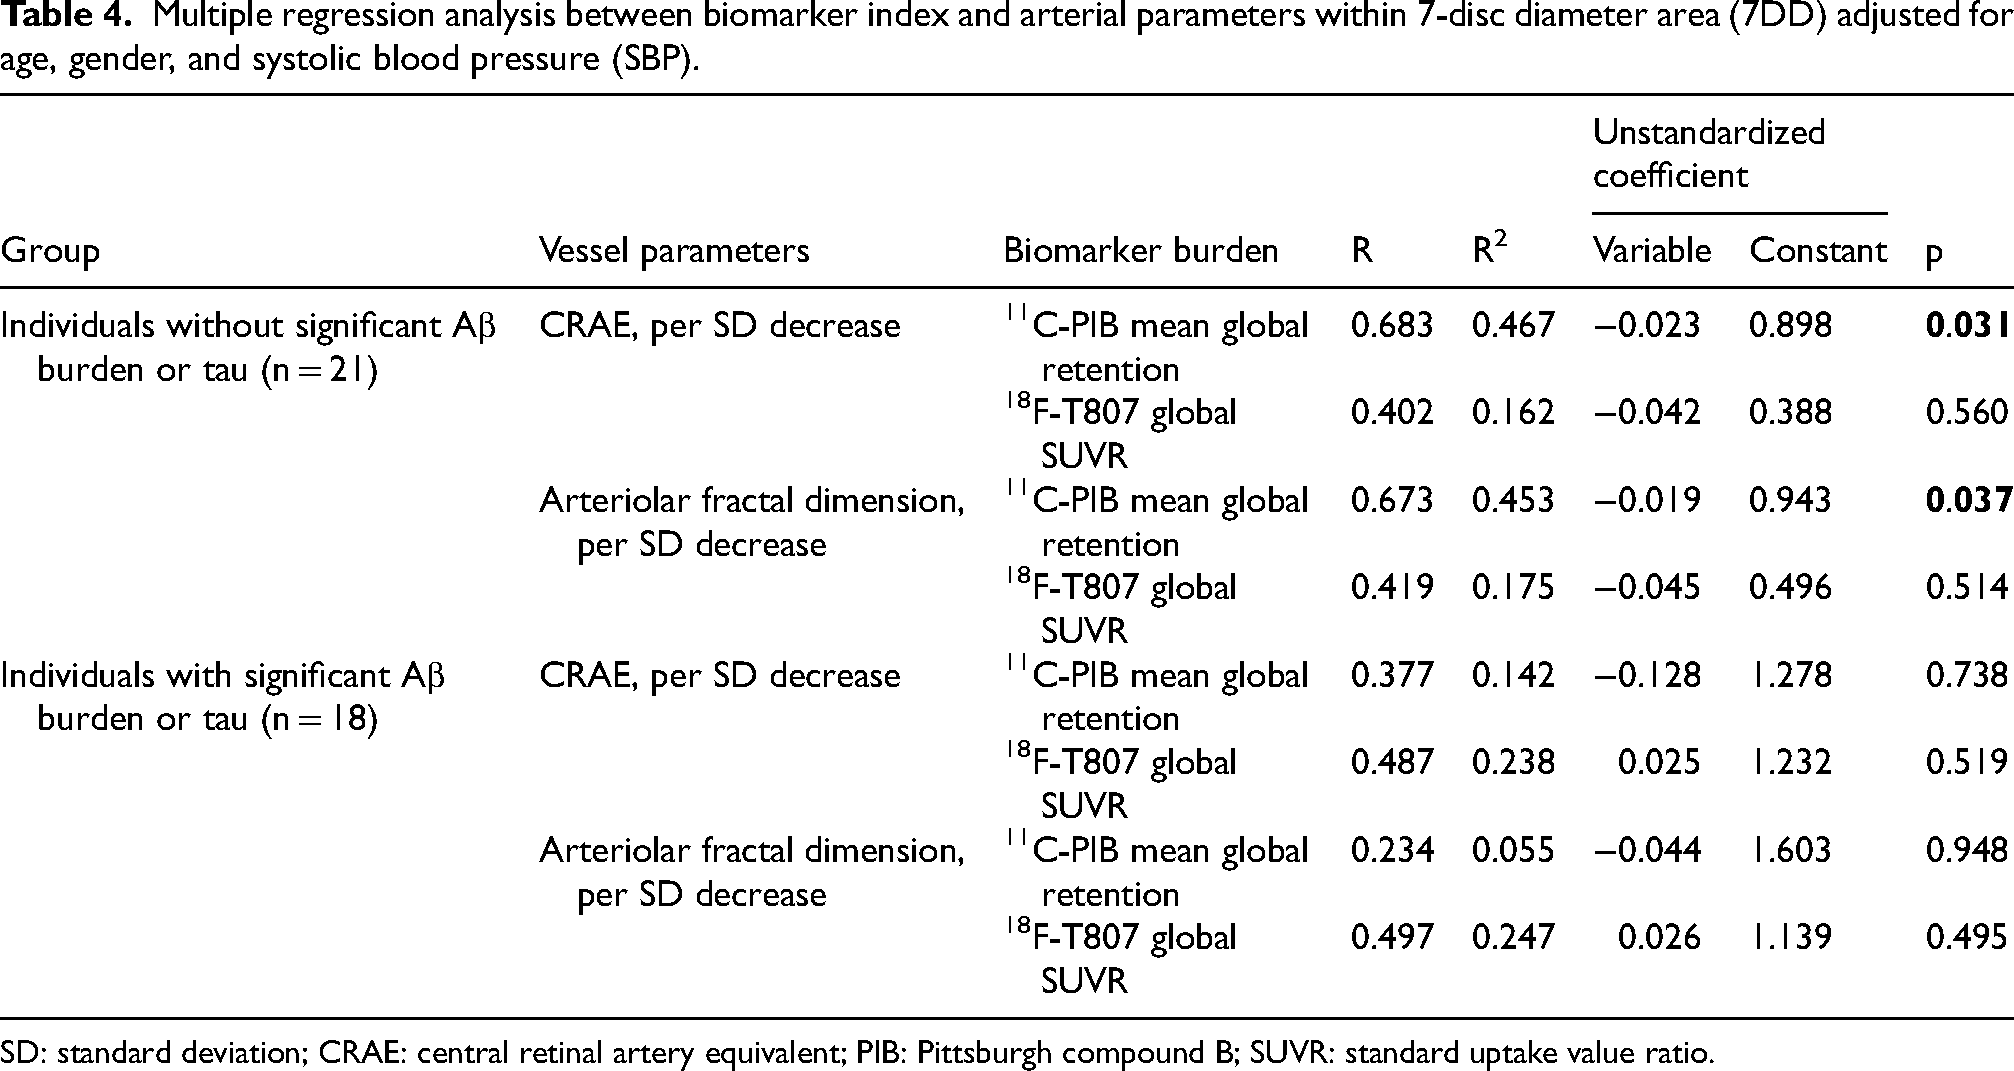
SD: standard deviation; CRAE: central retinal artery equivalent; PIB: Pittsburgh compound B; SUVR: standard uptake value ratio.
Multiple regression analysis between biomarker index and arterial parameters within 2-disc diameter (2DD) area adjusted for age, gender, and systolic blood pressure (SBP).
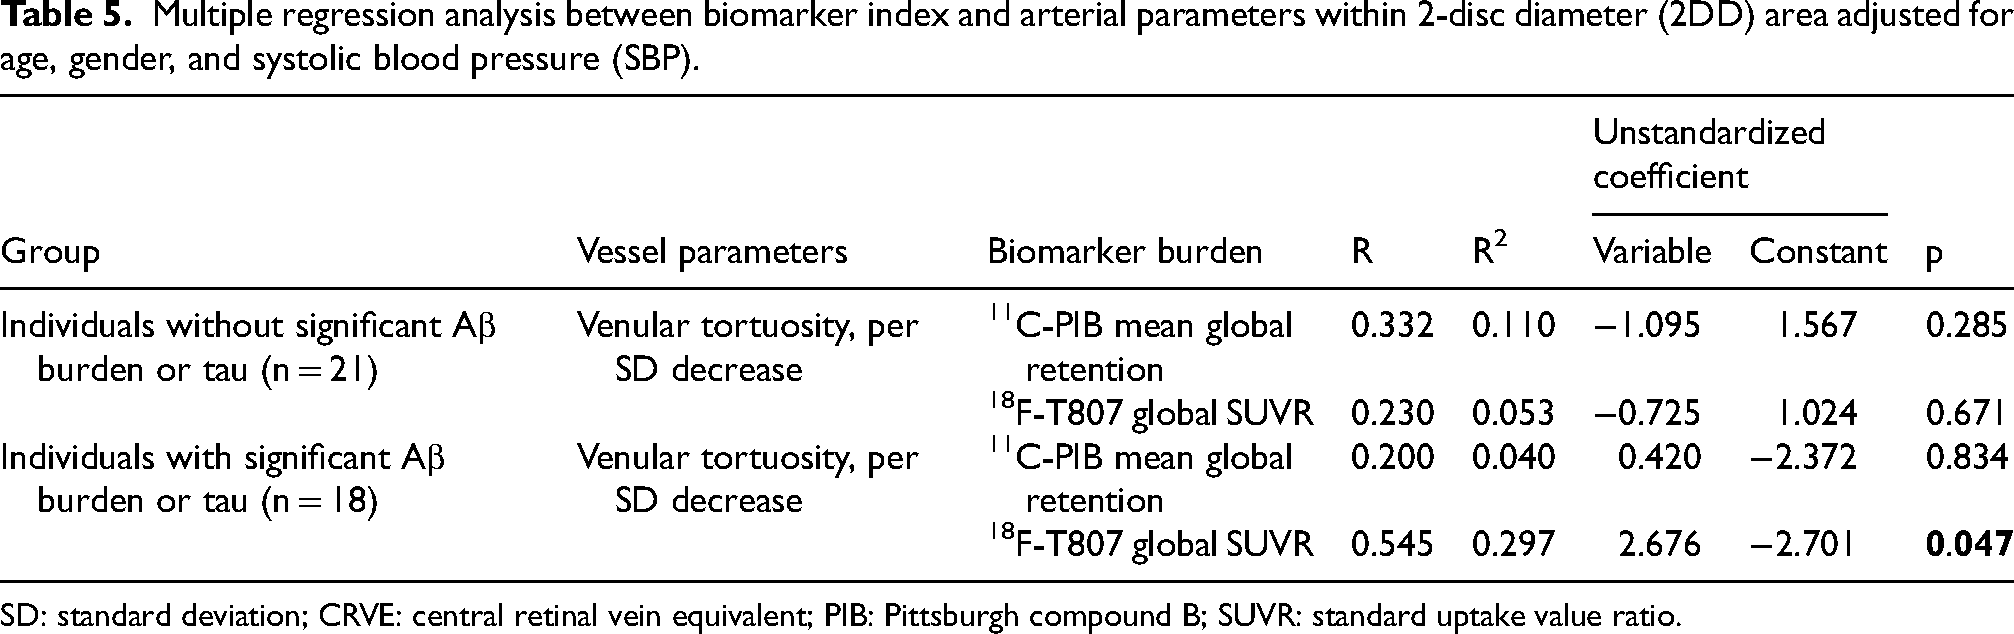
SD: standard deviation; CRVE: central retinal vein equivalent; PIB: Pittsburgh compound B; SUVR: standard uptake value ratio.
Discussion
Using UWF retinal imaging on PET biomarker-diagnosed AD patients and age-gender-race-matched controls, our study demonstrated that AD was associated with narrower retinal arteriolar diameter, after adjusting for confounding variables; potentially reflecting similar changes in cerebral microvasculature. Our results also align with the previous studies showing smaller arteriolar and venular fractal dimensions in AD. 25 Seven studies showed reduced both arteriolar and venular caliber and fractal dimension but found mixed results for arteriolar tortuosity, three of which defined AD with biomarker-based imaging (Table 6).12–14,18,26–28 Two of the seven aforementioned studies captured UWF images found reduced arteriolar width gradient and tortuosity, as well as increased venular width gradient.14,18 However, both used clinical criteria to select AD subjects with conflicting results on arteriolar fractal dimension, one found increased vessel branching in midperiphery 18 while the other showed lower arteriolar fractal dimension. 14
Summary of results of studies investigation relationship between Alzheimer's disease (AD) and retinal vascular parameters.
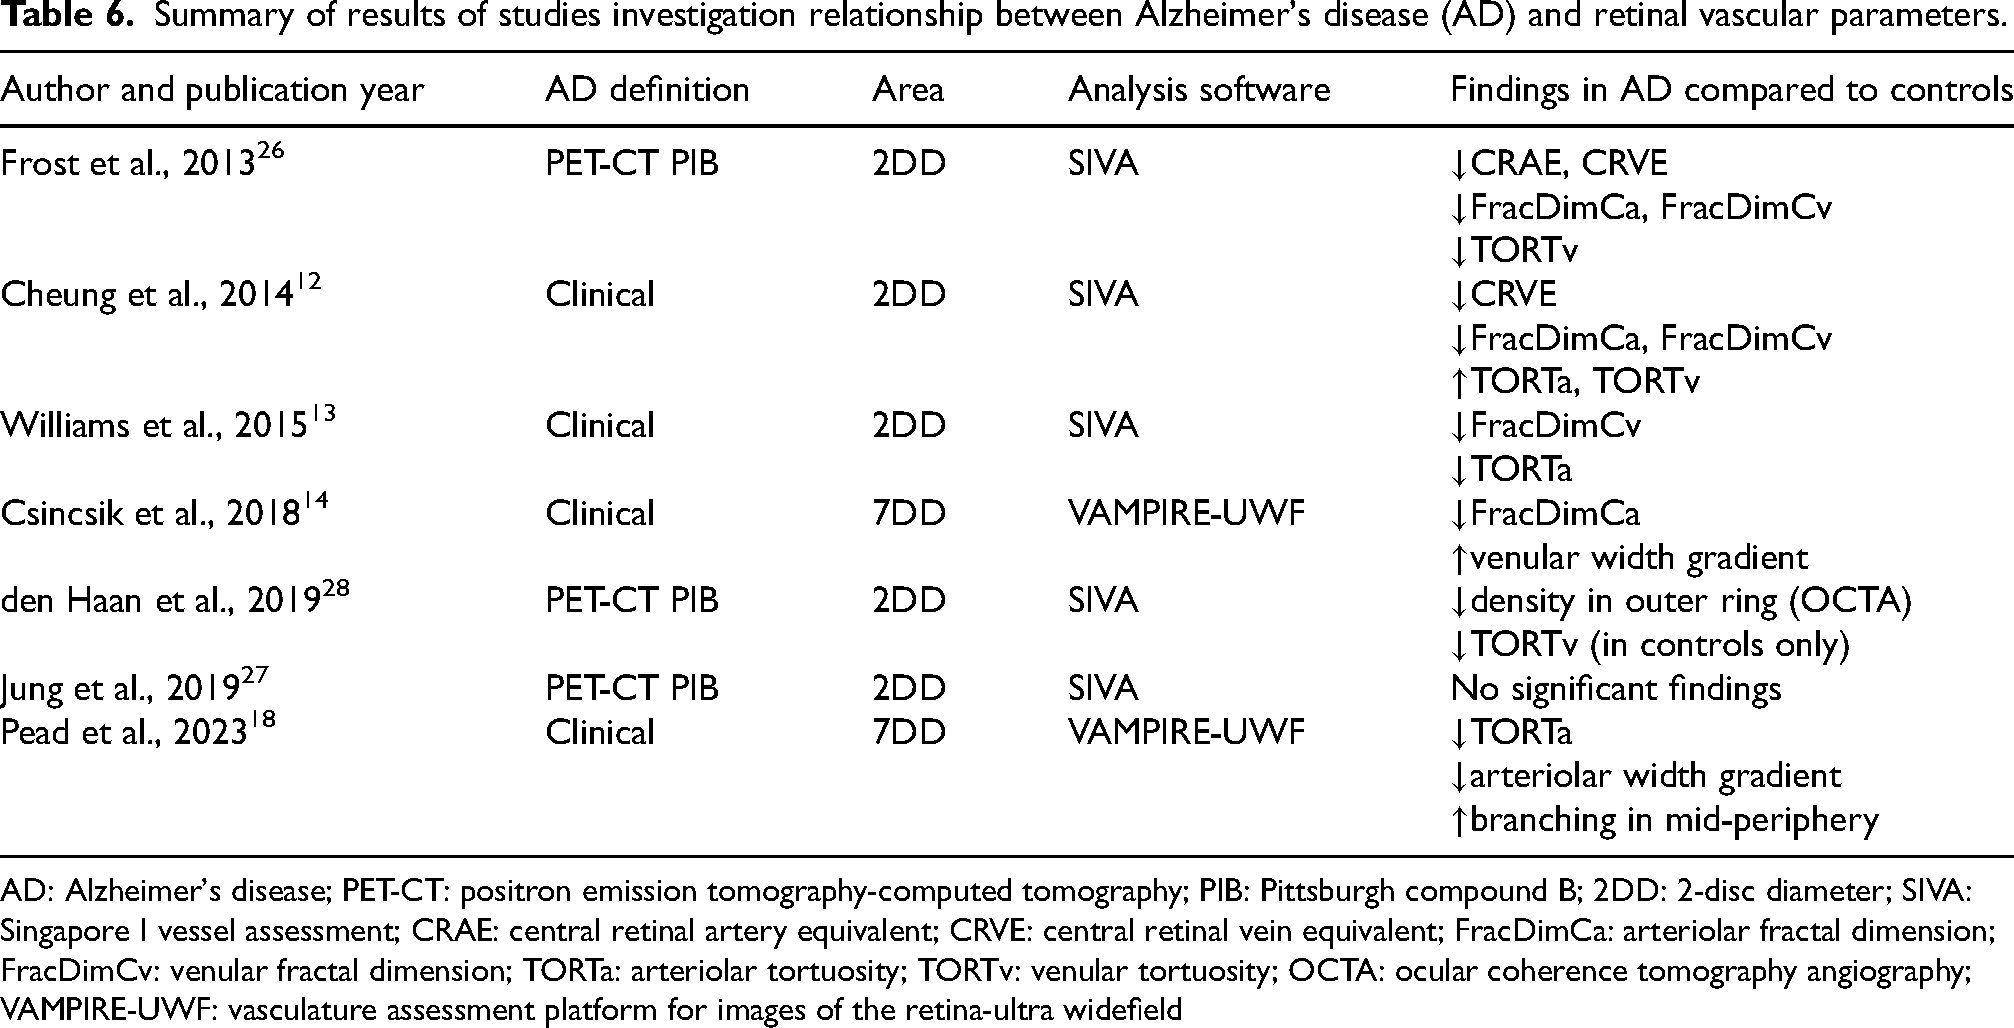
AD: Alzheimer's disease; PET-CT: positron emission tomography-computed tomography; PIB: Pittsburgh compound B; 2DD: 2-disc diameter; SIVA: Singapore I vessel assessment; CRAE: central retinal artery equivalent; CRVE: central retinal vein equivalent; FracDimCa: arteriolar fractal dimension; FracDimCv: venular fractal dimension; TORTa: arteriolar tortuosity; TORTv: venular tortuosity; OCTA: ocular coherence tomography angiography; VAMPIRE-UWF: vasculature assessment platform for images of the retina-ultra widefield
UWF image captures a wider area of retina, with the benefit of including more vessels for better assessment of fractal dimension; thus explains the reduced arteriolar fractal dimension seen in 7DD area, but not within 2DD images. Meanwhile, tortuosity is better examined within a smaller area. As the denominator for calculating tortuosity (i.e., total path length) increases when a larger area retina is accounted for, which may weaken the significance of the nominator (i.e., curvature measured). This is suggested by the significantly increased venular tortuosity found in standard fundus photos only. The small magnitude of difference detected at a group level suggests that it is not clinically significant and there is limited application for drawing a clear biomarker threshold for predicting individuals’ likelihood of being affected by AD. Nonetheless, our findings provide proof-of-concept results for further investigations comparing differences between 2DD and 7DD retinal vessel parameters and their relationship with AD.
The association between brain vasculature and AD has long been established in both mice models and postmortem histopathology examinations. Cerebrovascular changes often precede AD symptoms and signs, deteriorate during disease course, and worsen cognitive decline. 29 Narrower retinal vessels could be correlated with white matter arteriolar dysfunction unresponsive to bradykinin release in patients with AD-related neuropathological changes and microvascular cerebral infarcts, 30 postulated to be caused by nitric oxide- or reactive oxygen species-mediated vascular endothelial abnormalities. The higher the neuropathological grading, the lower the vasodilation response is to bradykinin. In vivo studies revealed that the exact location of cerebral vascular constriction may be in cerebral capillaries surrounded by pericytes, rather than arterioles, which strongly correlated with the dosage of inoculated Aβ. 31 Pericytes in cerebral capillaries are integral in maintaining and regulating the blood-brain barrier (BBB) that keeps toxic products and large proteins away from the central nervous system, 32 as well as removing excess Aβ within the brain. 33 Imaging and biochemical studies of CSF have not only found increased permeability of BBB in AD patients compared to controls, 34 but disruptions in BBB observed in postmortem samples of brain tissue from patients with AD has also been correlated with lower pericyte numbers. 35 It is unclear whether the level of pathological Aβ and tau thought to be responsible for AD progression correlates with the extent of pericyte loss and BBB breakdown, although studies in aged monkeys with high BBB permeability have sequestered radioactively tagged Aβ protein in cerebrovascular system. 36 Impaired cerebral capillary regulation and Aβ clearance in affected brain regions may contribute to gradual decline in their respective functions. Decreased vessel caliber, reduction in vascular density and increased tortuosity had all been shown to correlate with Aβ accumulation and functional compromise.37–39 Individuals with AD may have increased vessel tortuosity as Aβ affecting endothelial cells causes vascular dysfunction and loss, leading to proliferation of vessels with abnormal morphology around missing vasculature, 40 subsequently reducing cerebral blood flow along with aberrant cholinergic innervation and arteriolar vasoconstriction.31,41 Meanwhile, lower arteriolar density in human specimens may be attributed to lower levels of angiogenic growth factors secondary to deposition of vascular endothelial growth factor in the vascular bed as it binds with Aβ peptides.42,43 Aβ accumulation first occurs in cerebral veins before affecting arteries. 44 Strengths of our study include this being one of the few studies that define AD using imaging biomarkers, which has superior sensitivity and specificity to clinical assessment methods, whilst correlation with UWF allows characterization of a greater extent of the retina. This study in a Chinese population could expand the ethnic diversity within the pool of data looking at correlation between AD and retinal vessel parameters, majority of which were performed in individuals of Caucasian descent.
Despite using objective diagnostic criteria and assessment of retinal vessel characteristics using a validated software, there are several limitations to our study. Small sample size of our cohort might limit the statistical power to detect any additional significant results. Meanwhile, as UWF imaging captures the curved nature of the retina, it flattens the original image which may induce systematic errors in vessel parameter measurements. There are also other confounding factors that were not controlled for, such as APOE ε4 genotype. Longitudinal studies to observe change in vessel parameters over time with severity of disease progression would be helpful in establishing the temporal relationship between the two. As most of our AD patients had cognitive symptoms, it will be worthwhile to conduct a study with a larger sample with higher proportion of preclinical AD or early AD to evaluate the effectiveness of retinal vascular analysis in detecting pathology at an earlier disease stage.
Footnotes
Acknowledgments
The authors have no acknowledgments to report.
Author contributions
Kristie Hing Chi Leung (Formal analysis; Writing – original draft); Victor Chan (Conceptualization; Data curation; Methodology; Writing – review & editing); Bonnie Lam (Investigation; Methodology; Writing – review & editing); Vincent Mok (Conceptualization; Investigation; Writing – review & editing); Carol Cheung (Conceptualization; Investigation; Resources; Supervision; Writing – review & editing).
Funding
The author(s) disclosed receipt of the following financial support for the research, authorship, and/or publication of this article: This work was funded by SEEDS Foundation Ltd.
Declaration of conflicting interests
The author(s) declared no potential conflicts of interest with respect to the research, authorship, and/or publication of this article.
Data availability
The data supporting the findings of this study are available on request from the corresponding author. The data are not publicly available due to privacy or ethical restrictions.