
Abstract
Background
With recent advances in disease-modifying therapies for Alzheimer's disease (AD), demand for confirmatory biomarker testing such as via cerebrospinal fluid (CSF) analysis or amyloid positron emission tomography (PET) will increase considerably for diagnosis.
Objective
To assess the current capacity and estimating the anticipated future need of AD confirmatory testing in the United States (US).
Methods
A population-based decision tree model was employed to simulate the AD diagnostic pathway for patients presenting with symptoms of mild cognitive impairment or mild dementia in primary and secondary care in the US. All patients were assumed to be enrolled in Medicare. The study was conducted from the US payer's perspective over a 5-year period. Four scenarios assessed the impact of different utilization patterns: (1) reference scenario (current use in AD diagnostic pathway: < 1% amyloid-PET; 3.5% CSF analysis); (2) increased CSF analysis utilization scenario (50% utilization); (3) amyloid-PET only; and (4) CSF analysis only.
Results
Scenario 1 fails to meet the growing demand for AD confirmatory testing (assumed annual care-seeking rate of 50%), with approximately 0.3% of all amyloid-β-positive patients receiving a timely and accurate diagnosis with amyloid-PET, and 1.7% with CSF analysis. Scenarios 2 and 4 resulted in the highest proportion of accurate and timely diagnoses for amyloid-β-positive patients (24.8% and 44.6%, respectively) versus 15.1% of patients in scenario 3.
Conclusions
It is imperative to address capacity issues for AD confirmatory testing to facilitate timely diagnosis and initiation of amyloid-targeting therapies. Increasing CSF analysis utilization has the capacity to meet this growing demand.
Keywords
Introduction
Alzheimer's disease (AD) is a neurodegenerative disorder defined by hallmark neuropathologic changes, such as the accumulation of amyloid-β (Aβ) plaques comprising aggregated Aβ and the formation of neurofibrillary tangles containing aggregated tau proteins. 1 There are various methods to detect AD-related changes in amyloid and tau proteins, including amyloid- and tau-positron emission tomography (PET), or by direct measure in cerebrospinal fluid (CSF) and blood. 2 Without the use of imaging or fluid biomarker testing in clinical practice, the accuracy of clinical AD diagnosis is low, around 70%. 3 This translates into missed or delayed diagnosis of AD, particularly in the earlier stages of the disease (i.e., mild cognitive impairment [MCI] and mild dementia), where new disease-modifying therapies (DMTs) are most effective in slowing cognitive decline as shown in studies conducted.4–7
Currently, confirmatory testing of Aβ pathology via amyloid-PET and/or CSF measurement is recommended to qualify patients for amyloid removal by prescription of DMTs.5,7,8 Compared with CSF analysis, amyloid-PET has the advantage of visualizing the location of Aβ pathology in the brain and is viewed as less invasive, but there is limited accessibility and scalability of PET scanners, as well as higher associated costs in comparison with lumbar puncture for CSF testing. 9 While amyloid-PET scans and CSF analysis are both individually well-validated and approved components in the diagnostic workup of AD patients in combination with neuropsychological and cognitive assessments, in some instances (particularly when clinical findings are uncertain), combining amyloid-PET with CSF analysis results can offer added diagnostic value and help refine the diagnosis. 10
The increasing availability of DMTs is anticipated to trigger a surge in the demand for diagnostic testing, in particular, exacerbating existing resource constraints for confirmatory biomarker testing. 11 Given the limited time and availability of primary care physicians, neurologists, and dementia specialists in the United States (US) and the scarcity of PET scanners for amyloid confirmation, the diagnostic pathway encounters substantial capacity challenges. 12 This is heightened by the limited utilization of CSF analysis in the US and PET scanning constraints due to various factors (Medicare data suggest that PET scanning is used in <1% and CSF analysis is used in approximately 3.5% of people undergoing confirmatory testing for AD),12–14 in addition to the anticipated pressures from the rising number of patients with AD in the coming decades. 15 Moreover, the recent expansion of coverage for amyloid-PET testing under the Centers for Medicare & Medicaid Services (CMS), and the predicted increased demand for confirmatory testing in order to prescribe DMTs, may contribute to increased costs.16,17 As DMTs reverse or slow disease progression most effectively in patients in the early symptomatic stages of AD, such as MCI and mild dementia, early diagnosis via confirmatory testing is critical for the timely initiation of such therapies.8,18,19 Consequently, addressing the growing demand for confirmatory testing is imperative to ensure that patients have access to appropriate AD therapies and management.
Using a population-based decision tree model, this study aimed to assess the current capacity for AD confirmatory testing and the budget impact, specifically amyloid-PET and CSF analysis, and to recognize the anticipated future need for such testing with the availability of DMTs in the US. Moreover, the study aimed to inform solutions to address the increased demand for AD confirmatory testing.
The population-based decision tree model simulated the AD diagnostic pathway for patients presenting with symptoms of MCI or mild dementia in primary and secondary care in the US.
Methods
Study population and setting
The study population reflected the treatment-eligible population for DMTs (Table 1), who were those with early-stage AD, specifically those with MCI or mild dementia due to AD and evidence of amyloid plaque burden. The population size was derived from US Census (2023) and CMS data projections.20,21 The population was assumed to be stable, meaning that those seeking care in previous years were excluded in the consecutive years, with only a small percentage of individuals who were false-negative for AD re-entering the model and facing capacity constraints. Patients were assumed to be aged between 65 and 90 years, presented with symptoms of MCI or mild dementia in primary or secondary care settings, and were enrolled in Medicare.8,19,22–24 This study was conducted from a US payer's perspective over a 5-year time period. The mean age of patients was assumed to be 71.4 years, with females accounting for 51.6% of the population. 19 The prevalence of Aβ pathology was assumed to be ∼35% based on internal (data on file at Roche Diagnostics International Ltd, Rotkreuz, Switzerland) and external data, which ranged between 20% and 50%.24,25
Decision tree model parameters and assumptions regarding the study population and setting, and the diagnostic performance and costs for AD.
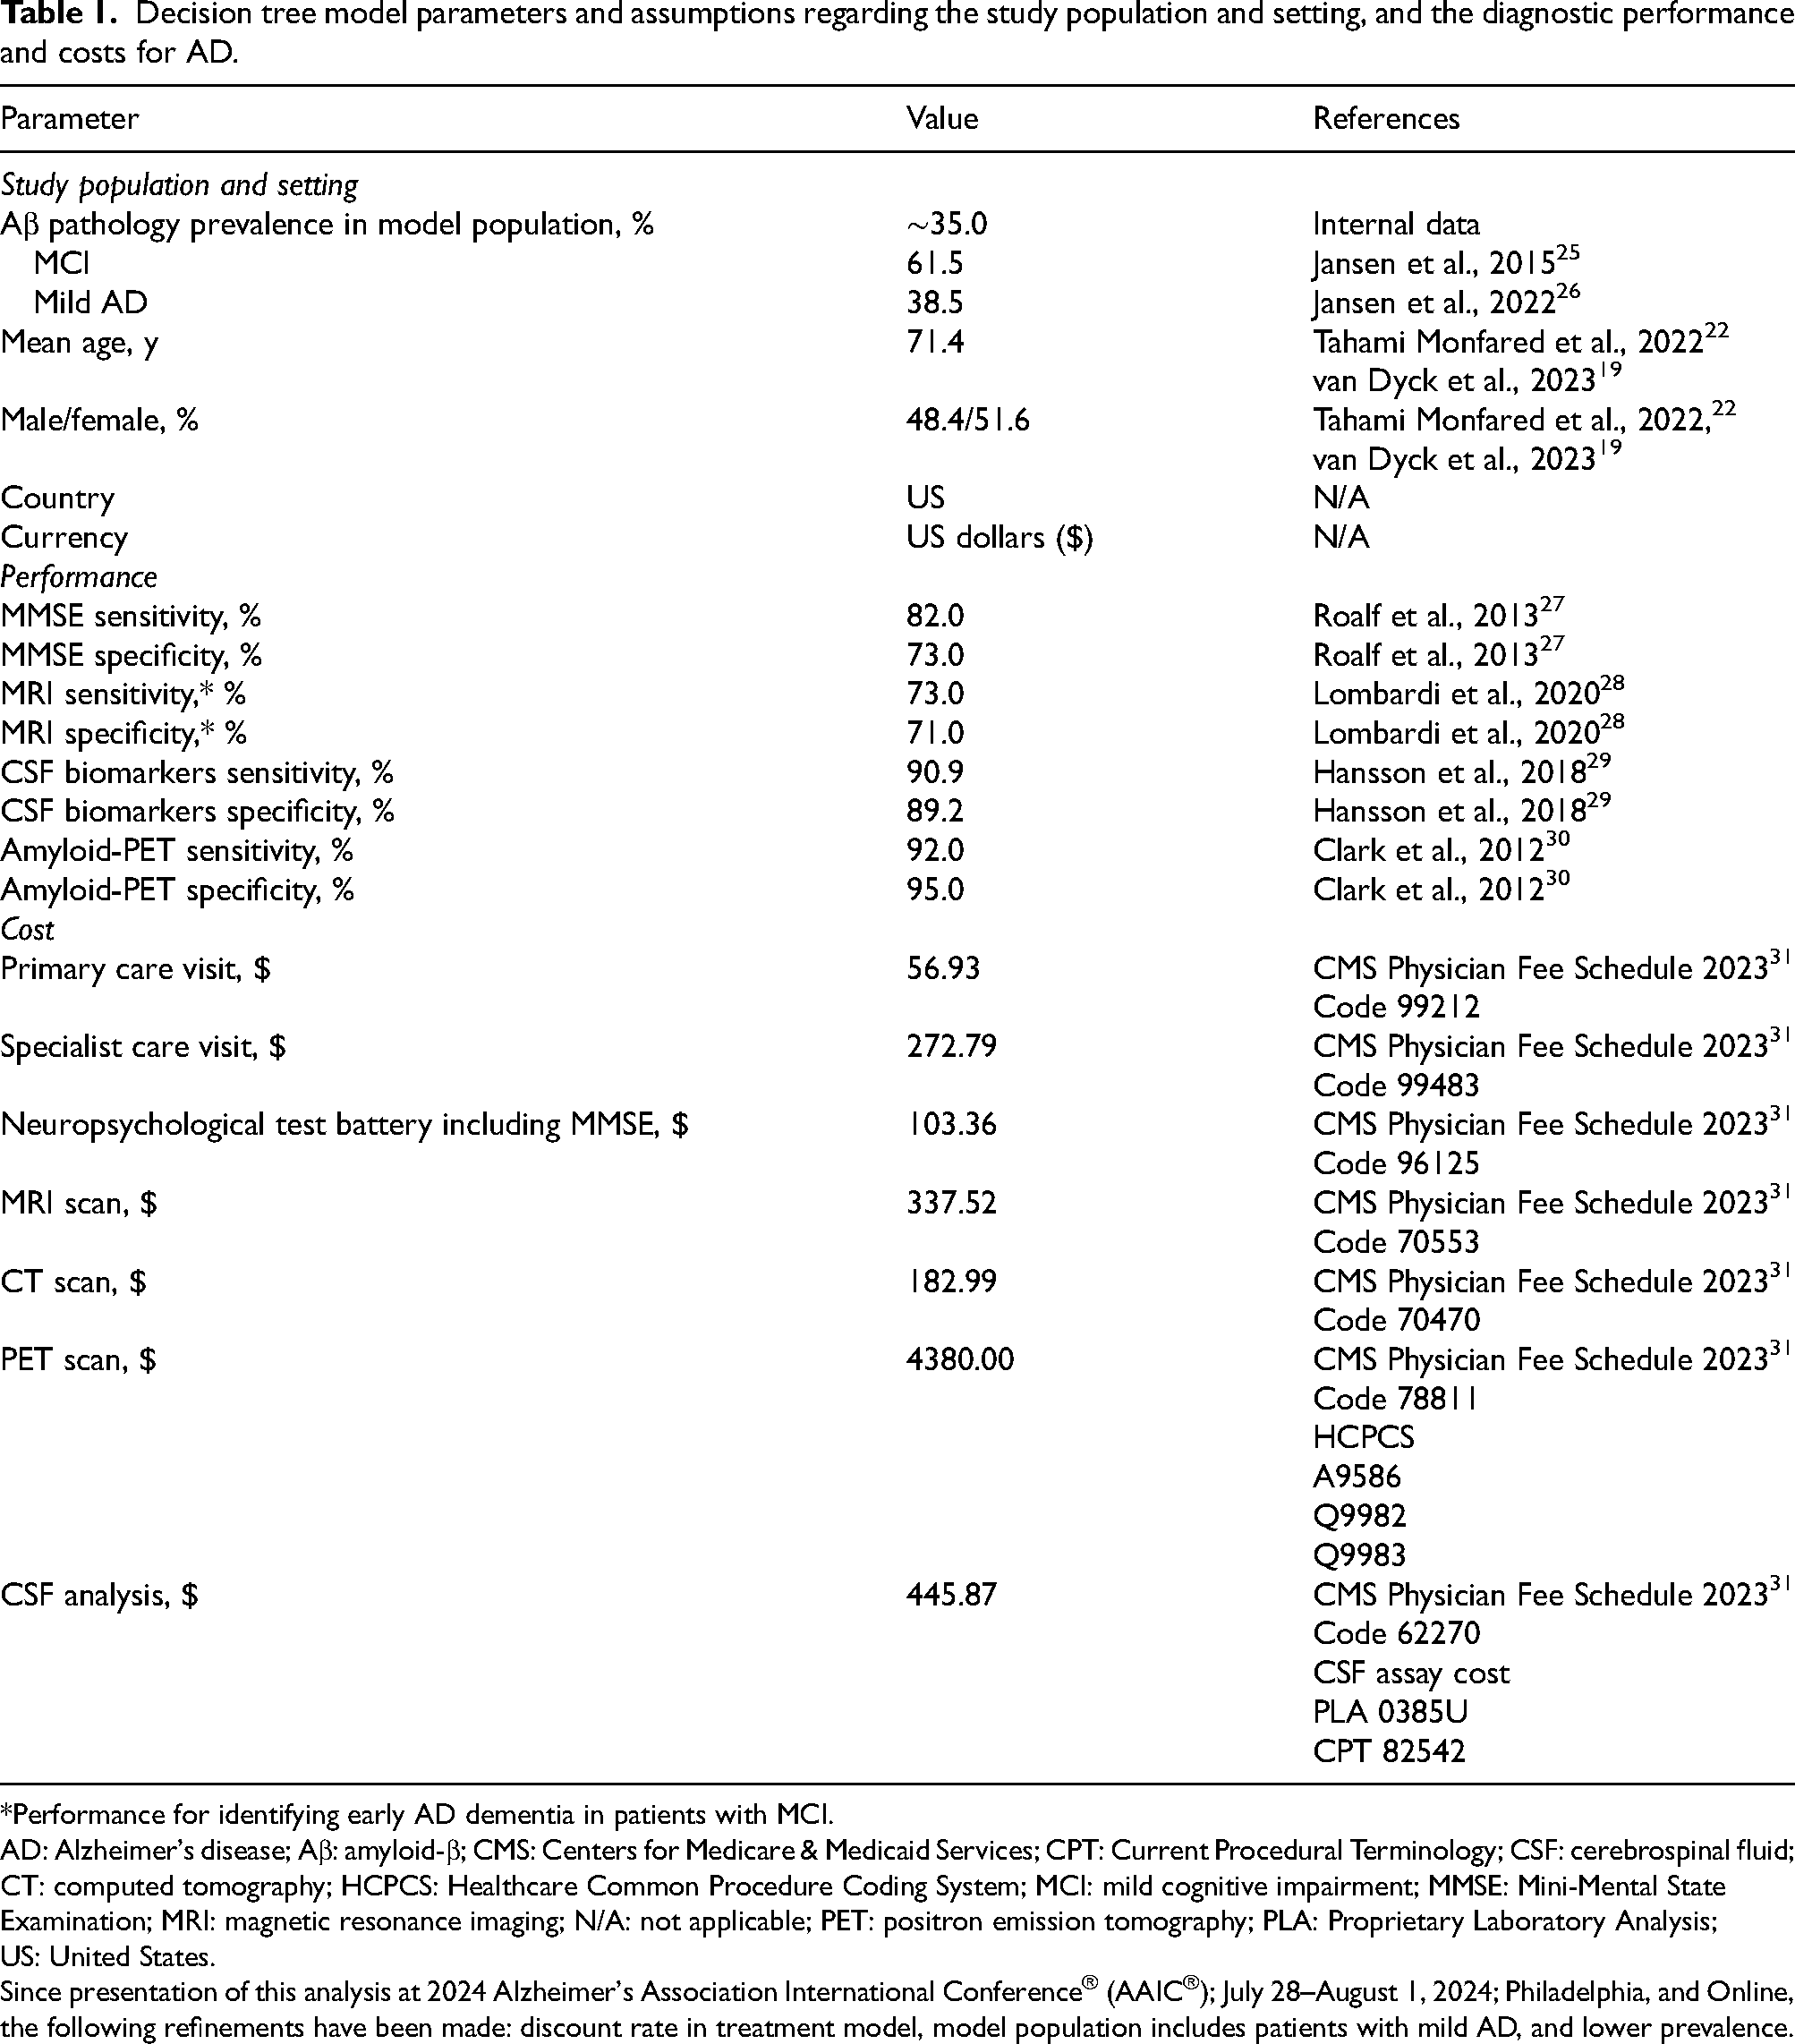
*Performance for identifying early AD dementia in patients with MCI.
AD: Alzheimer's disease; Aβ: amyloid-β; CMS: Centers for Medicare & Medicaid Services; CPT: Current Procedural Terminology; CSF: cerebrospinal fluid; CT: computed tomography; HCPCS: Healthcare Common Procedure Coding System; MCI: mild cognitive impairment; MMSE: Mini-Mental State Examination; MRI: magnetic resonance imaging; N/A: not applicable; PET: positron emission tomography; PLA: Proprietary Laboratory Analysis; US: United States.
Since presentation of this analysis at 2024 Alzheimer's Association International Conference® (AAIC®); July 28–August 1, 2024; Philadelphia, and Online, the following refinements have been made: discount rate in treatment model, model population includes patients with mild AD, and lower prevalence.
Simulated decision tree
A population-based decision tree model simulated the diagnostic pathway for patients presenting with symptoms of MCI or mild dementia in both primary and secondary care settings (Figure 1). The decision tree model parameters are listed in Table 1; parameters were identified through targeted literature searches, ensuring the utilization of robust and relevant assumptions regarding the study population and setting, and the diagnostic performance and costs for AD. Data inputs for the current utilization of various diagnostic tests, including CSF, PET, magnetic resonance imaging (MRI), and computed tomography (CT), were derived from an analysis of Medicare data 14 ; namely, CMS Research Identifiable Files in the Fee-For-Service program (2013−2020) using the Current Procedural Terminology/Healthcare Common Procedure Coding System codes.
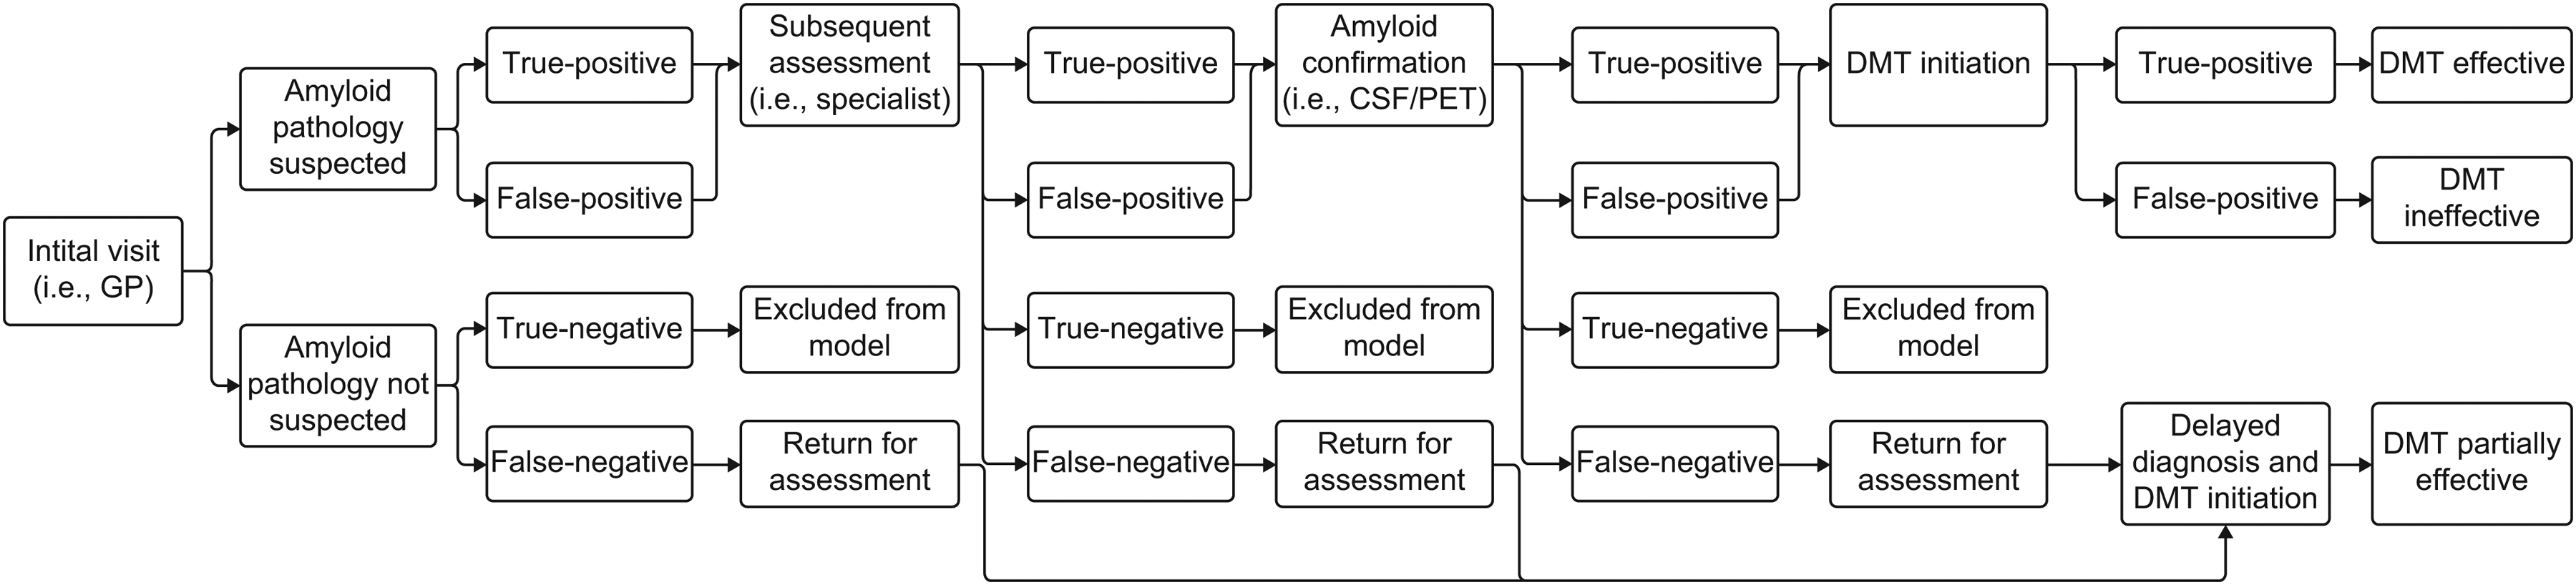
The decision tree model. CSF: cerebrospinal fluid; DMT: disease-modifying therapy; GP: general practitioner; PET: positron emission tomography.
The model delineated a diagnostic and treatment pathway encompassing: (i) initial assessment; (ii) specialist visit; (iii) confirmation; and (iv) treatment assumption (Figure 2), allowing patients to be ruled out for AD and evaluated for other potential causes of their symptoms at any stage. Initial assessment was assumed to be conducted by non-specialists in the primary care setting utilizing cognitive screening tools such as Mini-Mental State Examination and/or Montreal Cognitive Assessment, leading to patient referral to specialists based on clinical findings. The specialist assessment was assumed to comprise neuropsychological tests, in addition to laboratory tests and structural imaging (such as MRI and CT), excluding alternative causes for cognitive impairments and thereby informing decisions on the need for confirmatory testing. 32 It was then assumed that those who were not excluded (i.e., excluded individuals were true-negative for AD) underwent subsequent assessment, including the confirmatory testing of Aβ pathology via amyloid-PET and CSF analysis, for AD diagnosis. It was assumed that 90% of patients identified as positive (both true-positive or false-positive) for AD were referred from the initial assessment to a specialist, 90% of patients identified as false-negative for AD experienced a delayed diagnosis, and 90% of patients with biomarker-confirmed Aβ pathology received treatment.
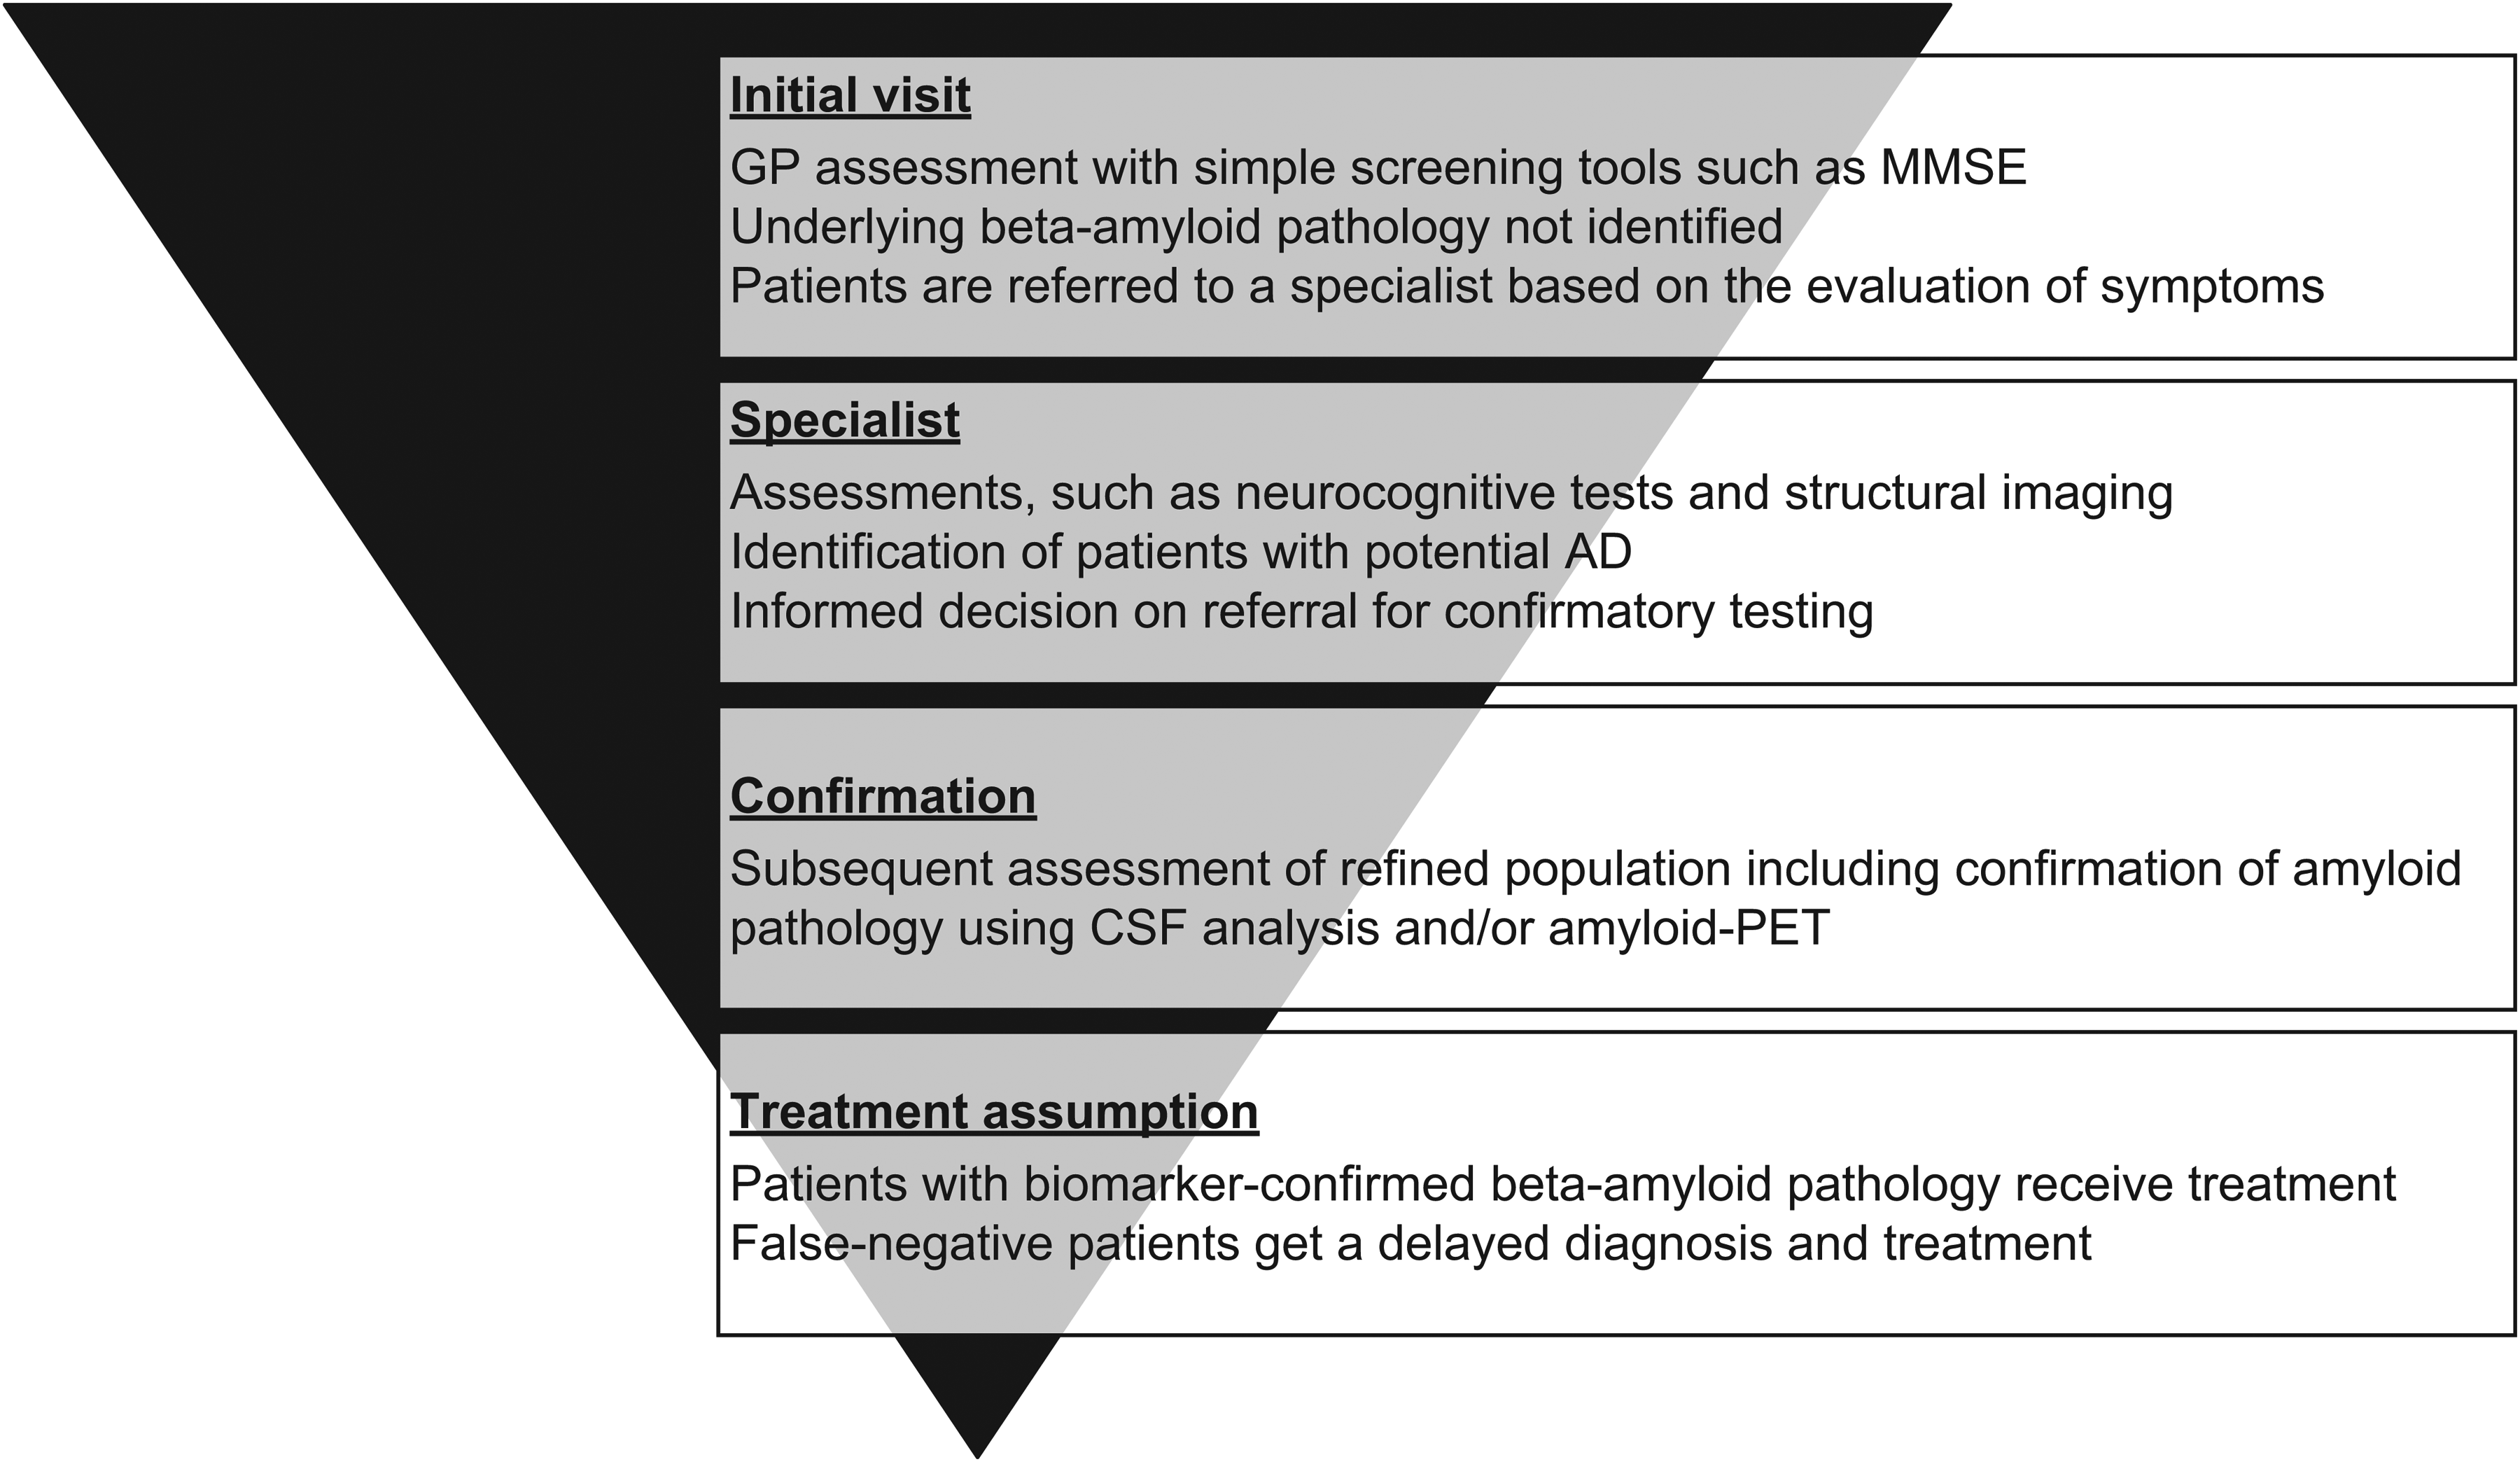
The AD diagnostic pathway. AD: Alzheimer's disease; CSF: cerebrospinal fluid; GP: general practitioner; MMSE: Mini-Mental State Examination; PET: positron emission tomography.
The number of patients waiting for referral to specialist visits, CSF analysis, and amyloid-PET was assumed to be influenced by the number who were eligible for confirmatory testing or specialist referral, and once the capacity for confirmatory testing or specialist referral is reached, resource blockage occurs. Assumed sensitivities and specificities for AD assessments are listed in Table 1. Additional model assumptions are detailed in the Supplemental Methods.
Budget impact and constraints
A budget impact model was created to assess the adoption of amyloid-PET and CSF analysis within the AD diagnostic pathway, focusing solely on direct costs and excluding any expenses related to training (i.e., lumbar puncture [LP] procedure training). This model compared the total diagnostic and treatment costs associated with the utilization of amyloid-PET and CSF analysis. Additionally, a capacity model was developed to identify constraints within the AD diagnostic pathway, considering the number of primary and specialist care visits, MRI, CT, PET scanners, and LP procedures. CSF analysis constraints were assumed to be due to the lack of LP procedures taking place, rather than laboratory capacity for CSF analysis and the number of physicians capable of performing LP procedures. It was further assumed that demand for CSF analysis for confirmation of AD would increase substantially in subsequent years, driven by the requirement for confirmed Aβ pathology for DMT eligibility. Constraints for PET scans include the number of instruments available, with an estimated 2371 scanners available in the US. 13 Approximately 5% of available PET scanners are utilized per year for AD diagnosis, with an estimated annual increase of PET scan volume of approximately 7%. 16 Capacity assumptions are detailed in Supplemental Table 1.
Costs were estimated from published literature and US reimbursement codes, particularly the CMS Physician Fee Schedule (Table 1). 31 Treatment costs and treatment-related indirect expenses were obtained from published literature.22,33 In the budget impact model, only direct costs were deemed relevant for payers, with no consideration for indirect costs. All costs utilized in the analysis were based on 2023 values from the CMS Physician Fee Schedule 31 and were not adjusted for inflation.
Model validation
Quality control was conducted to ensure model functionality, which involved a series of tests including but not limited to: setting costs and frequencies of diagnostic tests to 0; assessing extreme values (0%, 100%) of the diagnostic accuracy (sensitivity, specificity); testing referral rates; and increases/decreases in sensitivity and specificity, with estimated results compared with expected outcomes. Furthermore, the availability of resources such as physicians in primary and specialist care, and imaging machines was also rigorously tested. Moreover, to uphold the quality and integrity of the model, an independent researcher, who was experienced in economic modeling, conducted a comprehensive quality control assessment.
Scenario analysis
Four scenarios were employed to assess the potential impact of different amyloid-PET and CSF analysis utilization patterns on the AD diagnostic pathway, assuming an annual care-seeking rate of 50% for patients with symptoms of MCI and mild dementia. Results across all scenarios were reported for the population seeking care:
Results
Reference scenario (scenario 1)
The reference scenario (scenario 1) results indicated that the current utilization of amyloid-PET and CSF analysis failed to meet the growing demand for AD confirmatory testing, assuming an annual care-seeking rate of 50% for patients with symptoms of MCI or mild dementia. The number of patients seeking care per year is detailed in Supplemental Table 2. Approximately 0.3% of all Aβ-positive patients seeking care would receive a timely and accurate diagnosis of AD within a 5-year timeframe with the current utilization of amyloid-PET, and 1.7% with the current utilization of CSF analysis (Figure 3A); percentages are calculated from the number of patients with a timely and accurate diagnosis divided by the number of all patients seeking care. When the proportion of Aβ-positive patients receiving a delayed diagnosis are encompassed, approximately 5.5% and 14.3% of all Aβ-positive patients seeking care would receive an accurate diagnosis of AD after 5 years with the current utilization of amyloid-PET and CSF analysis, respectively (Supplemental Figure 1). Approximately 3.9 million Aβ-positive patients would not receive AD confirmatory testing after 5 years (Supplemental Figure 2). In year 5, the current utilization of amyloid-PET and CSF analysis would accurately identify 15,784 Aβ-negative patients (Figure 3B). Across the 5-year time period, approximately 1.2 million Aβ-negative patients would be inaccurately identified as positive (false-positive) with the current utilization of amyloid-PET and CSF analysis (Figure 3C), while approximately 2.1 million Aβ-positive patients would be inaccurately identified as negative (false-negative; Figure 3D).
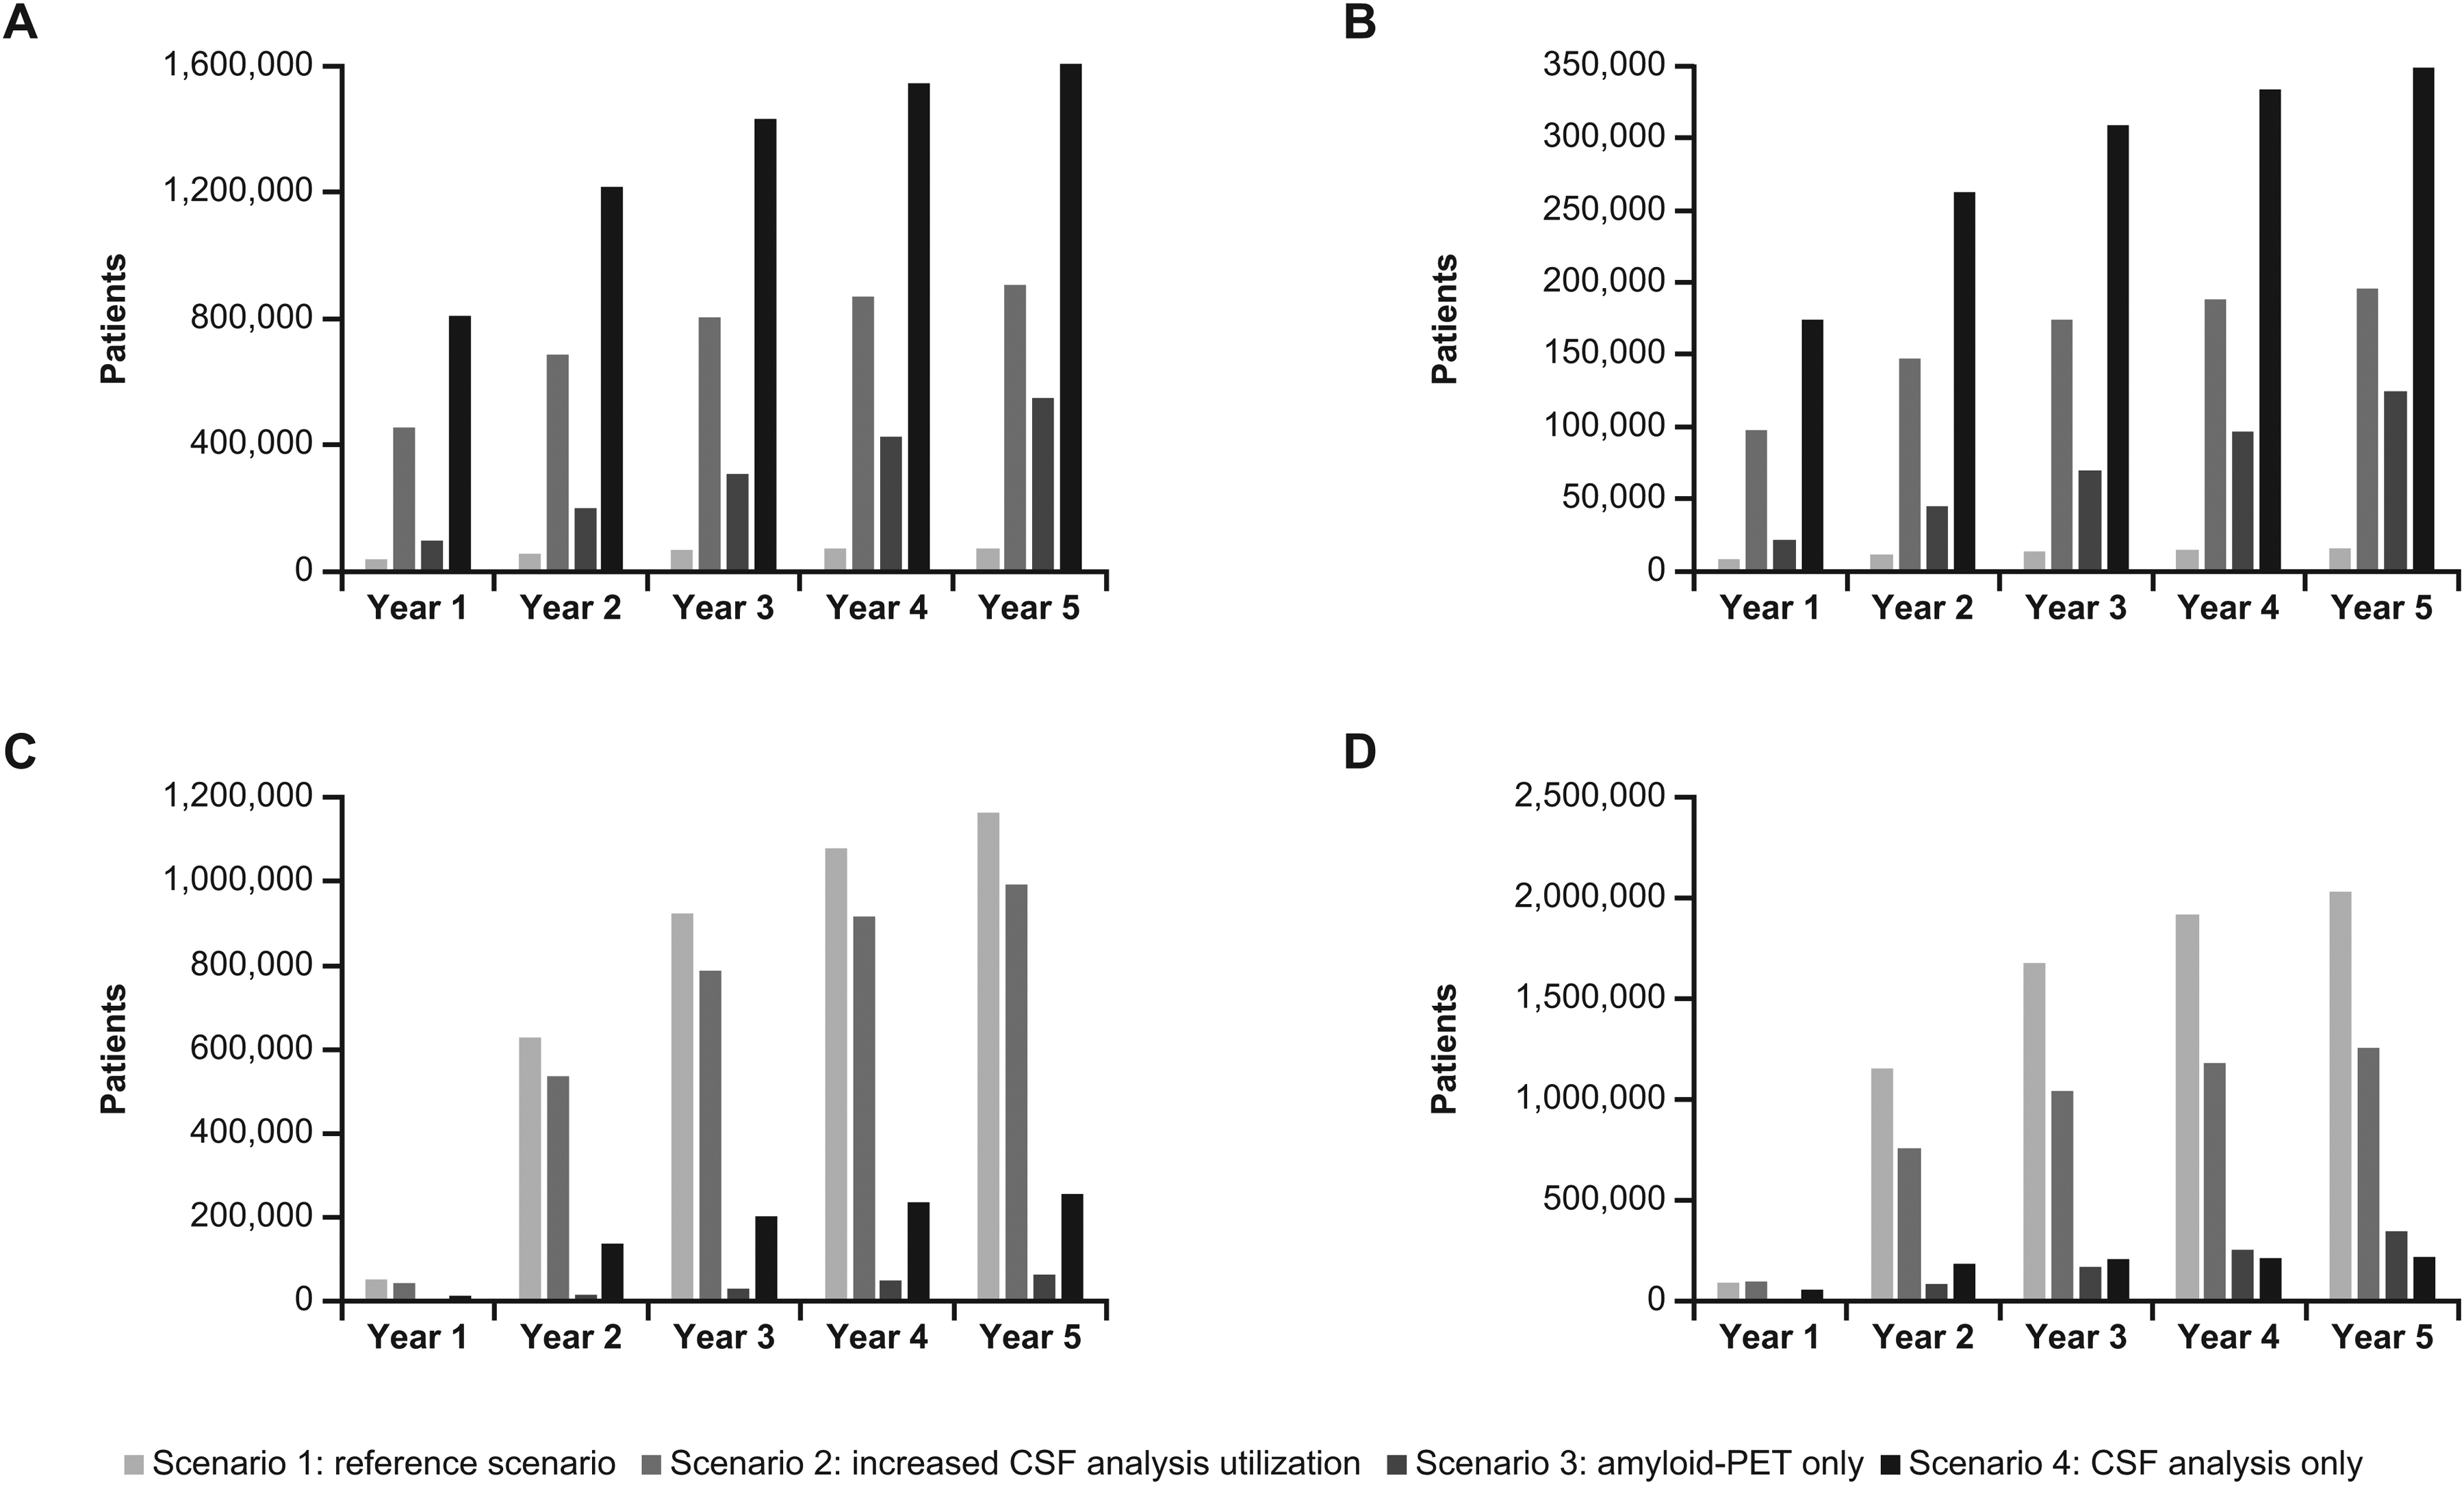
(A) Number of Aβ-positive patients with a timely and accurate diagnosis (true-positives). (B) Number of Aβ-negative patients with an accurate diagnosis (true-negatives). (C) Number of Aβ-negative patients with an inaccurate diagnosis (false-positives). (D) Number of Aβ-positive patients with an inaccurate diagnosis (false-negatives). CSF: cerebrospinal fluid; PET: positron emission tomography.
The annual excess demand for amyloid-PET exceeds the current capacity by approximately 44 times in year 1 (data not shown) and is almost resolvable after 5 years (Figure 4). The same pattern is seen with annual excess demand for CSF analysis (Supplemental Figure 3), which also exceeds the current capacity by approximately 14 times in year 1 (data not shown) and is only resolvable after 5 years. An annual excess demand for specialist care visits of approximately 1.1 million patients was observed for year 1 (Supplemental Figure 4).
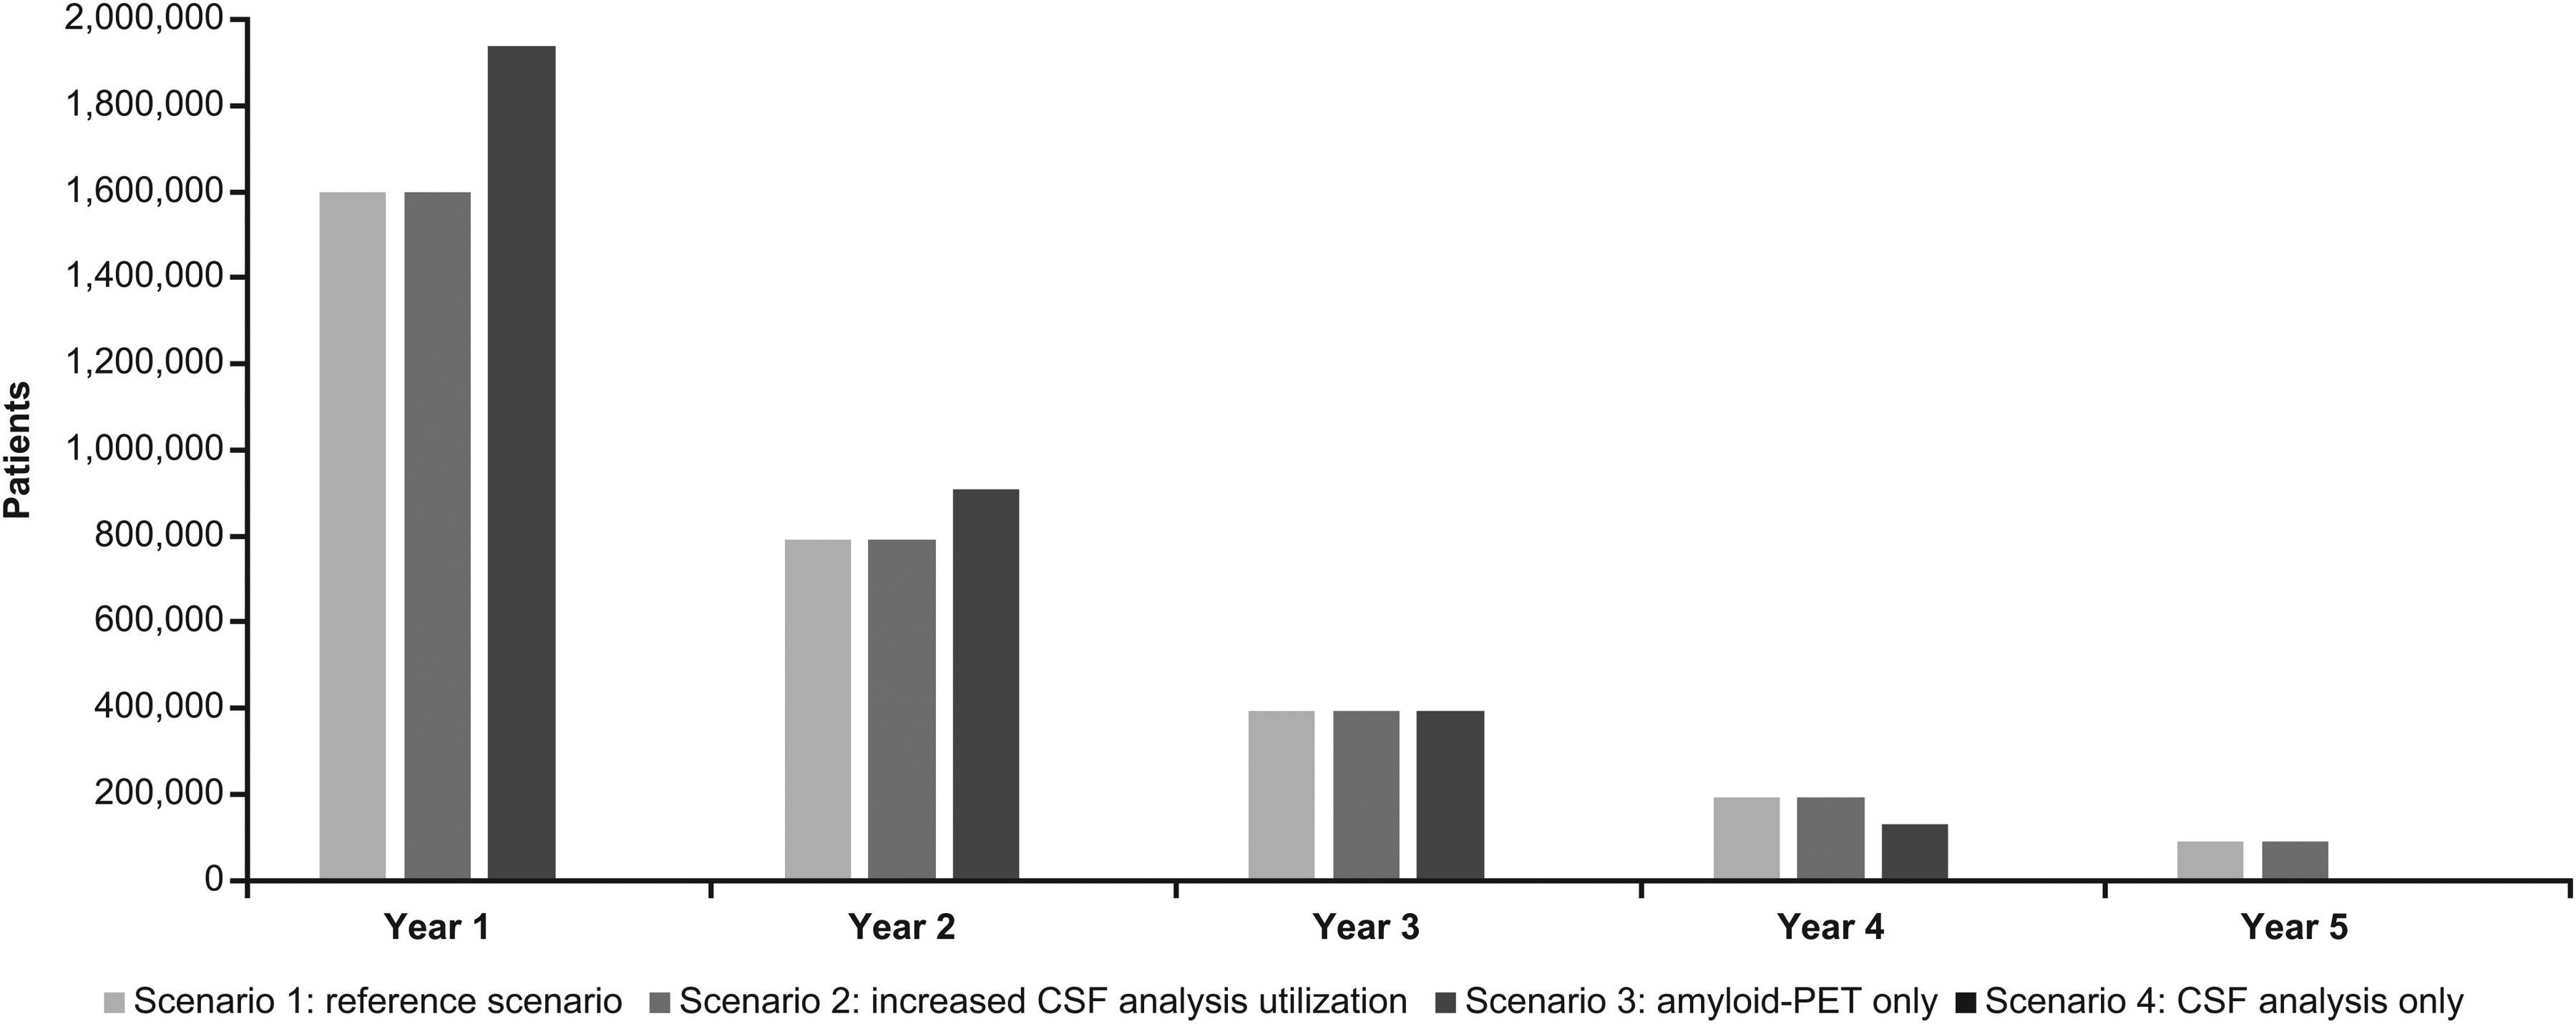
Excess demand for amyloid-PET (absolute).* *Missing bars indicate no excess demand. CSF: cerebrospinal fluid; PET: positron emission tomography.
After the 5-year time period, the total diagnostic and treatment costs in millions of the current utilization of amyloid-PET were $231 and $634, respectively, and $200 and $1488 with the current utilization of CSF analysis (Table 2). Costs per patient diagnosed were lower with the current utilization of CSF analysis ($1822) compared with amyloid-PET ($4928) after the 5-year time period (Table 2). The total budget impact of the reference scenario, considering both the diagnostic and treatment pathway costs, is detailed in the Supplemental Results (Supplemental Figures 5–7).
Diagnostic and treatment cost outcomes in patients seeking care after the 5-year time period.
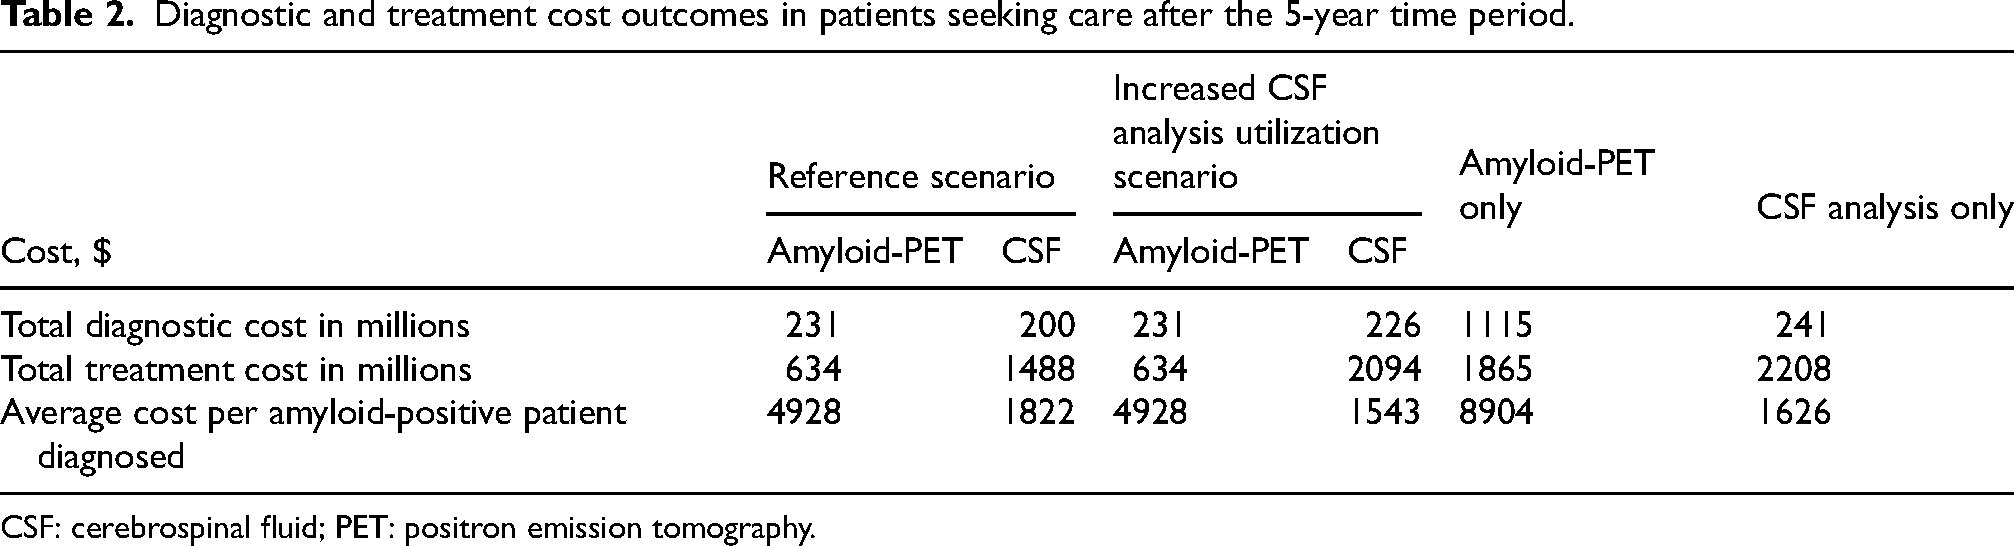
CSF: cerebrospinal fluid; PET: positron emission tomography.
Increased CSF analysis utilization scenario (scenario 2)
The increased CSF analysis utilization scenario (scenario 2; 50% utilization) results indicated that timely and accurate diagnosis is anticipated in up to 24.8% of Aβ-positive patients within a 5-year timeframe (Figure 3A). Encompassing those receiving a delayed diagnosis, approximately 86.9% of all Aβ-positive patients seeking care would receive a correct diagnosis of AD after 5 years with increased CSF analysis, compared with 5.5% with amyloid-PET (Supplemental Figure 1). Approximately 2.2 million Aβ-positive patients would not receive AD confirmatory testing after 5 years (Supplemental Figure 2). In year 5, increased CSF analysis utilization would accurately identify 195,944 Aβ-negative patients (Figure 3B). Across the 5-year time period, approximately 1 million Aβ-negative patients would be inaccurately identified as positive (false-positive) with the increased utilization of CSF analysis (Figure 3C), while approximately 1.3 million Aβ-positive patients would be inaccurately identified as negative (false-negative; Figure 3D).
After the 5-year time period, the total diagnostic and treatment costs in millions with the increased utilization of CSF analysis were $226 and $2094, respectively; costs per patient diagnosed with increased CSF analysis utilization were $1543 (Table 2). The costs for amyloid-PET were the same as in the reference scenario (scenario 1). The total budget impact of the increased CSF utilization scenario, considering both the diagnostic and treatment pathway costs, is detailed in the Supplemental Results (Supplemental Figures 5–7).
Amyloid-PET only and CSF analysis only scenarios (scenarios 3 and 4)
Approximately 15.1% and 44.6% of Aβ-positive patients would receive a timely and accurate diagnosis of AD with sole utilization of amyloid-PET (scenario 3) and CSF analysis (scenario 4), respectively, within a 5-year time period (Figure 3A). Approximately 15.1% of Aβ-positive patients would receive a correct diagnosis of AD, encompassing those receiving a delayed diagnosis, with sole amyloid-PET utilization after 5 years, compared with 90.5% with sole CSF analysis utilization (Supplemental Figure 1). Approximately 170,000 and 50,000 Aβ-positive patients would not receive AD confirmatory testing with sole amyloid-PET and CSF analysis utilization, respectively (Supplemental Figure 2). In year 5, sole CSF analysis utilization would allow approximately three times as many Aβ-negative patients (348,321 patients) to be accurately identified compared with amyloid-PET only (124,615 patients; Figure 3B), subsequently allowing resource to be redistributed to new and waiting patients. Across the 5-year time period, approximately 80,000 and 260,000 Aβ-negative patients would be inaccurately identified as positive (false-positive) with sole amyloid PET and sole CSF analysis utilization, respectively (Figure 3C), while approximately 430,000 and 225,000 Aβ-positive patients would be inaccurately identified as negative (false-negative; Figure 3D).
With sole amyloid-PET utilization, the annual excess demand for amyloid-PET exceeds the current capacity by approximately 14 times in year 1 (data not shown) and is only resolvable after 5 years (Figure 4), while an annual excess demand for specialist care visits of 280,852 patients was observed (Supplemental Figure 4). Similarly, with sole CSF analysis utilization, an annual excess demand for specialist care visits of 298,430 patients was observed in year 1 (Supplemental Figure 4).
After the 5-year time period, the total diagnostic and treatment costs in millions with sole utilization of amyloid-PET were $1115 and $1865, respectively, and $241 and $2208, respectively, for sole utilization of CSF analysis (Table 2). Costs per patient diagnosed after the 5-year time period with sole utilization of amyloid-PET were $8904 per case and $1626 per case for sole utilization of CSF analysis (Table 2). The total budget impact of the amyloid-PET and CSF analysis only scenarios, considering both the diagnostic and treatment pathway costs, is detailed in the Supplemental Results (Supplemental Figure 5–7).
Diagnostic outcomes across all scenarios
The increased CSF analysis utilization (scenario 2) and sole CSF analysis utilization (scenario 4) scenarios resulted in the highest anticipated number of Aβ-positive patients receiving a timely and accurate diagnosis, reaching approximately 800,000 patients in year 1 and 1.6 million by year 5 in the CSF analysis only scenario (Figure 3A). The number of Aβ-positive patients receiving a timely and accurate diagnosis in the sole amyloid-PET utilization scenario (scenario 3) increased year on year; however, the number of patients did not match those seen with the increased CSF analysis utilization (scenario 2) or sole CSF analysis utilization (scenario 4) scenarios (Figure 3A). A similar pattern across all four scenarios was observed for the number of Aβ-negative patients receiving an accurate diagnosis, encompassing those receiving a delayed diagnosis (i.e., false-negative individuals): a higher number of patients would receive an accurate diagnosis with increased CSF analysis utilization (scenario 2) and CSF analysis only (scenario 4) compared with the current utilization of amyloid-PET and CSF analysis (scenario 1) and amyloid-PET only (scenario 3; Figure 3B). In year 5, increased CSF analysis utilization (scenario 2) allowed approximately 12 times as many Aβ-negative patients to be accurately identified compared with the current utilization of amyloid-PET and CSF analysis (scenario 1; Figure 3B) and sole CSF analysis utilization allowed the accurate identification of approximately 22 times as many Aβ-negative patients compared with current utilization (scenario 1).
The number of Aβ-positive patients without referral or with inaccurate diagnosis (false-negative) was anticipated to be the highest in the reference scenario (scenario 1), reaching close to 3.2 million at year 2 and plateauing at approximately 5.7 million by year 5. The number of Aβ-positive patients without referral or with inaccurate diagnosis (false-negative) was second highest in the increased CSF analysis utilization scenario (scenario 2), in which the number of patients reached approximately 1.9 million at year 2 and plateaued at approximately 3.2 million by year 5 (data not shown). Approximately two-thirds of these were Aβ-positive patients without a referral (Supplemental Figure 2) and approximately one-third were patients with an inaccurate diagnosis (false-negative; Figure 3A). In the sole amyloid-PET and CSF analysis utilization scenarios, the number of Aβ-positive patients without a referral remained low after 5 years (167,000 patients in year 5 for amyloid-PET only; 50,000 patients in year 5 for CSF analysis only; Supplemental Figure 2). In the sole CSF analysis utilization scenario, the number of Aβ-positive patients with an inaccurate diagnosis (false-negative) reached approximately 183,000 after year 1, but then stabilized and reached 220,000 in year 5; in contrast, the number of Aβ-positive patients with an inaccurate diagnosis (false-negative) in the sole amyloid-PET utilization scenario increased steadily year-on-year, to approximately 430,000 at the end of the 5-year time period (Figure 3D). This contrast is presumably due to the higher specificity of amyloid-PET versus CSF analysis.
Similarly, the number of Aβ-negative patients with an inaccurate diagnosis (false-positives) was also anticipated to be the highest in the reference scenario (scenario 1; approximately 1.2 million patients by year 5), followed by the increased CSF analysis utilization scenario (scenario 2; approximately 1 million patients by year 5), with the highest proportion of false-positive diagnoses happening in the first year before the rate slows down (Figure 3C). In year 5, approximately 264,000 false-positive diagnoses occurred in the sole CSF analysis utilization scenario (scenario 4) and the sole amyloid-PET utilization only (scenario 3) saw the fewest false-positive diagnoses, at approximately 81,000.
Resource constraints across all scenarios
Across the 5-year time period, the excess demand for amyloid-PET was anticipated to be highest in the amyloid-PET only scenario (scenario 3; 1.9 million patients in year 1), as expected, followed by the current utilization (scenario 1) and the increased CSF analysis utilization (scenario 2) scenarios, in which amyloid-PET utilization was consistent with the current utilization scenario (scenario 1; 1.5 million patients in year 1; Figure 4). The excess demand for amyloid-PET halved in year 2 and continued to decrease, with approximately 90,000 patients remaining in the current utilization (scenario 1) and increased CSF analysis utilization (scenario 2) scenarios and with no excess demand remaining in the amyloid-PET only scenario (scenario 3) by year 5.
In the current utilization scenario (scenario 1), excess demand for CSF analysis was anticipated to decrease over the 5-year time period from 1.5 million to 27,000 patients. In the other scenarios, no excess demand was observed for CSF analysis (Supplemental Figure 3). Excess care demand for specialist care visits in year 1 was anticipated to be the highest in the current utilization scenario (scenario 1) at 1.1 million patients, followed by the increased CSF analysis utilization scenario (scenario 2) at 990,000 (Supplemental Figure 4). The excess demand was much lower for the CSF analysis only (scenario 4; 300,000 patients) and amyloid-PET only (scenario 3; 280,000 patients) scenarios; excess demand was observed in year 1 but resolved from year 2 onwards.
Costs per patient diagnosed were lowest with increased CSF analysis utilization ($1543) compared with other scenarios after the 5-year time period (Table 2). The total budget impact across all scenarios, considering both the diagnostic and treatment pathway costs, is detailed in the Supplemental Results (Supplemental Figures 5–7).
Discussion
In this study, we assessed the current utilization of amyloid-PET and CSF analysis within the AD diagnostic pathway and modeled the future budget impact, resource capacity, and patient diagnostic outcomes if the current utilization pattern were to continue over a 5-year time period. Additionally, we investigated three further diverse utilization scenarios: increased utilization of CSF analysis with amyloid-PET utilization remaining consistent, amyloid-PET utilization only, and CSF analysis utilization analysis only.
The reference scenario (scenario 1) does not meet the growing demand for confirmatory AD testing due to capacity challenges, and the limited number of specialists, LP procedures, and PET scanners for amyloid confirmation. 12 Approximately 0.3% of patients receive an accurate and timely diagnosis over 5 years with current amyloid-PET utilization versus 1.7% with current CSF analysis utilization. Increased (scenario 2) or sole utilization (scenario 4) of CSF analysis was predicted to lead to the highest proportion of accurate and timely diagnoses for Aβ-positive patients (24.8% and 44.6%, respectively); however, these scenarios also resulted in the highest proportion of patients with a misdiagnosis, possibly due to a far greater number of confirmatory tests being carried out, and difference in performance between CSF and PET. Diagnostic costs were highest in the first year with increased CSF analysis utilization (scenario 2) and current CSF analysis utilization (scenario 1), but dropped below those for the amyloid-PET only scenario (scenario 3) as the bottleneck of patients waiting for confirmatory testing was alleviated. The initially higher costs with CSF analysis were due to the greater number of confirmatory tests being performed; cost per patient diagnosed was consistently lower with CSF analysis versus amyloid-PET, as expected. The cost of the treatment pathway was similarly higher for the increased CSF analysis utilization (scenario 2) and CSF analysis only (scenario 4) scenarios compared with current utilization (scenario 1) and amyloid-PET only (scenario 3) scenarios, owing to the greater number of patients being diagnosed and therefore treated. To achieve maximal capacity, both confirmatory testing methods (amyloid-PET and CSF analysis) are essential.
This study adds to a growing body of evidence indicating that, at present, global healthcare systems are not fully equipped to meet the diagnostic demand required to deliver DMTs to the entire population of patients with AD who may be eligible and stand to benefit from such treatments.11,12,34–37 Modeling studies predicting healthcare gaps and resource constraints across countries and regions (such as Asia, South America, Europe, and other studies in the US) agree that AD specialist time, the number of PET scanners, and time on PET scanners allocated to AD are obstacles for AD diagnosis.11,12,34,35,37,38 All of these previous studies argue that these constraints need to be addressed or circumvented in order to deliver DMTs to people with early stages of symptomatic AD in a timely fashion. Notably, the number of physicians in the US per capita (2.3 per 1000 individuals) is below the Organization for Economic Co-operation and Development average (3.4 per 1000 individuals), 39 and the number of specialists in the US per 100,000 individuals is 8.82 compared with 11.82 for the G7 countries (excluding the United Kingdom), 35 which may impact the response to the anticipated rise in demand for AD assessment following the approval of DMTs.
Delayed or missed AD diagnosis is known to result in poor patient outcomes.40,41 While amyloid-PET has the advantage of visualizing the location of Aβ pathology in the brain and is viewed as a less invasive method compared with CSF analysis, it is important to acknowledge the limited accessibility and scalability of PET scanners, which restrict the expediency of diagnosis. A number of recent studies have demonstrated strong concordance of CSF biomarker ratios with amyloid-PET (∼90%),42–45 increasing confidence in the capability of CSF analysis as a reliable alternative to amyloid-PET. Clinical sensitivity and specificity, and particularly the predictive values (which can be impacted by AD prevalence), are key components of performance. 46 Variation in performance can have significant consequences for clinical care, as more substantial follow-up is anticipated for a test with a high rate of false-positive results. 46
Cost considerations of the AD diagnostic pathway are vital when considering the different testing options available to meet the anticipated rise in demand for AD assessment. PET imaging, including amyloid-PET, is associated with substantially higher costs in comparison with CSF testing. 9 In this study, the budget impact of the current and sole utilization of amyloid-PET and CSF analysis exposed notable differences in costs for the diagnostic pathway. The costs for CSF analysis were higher in the first and second year but decreased below amyloid-PET costs over time. This cost variation is attributed to factors such as the number of patients tested and the accrual of higher initial costs with CSF analysis at the outset (such as costs of laboratory infrastructure, equipment specialized training in CSF test validation, and LP), as well as the increased costs associated with delays in diagnosing patients via amyloid-PET due to lower scanner capacity compared with CSF analysis. However, CSF analysis is more accessible and more easily scalable than PET scanning. The lower costs of scaling up CSF analysis compared with amyloid-PET may make it a more justifiable and accessible option for broader implementation, while also accounting for pivotal factors such as diagnostic accuracy and cost-effectiveness. However, it is noteworthy that the costs of treating AD are the primary driver of the overall cost rather than costs of diagnosing AD (i.e., diagnostic tests and clinical assessments/visits). 9 The invasiveness of CSF analysis hinders expansion of the method 47 ; thus, future solutions such as blood-based biomarkers may have an advantage as they are cheaper and minimally invasive.
The potential benefits to patients, caregivers, and society of timely AD diagnosis and subsequent treatment with a DMT consist of preserving patients’ cognition for longer and therefore substantial savings in the quality of life and cost of care. 48 Therefore, addressing capacity issues and optimizing the diagnostic pathway are critical. Potential solutions include increasing the utilization of CSF analysis, expanding the PET imaging infrastructure, and embracing technological advancements.49–51 Recent advancements in blood-based biomarkers can address the anticipated surge in demand for confirmatory testing as they can be used as a triage tool and easily integrated into routine clinical practice, as a result of their minimally invasive nature, cost effectiveness, and scalability. 52 Additional advantages of blood-based biomarkers are their increased accessibility and that they are less resource-intensive compared with traditional imaging and CSF analysis methods, thus, posing a feasible option for widespread screening and early detection of AD. 52 Current limitations of amyloid-PET and CSF analysis preclude their use as first-line diagnostic devices; however, blood-based biomarkers can help bridge the gap by presenting as a practical initial triage tool. 53 Increasing awareness of the availability of CSF and future blood-based biomarker tests, providing education opportunities, ensuring sufficient resources, and investing in LP training programs can increase patient access to early symptomatic AD testing.49–51 Exploring innovative solutions (for example, triaging with blood-based biomarkers) to streamline the diagnostic pathway prior to confirmatory testing can reduce the costs associated with false-negatives and false-positives.49–51,54 Future solutions may also include other modes of diagnosis to bypass some of the restrictions of current practices. 23
Key strengths of the study that contribute to the robustness and reliability of its findings include the use of a population-based decision tree model, which allowed for thorough assessment of the current capacity for AD confirmatory testing (namely, amyloid-PET and CSF analysis), enhancing the relevance of the study to population-level healthcare planning. The evaluation of different scenarios comprising amyloid-PET and CSF analysis provided a comprehensive view of how various approaches can impact diagnostics and treatment rates. This study also recognized the anticipated future need for confirmatory testing due to the availability of DMTs and provided valuable insights for future healthcare resource allocation and management, to facilitate timely diagnosis and appropriate access to AD therapies. Moreover, the study findings align with the growing body of evidence indicating that availability of both amyloid-PET and CSF analysis is essential for achieving maximal diagnostic and treatment capacity. 35 Limitations of the current healthcare system and its capacity to provide AD confirmatory testing were addressed and improvements have been suggested, such as expanding the PET imaging infrastructure and embracing technological advancements.
Limitations of the study assumptions include concerns over the inputted data obtained from published literature and expert opinion, both of which can lead to uncertainty, particularly alongside the heterogeneity of AD diagnosis and lack of data in the field, which can potentially impact the validity of the findings. The assumptions made in the study, such as those related to population demographics, amyloid pathology prevalence, therapy referral, and healthcare utilization patterns, are pivotal for the conclusions drawn. However, it is important to recognize that this assumption may not fully capture the real-world cost implications. Additionally, the model was heterogeneous; the patient population was restricted by additional factors other than the test result in the diagnostic pathway, such as geographical location or patients avoiding a diagnosis due to fear of the outcome or denial.
Conclusion
The current utilization of amyloid-PET and CSF analysis (scenario 1) does not meet the growing demand for confirmatory AD testing due to capacity challenges. Increased or sole utilization of CSF analysis (scenarios 2 and 4, respectively) were predicted to lead to the highest proportion of accurate and timely diagnoses, for both amyloid-positive and amyloid-negative cases; however, these scenarios also resulted in the highest proportion of patients with a misdiagnosis. The cost of the treatment pathway was similarly higher for increased (scenario 2) and sole CSF analysis utilization (scenario 4) scenarios compared with the current utilization of amyloid-PET and CSF analysis (reference scenario; scenario 1) and amyloid-PET only (scenario 3), owing to the greater number of patients being diagnosed and therefore assumed to be treated.
In addition to the capacity of confirmatory diagnostics, there are other factors influencing DMT use including general practitioner assessment and subsequent referral to a specialist, specialist assessment and referral for confirmatory testing, 55 patients’ conditions/comorbidities (which increase the risk of side effects), 8 geographical access, and healthcare system capacity and readiness (e.g., availability of infusion centers and specialized expertise). 11 Moreover, if the capacity of confirmatory diagnostics increased, the number of patients with access to treatment may not directly increase as a result of these other factors, and also due to the heterogeneity of demand and supply. It is possible that the settings where the capacity of confirmatory diagnostics can be more easily expanded (i.e., academic medical centers) may not necessarily be the settings where the need for greater capacity is highest.12,34,35
With the advancement of DMTs, the demand for AD triage and confirmatory testing is predicted to substantially increase. It is imperative to address capacity issues for AD testing to facilitate timely diagnosis and the initiation of amyloid-targeting therapies, which are crucial for improved patient outcomes. The collaboration between academia, healthcare providers, industry stakeholders, and regulatory bodies is essential for the development of safe and effective tests, strategies, sharing of resources, and leveraging of expertise to effectively address capacity issues. By implementing CSF testing, it becomes feasible to meet the growing demand for AD testing and ensure timely access to appropriate management for AD patients. Blood-based biomarkers will also be instrumental in tackling increasing testing pressures and shaping the AD patient diagnostic and management pathways.
Future research could potentially compare the projected number of treated patients in the reference scenario (scenario 1) with observed real-world DMT utilization to validate the study model and its reflection of clinical practices; this would provide further evidence for the capacity constraints identified in this study and reinforce the urgency of addressing these issues to ensure more patients can access DMTs.
Supplemental Material
sj-docx-1-alz-10.1177_13872877251406909 - Supplemental material for The capacity for Alzheimer's disease confirmatory testing in the United States: The current situation and simulations for future increase
Supplemental material, sj-docx-1-alz-10.1177_13872877251406909 for The capacity for Alzheimer's disease confirmatory testing in the United States: The current situation and simulations for future increase by Sophie Roth, Jessie Yan, Maria-Magdalena Patru, Soeren Mattke, Anders Gustavsson and Gustaf Ortsater in Journal of Alzheimer's Disease
Footnotes
Acknowledgements
Third-party medical editing assistance, under the direction of authors, was provided by Sophie Lavelle, MSc, of Ashfield MedComms (Macclesfield, UK), an Inizio company, and was funded by Roche Diagnostics International Ltd (Rotkreuz, Switzerland). The authors would like to thank Brigitta Monz of Roche Diagnostics GmbH (Mannheim, Germany) for her contribution to writing and reviewing the manuscript.
Ethical considerations
Not applicable
Consent to participate
Not applicable
Consent for publication
Not applicable
Author contribution(s)
Funding
The authors disclosed receipt of the following financial support for the research, authorship, and/or publication of this article: This study was funded by Roche Diagnostics International Ltd (Rotkreuz, Switzerland).
Declaration of conflicting interests
The authors declared the following potential conflicts of interest with respect to the research, authorship, and/or publication of this article: SR is an employee of Roche Diagnostics International Ltd and shareholder of F. Hoffmann-La Roche Ltd JY and M-MP are employees of Roche Diagnostics and shareholders of F. Hoffmann-La Roche Ltd SM serves on the director board of Senscio Systems, Inc. and scientific advisory board of AiCure Technologies, AlzPath, and Boston Millenia Partners; he has also received consultancy and/or speaker fees from Biogen, C2N, Eisai, Eli Lilly, Novartis, Novo Nordisk, and Roche/Genentech. GO is an employee and stockholder of Quantify Research, providing consultancy services to pharmaceutical companies and other private and public organizations and institutions. AG is a partner of Quantify Research and indirectly owns shares in Mindmore AB.
Data availability statement
The data supporting the findings of this study are available on reasonable request from the corresponding author. The data are not publicly available due to privacy or ethical restrictions.
Supplemental material
Supplemental material for this article is available online.
References
Supplementary Material
Please find the following supplemental material available below.
For Open Access articles published under a Creative Commons License, all supplemental material carries the same license as the article it is associated with.
For non-Open Access articles published, all supplemental material carries a non-exclusive license, and permission requests for re-use of supplemental material or any part of supplemental material shall be sent directly to the copyright owner as specified in the copyright notice associated with the article.