
Abstract
Miniaturization of parts of devices is the driving force for fabrication of micro-features. In this study fabrication of protruded multi-shaped micro-feature array on AA 6063 is attempted by laser micromachining. For fabricating the protruded microfeatures, the process parameters such as laser power, scanning speed and frequency of the laser beam have been optimized by considering track depth, width, and surface roughness as the output parameters. Three different cross sections in the tracks such as pileup section, W-section, and Gaussian groove section are observed. It is found that shape of the tracks vary with the scanning speed for the same power and frequency of the laser beam. The tracks of pileup section, W-section, and Gaussian groove section were produced for a laser scanning speed of 100 mm/s, 200mm/s, and 300 mm/s, respectively. Further, a laser-thermal ablative model is developed for predicting the depth of the single track and simulated using COMSOL® Multiphysics. The predicted track depths obtained from the simulations have good agreement with experimental results. In order to produce the protruded microfeatures of different shapes, multiple track analysis is done by fabricating the single tracks adjacent to one another by overlapping them, and the overlapping distance is optimized. The protruded microfeatures are then fabricated by removing the surrounding material for different scanning strategies and it is found that the contour strategy produced the features with minimal form error. Finally, it is demonstrated that an array of protruded micro-features of polygon (square, hexagon), and circular cross sections can be fabricated using the optimized process parameters for various applications.
Introduction
The recent era has witnessed an accelerated march towards miniaturization. Miniaturization creates a need to manufacture the components in a relatively smaller scale without affecting their functionality. Microfabrication is mainly involved in fields of MEMS (Micro Electro Mechanical Systems), 1 microfluidic applications, 2 surface texturing, 3 micro-fins, 4 and so on. Surface texturing is the process of altering the surface by introducing special features that are meant to enhance a specified property of interest. Depending on the nature of the textures it is classified into two types namely negative textures (dimples) and positive textures (protrusions). 5 When the texturing is done in a way such that the textured surface lies below the plane of reference, then the features produced on the textured surface are known as negative textures while the converse is true for positive textures.
A Borghi et al. 6 fabricated continuous array of circular dimples in Nitriding Steel (30NiCrMo12) surface for high performance engine applications. The work involved the study of friction and wear at no lubrication, hydrodynamic lubrication, and mixed lubrication conditions on textured surface. The study reported that for loads greater than 3 N, the friction gets reduced by about 75%. Paik et al. 7 conducted an experimental study to determine the drag reduction on micro-dimpled surfaces fabricated with the help of ultrasonic nano-crystal surface modification. The authors reported that the micro-dimpled surfaces produced a better surface finish that resulted in drag reduction 3%–5% consistently with a maximum drag reduction of 5.68%. Roshan Sasi et al. 8 performed orthogonal dry machining study by fabricating dimples on the rake face with the help of laser surface texturing of a high speed steel cutting tool for machining of AA 7075 T6 aluminium alloy. The authors observed that the dimples on the rake face gets filled with machined material and acts as a solid lubricant. The deposited material also increases the effective rake angle at the chip section, reducing the cutting and thrust forces that help in improving the tool life. Gropper et al. 9 reported that the wear in the case of dimple textures is high as the worn-out debris get accumulated in the dimples causing further wear. This phenomenon is less seen in the case of protruded features as the mating surfaces are in contact with each other only on the top of the pillars or protrusions. It is evident from the above literature that negative textures have a lot of approved potential applications related to the enhancement of tribological performance of mating surfaces. Similarly, the protruded microfeatures also have many potential applications like heat transfer, 10 minimal radiation reflection, 11 radiative absorption, 12 wettability and tribology. 13 Protrusions can be fabricated through material addition methods like nano-casting, material deposition, 14 additive manufacturing, 5 laser implantation, 15 and so on. and material removal methods like laser micromachining, 16 chemical wet etching, 17 electro-chemical texturing,18–20 electric discharge machining, electron beam machining, 21 nano-imprinting, 22 and so on.
Dilip P. et al. 23 performed a parallel sliding wear test with positive deterministic surface textures fabricated by photo-chemical machining. The substrate material used was mild steel and over it textures of different height, size, and area density were fabricated and tested. At a protrusion height of 160μm and texture size of 2300μm the friction observed seemed to be very less. Ismail syed et al. 17 investigated the effect of positive textures on the friction between textured piston ring and liner system in an IC engine. Positive textures were fabricated through chemical wet etching and pin-on-disc wear test was performed with the pin specimen. It was reported that with protrusions having heights in the range of 20–100μm, friction considerably decreases while it increases with area density in the range of 0.1–0.5. Thus, positive texturing is a promising approach for the enhancement of tribological behavior in terms of increase or decrease in friction. Fabrication of dimples or craters are relatively easy process compared with protrusions but the applications of protrusions are comparatively more.
Fabricating protruded micro-features with accurate dimensions, form and for large surfaces is difficult by aforementioned processes. The laser micro-machining process is one of the prospective processes for producing protrusions with accurate dimension and form.
24
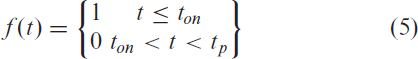
Therefore it is important to study the effect of process parameters to produce specified protruded micro features. Laser parameters such as laser power
Therefore, in this work, in order to produce protruded micro-features, first, the laser parameters are optimized for fabricating a single track. Next, the thermal ablation process encountered in laser micro-machining is numerically modeled and the track depth is predicted. Finally, the overlap between the tracks and scanning strategy is optimized for producing the array of microfeatures.
Experimental setup
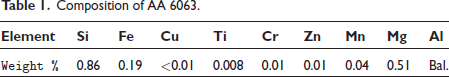
Aluminium alloy (AA 6063) is taken as cast cuboid blocks for fabrication of micro-features. Table 1 shows the composition of the alloy AA6063. These 6-xxx series alloys are mostly used in the fields of automobile, aerospace, marine and food processing industries.
24
The main reason for selecting these 6-xxx alloys is because of their good fatigue strength, high corrosion resistance, relatively high stiffness to weight ratio and good thermal properties.
24
The samples are polished with silicon carbide (SiC) abrasive sheets of grit size 80–1500 to achieve a smooth surface finish. The polishing is done with repeated strokes of to-and-fro movements for about 5 minutes with each abrasive sheet. The polished samples are then cleaned with the help of acetone to remove impurities and dried. The final average surface finish
Composition of AA 6063.
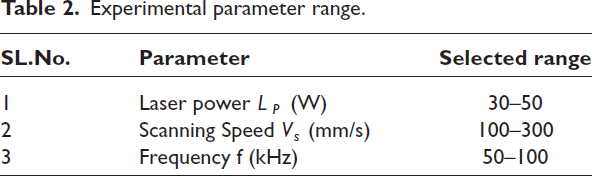
An Yttrium doped fibre laser micro-machining system of maximum average output power 50 W, wavelength 1064 nm, focal length or stand-off distance of 19.9 mm, pulse duration of 150 ns and spot diameter of 50 μm is used. The major process parameters varied in the experiments are laser power L
P
, scanning speed V
P
, and frequency f of the pulse. The ranges of mentioned parameters are listed in the table 2. The parameters are chosen after repeated experimentation such that the fluence of the laser beam is greater than the threshold fluence of aluminium
Experimental parameter range.
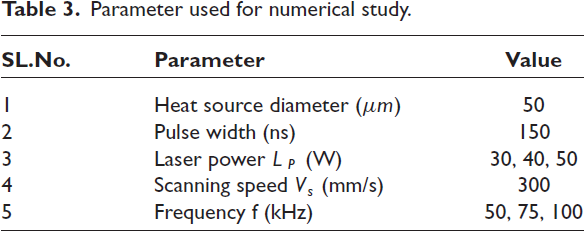
Parameter used for numerical study.
The fabricated single tracks are characterized for their shape and features with the help of a non-contact profilometer (Nano Map 1000 WLI). Surface topography and dimensional data of the tracks are obtained from the non-contact profilometer and Carl Zeiss Gemini 300, Field Emission Scanning Electron Microscope (FE-SEM), is used to obtain the morphology of the tracks. The fabrication is done three times in order to study the repeatability of the experiments.
Single track is the primitive element of material removal in laser micro-machining. The experiments were conducted to find the effect and optimize the process parameters such as laser power, scanning speed, and frequency on the output responses such as depth (D), width (W), and surface roughness (R a ) of machined single track. The optimal single track should have nominal track depth, nominal track width, less surface roughness, and less spatter on the sides of the track.
Numerical modeling of single track fabrication
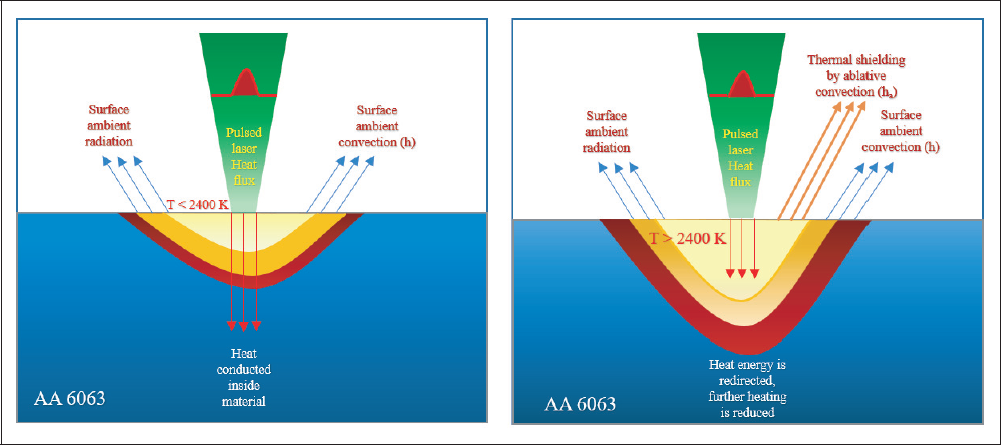
Thermal ablation phenomenon is observed in laser induced material removal as the applied thermal energy is utilized for vaporization and plasma generation which forms the heat shield. Simulation of thermal ablation requires three main phenomena to be considered, namely, heat shielding due to phase change and plasma formation, ablation of the material, and recoil pressure of the plasma plume formed. The effect of heat shielding and the ablation rate of the material leading to its removal has more significance in determining the depth of the track compared to the effect of recoil pressure. A simple schematic explaining the physics of heat shielding is given in the Figure 1.
Schematic of thermal shielding in simulation.
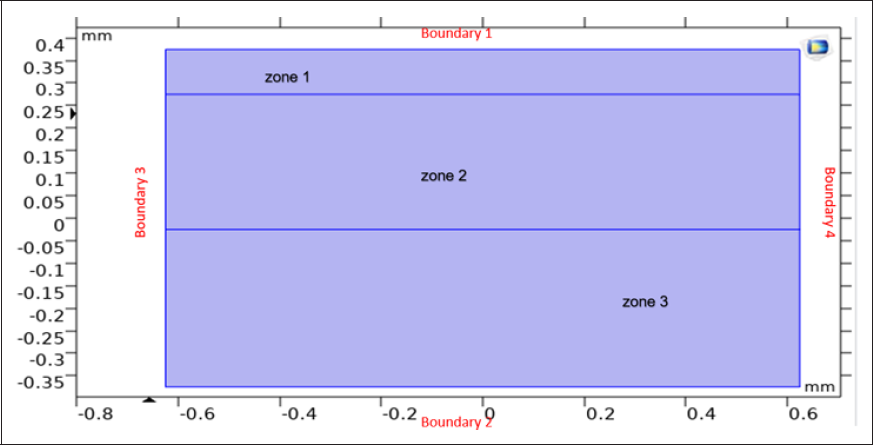
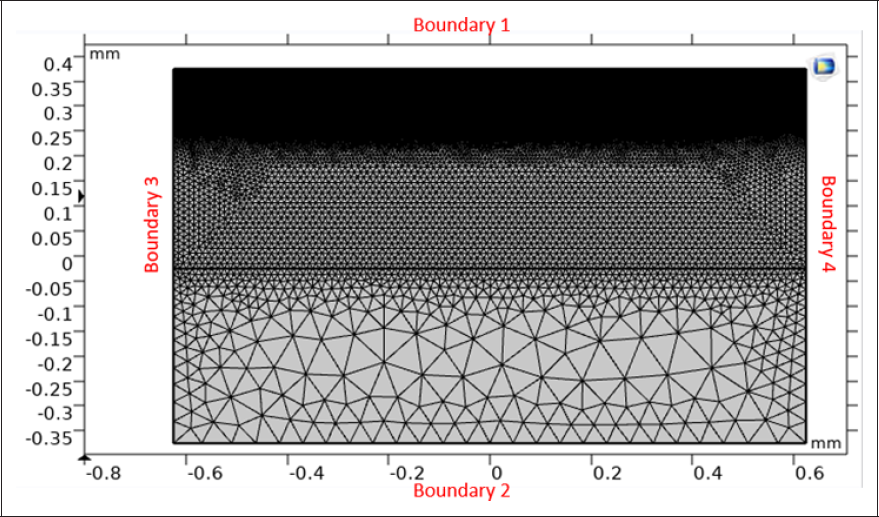
Thus, an attempt is made to numerically simulate the process by considering the physics of heat shielding and material removal in the form of a mathematical relation along with an ablative heat transfer coefficient. A twodimensional simulation is done using the COMSOL Multiphysics software. Figure 2 shows the different meshing zones considered in the simulation model based on their distance from the ablating surface. Zone 1 is of width 0.15 mm from the top or boundary 1, zone 2 is of width of 0.3 mm from the base of zone 1 and zone 3 is of width of 0.3 mm from the base of zone 2.
Simulation model with various zones and boundaries.
Assumptions
The assumptions considered for the simulation are as follows:
The material is completely homogeneous and isotropic. Material properties vary only with temperature. The material properties on the surface and the bulk material remains the same. Convection in molten material, spatter, re-deposition of the material are neglected. Oxidation of material during the process is not considered. Laser power absorption with variation of absorptivity of the material is neglected.
Mathematical model
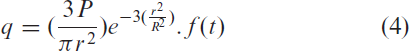
In order to determine the temperature field the transient heat diffusion equation with the source term as given by Eq. 1 is solved with appropriate boundary conditions.
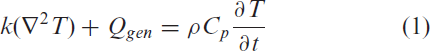
where,
Boundary conditions
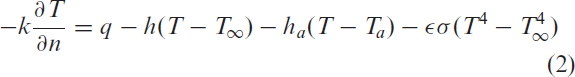
here,
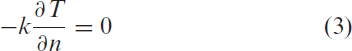
These boundaries are prescribed as adiabatic, and in Eqns.
Here,
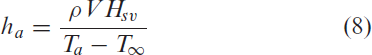
An energy balance analysis is performed to determine the ablative heat transfer coefficient h
a
as outlined below

Here, Q
a
(W) is the energy required for ablating the material by laser heating,
An equivalent amount of energy is assumed to be removed through convection using an effective ablative heat transfer coefficient once the material reaches the ablation temperature. Therefore,

Combining Eqn. 6 and 7,
Further, the rate of material removal through ablation (V) per unit area is calculated as follows
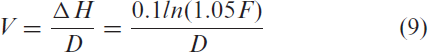
Here, F(J/cm
2
) is the fluence of the pulsed beam, D (s) the pulse duration also taken as 0.75 times of time period of the laser pulse, and
Meshing
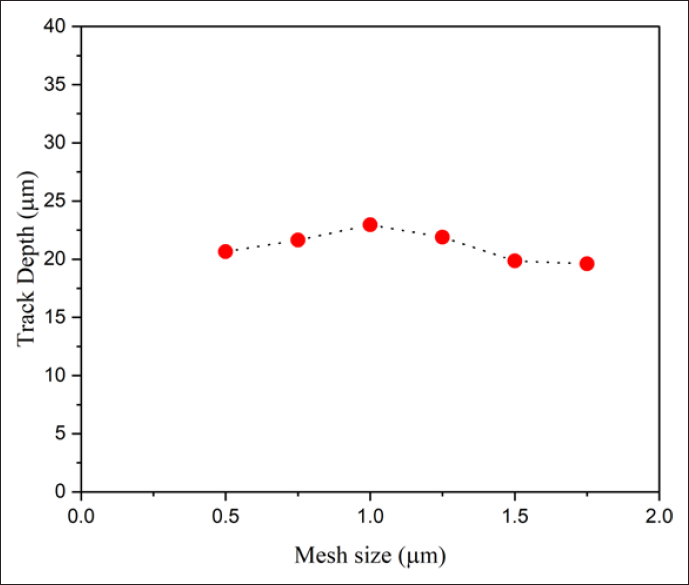
Triangular auto generated mesh is used and the mesh size is varied in three different zones. Figure 3 shows the layers of meshing in the model. A mesh independence study is conducted by changing the mesh size. The results of the mesh independence study performed by changing the mesh size from 0.5 μm to 1.75 μm are shown in Figure 4. Based on the study, in zone 1 very fine mesh of maximum mesh size 0.5 μm is used, while in zone 2 the maximum mesh size is limited to 5 μm and in zone 3 limited to 50 μm.
Different meshing zones in simulation.
Simulation results for
and
at three different mesh sizes.
Temperature dependent material properties for aluminium alloy AA 6063 are considered in the simulations and the prescribed boundary conditions are applied. As mentioned earlier, the physical process involves material ablation followed by heat shielding. The laser ablation process is simulated in such a way that once the nodal temperature reaches above the ablation temperature of the material, (T a ), the energy absorbed by the material during ablation is removed in the form of a convective heat loss dictated by the magnitude of the ablative heat transfer coefficient. The temperature distribution in the material thus obtained is post processed to predict the actual track depth by assuming that the portions of the material having a temperature above the ablation temperature have been removed during the process. This process is carried out in MATLAB and the depth of the track (D) is found and the values predicted from the numerical simulations are compared with experiments.
Results and discussion
This section initially discussed the effect of input process parameters such as laser power, scanning speed, and frequency on the dimensions of the machined single track. Further, the numerical simulation methodology is validated against the single track experiments by comparing the track depth predicted by the simulation and that obtained in the actual machining process. Next discussions on the track overlapping and scanning strategy for fabricating the protruded array of micro-features is presented in detail.
Single track study
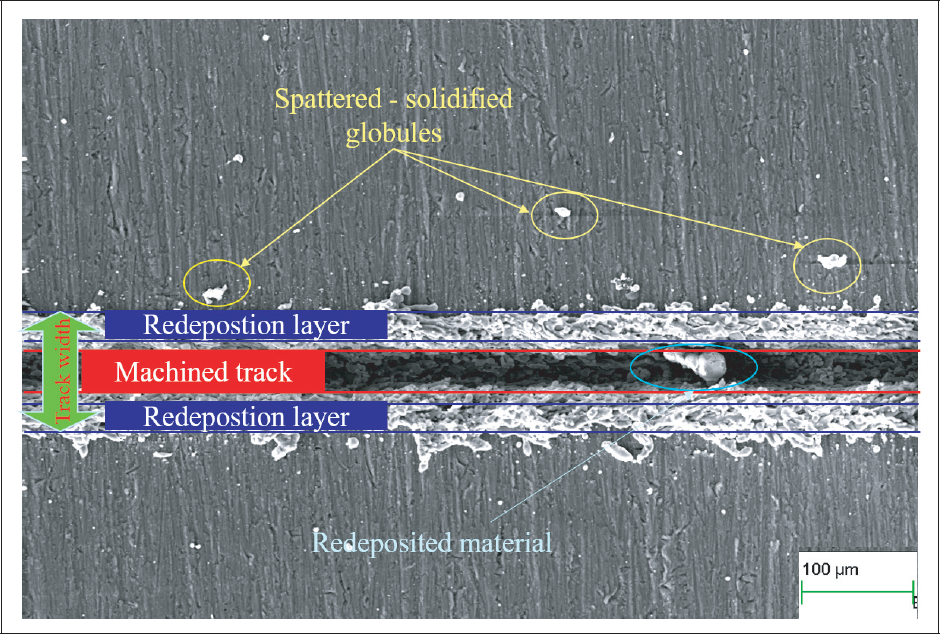
Figure 5 shows the SEM image of a typical single track with machined zone, re-deposition layer, width of track, and spatter on the outside of track.
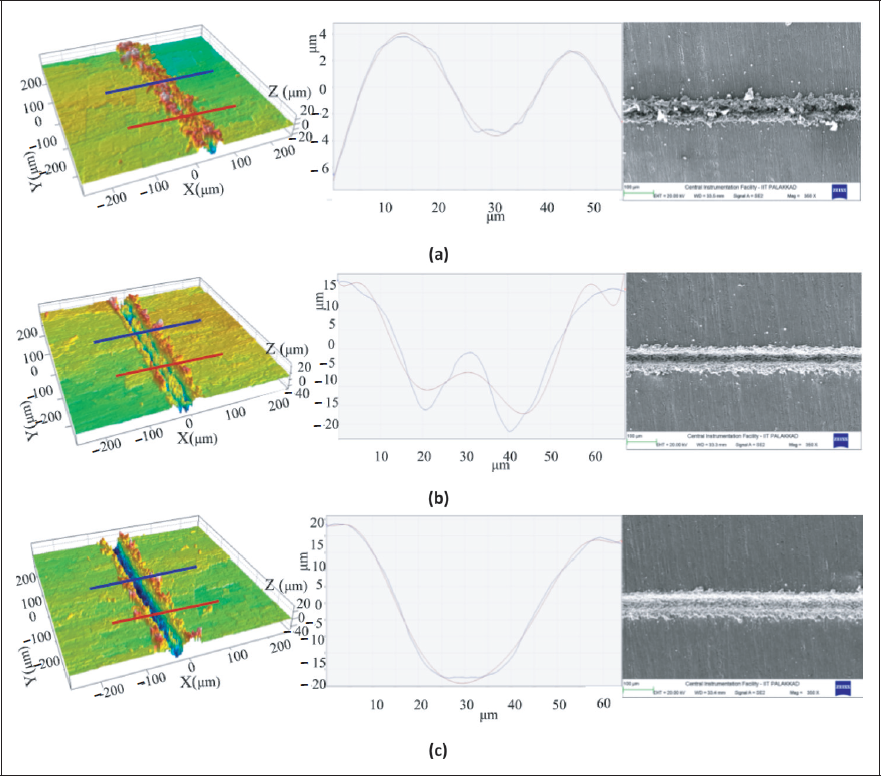
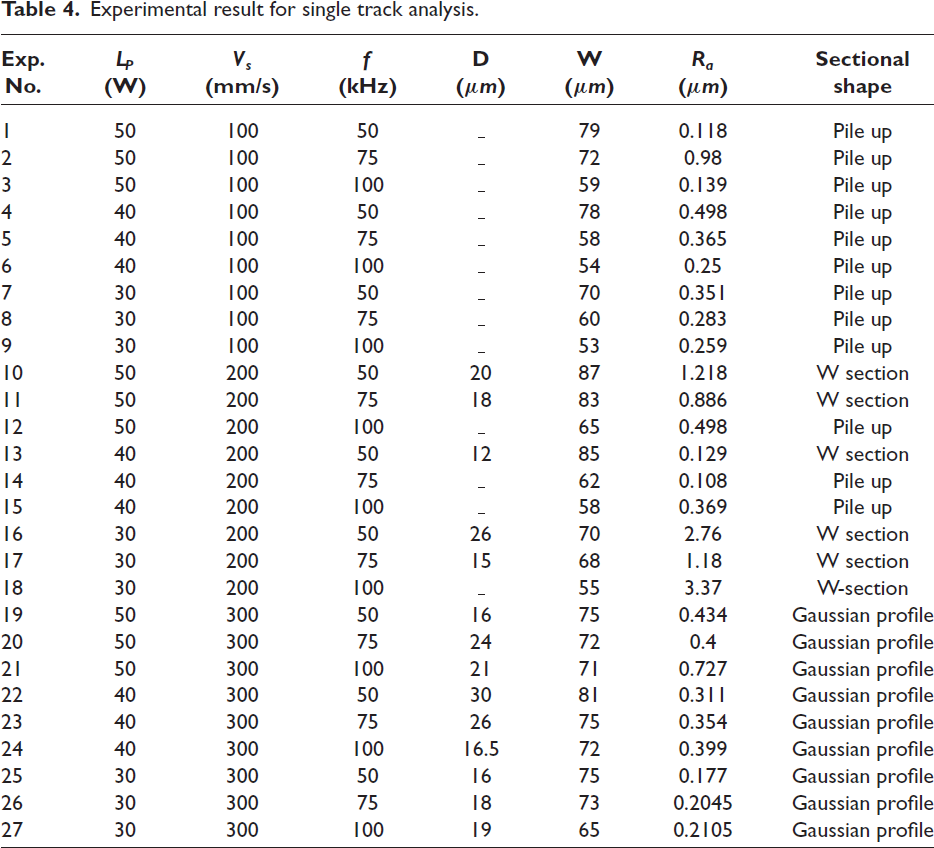
On analyzing the topography of the machined tracks, three different cross-sectional profiles were observed from 3-D profilometry images. Hence the average cross-sectional diagrams of the tracks were also analyzed. Figure 6a–6c shows the different 3-Dimensional profilometry images, average cross-sectional images, and SEM images at a laser power of 30 W and frequency of 50 kHz for various scanning speeds of 100 mm/s, 200 mm/s, and 300 mm/s. The major dimensional results that are obtained from the characterization of the tracks are track depth (D), track width (W), and surface roughness (Ra) of the machined single tracks. These dimensions vary with respect to the sectional shape of the track. Three different shapes in the tracks with respect to the scanning speed of 100, 200, and 300 mm/s are observed. From the average cross-sectional diagram, these tracks are categorized as pileup section, W-section, and Gaussian section based on the shape of the cross-section of a single track for further analysis. Table 4 shows the consolidated results of the single track experiments.
At 100 mm/s it is noted that the track has a formation of a pileup structure covering the machined area of the track. At 200 mm/s the cross-section of the tracks appear to be in the shape of a W-section with a machined groove and straight stream of protrusions lying in the middle of the machined area forming the sectional shape of a W-section. At 300 mm/s the track appears to be in shape replicating that of a Gaussian profile.
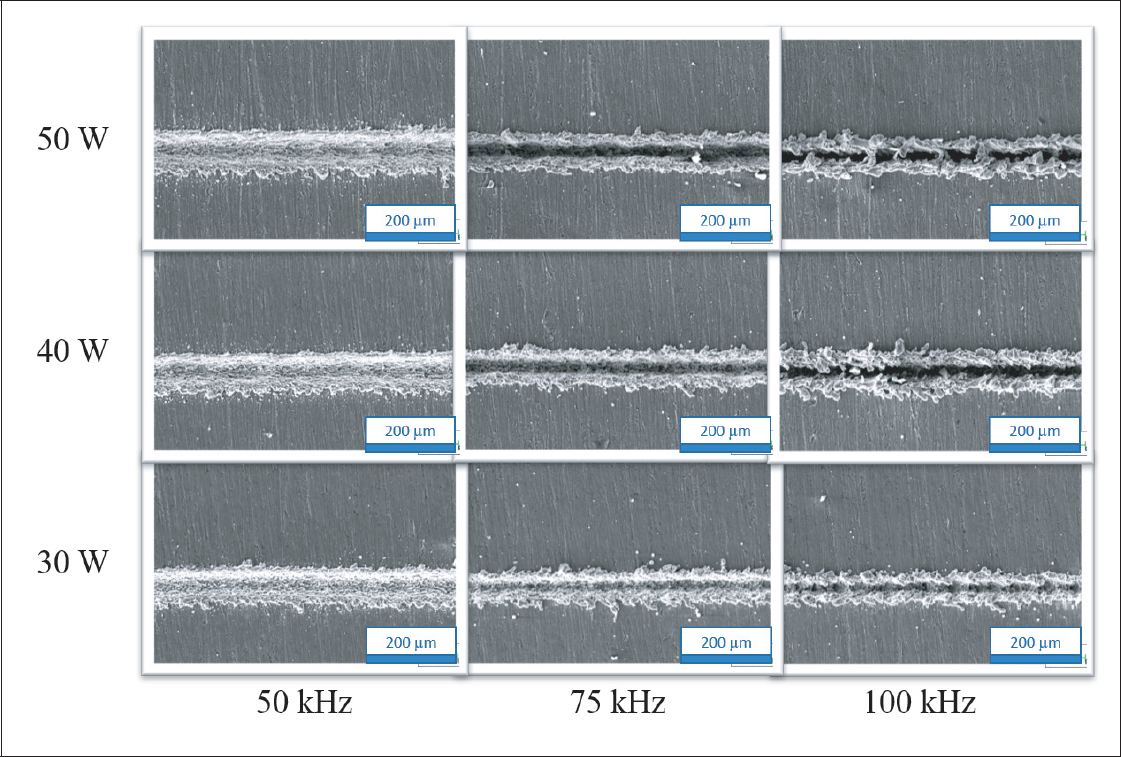
Figure 7 shows the variation in the morphology of the track with respect to scanning speed at 300 mm for different laser power and frequency. It is observed that the track width and width of re-deposition increase with respect to laser power. Also, the depth of the track increases with an increase in laser frequency. The tracks show very less spatter compared to the other tracks at 100 and 200 mm.
The observations related to the different shapes on the tracks and re-deposition layers as observed in Figures 5, 6 and 7 and reported in Table 4 can be attributed to a combined effect of marangoni convection, recoil pressure, and scanning speed of the pulsed laser source. The variation in the track shape is observed more prominently in the case of variation in scanning speed as compared to laser power and frequency. The variation in the scanning speed introduces the phenomena of overlap of the laser pulses (pulse overlap) during the pulsed mode of operation. This overlap decreases if the scan speed is high and the pulse frequency is less.
Typical SEM image of single track.
3-D profilometric image, average cross sectional line image, and SEM image for track with
; (a)
, (b)
and (c)
.
Surface morphology of the tracks for different laser power and frequency with respect to scan speed of
.
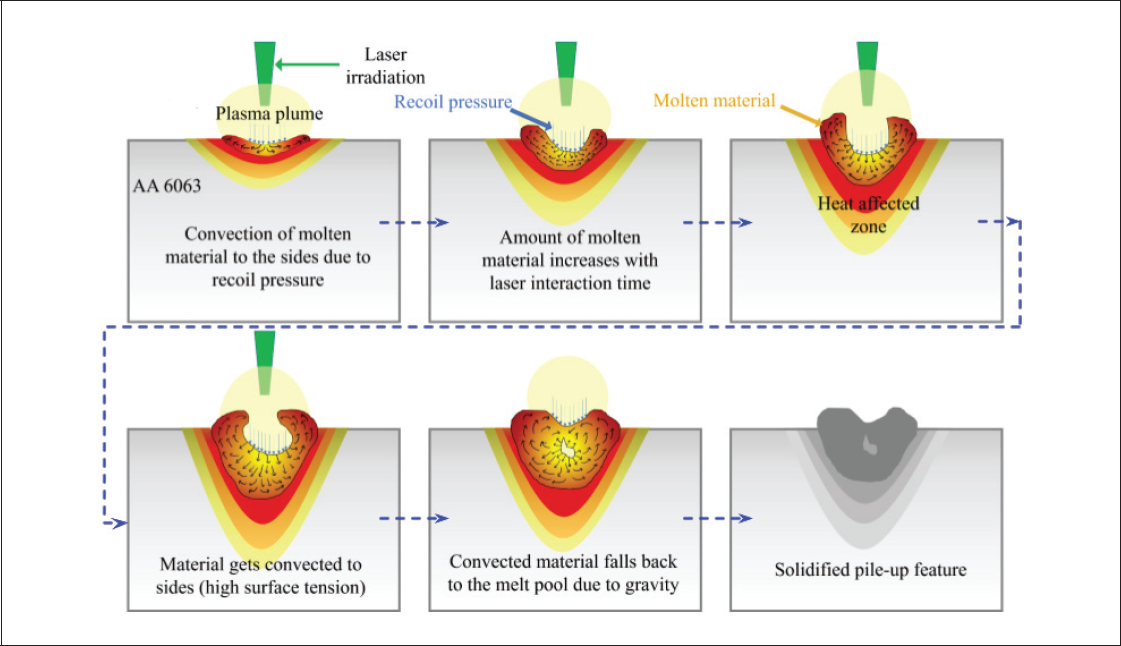
The schematic of the formation of pileup section (feature) is shown in Figure 8. When the pulse overlap is high the effective heating and melting of the material takes place due to high effective time of laser-material interaction. When more amount of material gets melted, the convective flow of the molten material takes place (marangoni convection) and the plasma plume that forms above the surface applies an instant recoil pressure over the melt pool. This pressure acting upon the meltpool further pushes it away from the center towards the outer edges of the meltpool and causes the fall back of the molten material back on to the machining zone, thus forming a pileup section which is considered as zero depth (D = 0). Similarly, a Wsection is formed in a similar fashion but the material gets expelled away from the machining zone.
Schematic of marangoni flow and recoil pressure of laser material interaction in the formation of pileup protrusions.
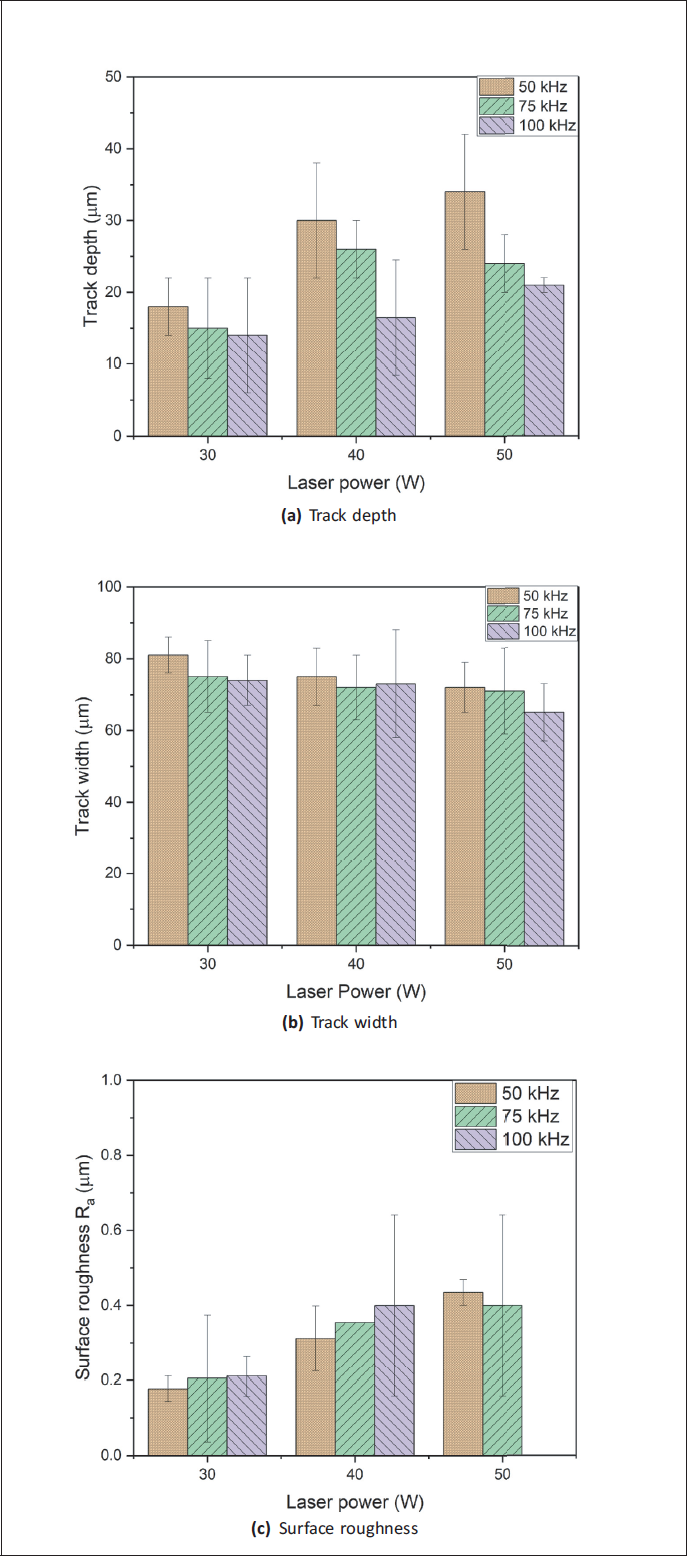
Therefore, in order to fabricate micro-features, the tracks with Gaussian groove section are considered. Figure 9a shows the variation of track depth with respect to laser power for different frequencies. It is observed that the track depth increases with laser power but decreases with frequency, this is because with increase in power the energy density and interaction time of action increases. Figure 9b shows the variation of track width with respect to laser power for different frequencies. Track width decreases with laser power and frequency. Figure 9c shows the variation of surface roughness R a with respect to laser power for different frequencies. It is noted that the surface roughness increases with laser power as well as frequency because of formation of molten globules of metal along the scan track as shown in Figure 5. These resolidified globules deteriorate the surface of the machined track.
Effect of laser power on (a) track depth, (b) track width, and (c) surface roughness for various frequency.
The least value of the thickness of the re-deposited layer is 10.5 μm and surface roughness is 0.177 μm while the track depth is 16 μm and width is 75 μm as seen in the track having laser parameters
Experimental result for single track analysis.
Validation of the numerical model
The simulation results obtained from the proposed numerical model is validated against the experimental results. The variation in the ablation rate plays a major role in accurately predicting the track depth. The laser heat source is made to move for 0.5 mm along boundary 1 as seen in Figure 3. The iso-thermal contour line having a temperature value equal to 2400 K (ablation temperature of AA6063) is traced and the region in the domain above it is considered to have been ablated during the laser machining process. The lowest point in this contour line is considered as the track depth. Figure 10a shows the temperature profile in the considered domain while Figure 10b shows the plot of the iso-thermal contour line as described above for the single track simulation performed for the considered experimental condition, namely,
(a) Temperature profile and (b) isotherm line for
and
.
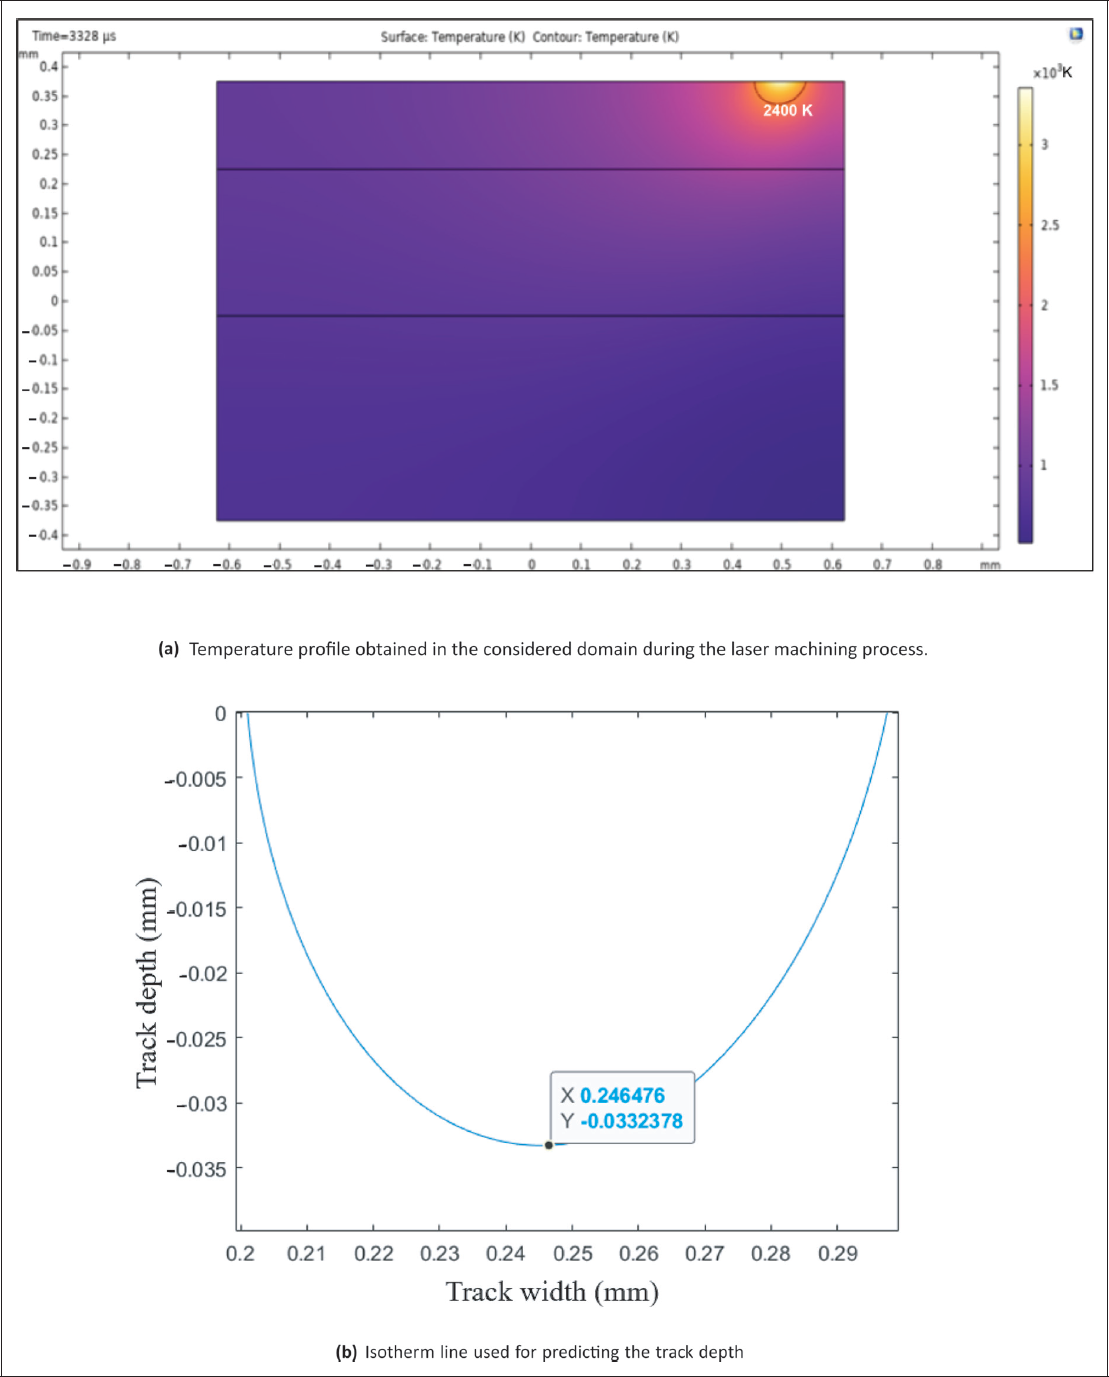
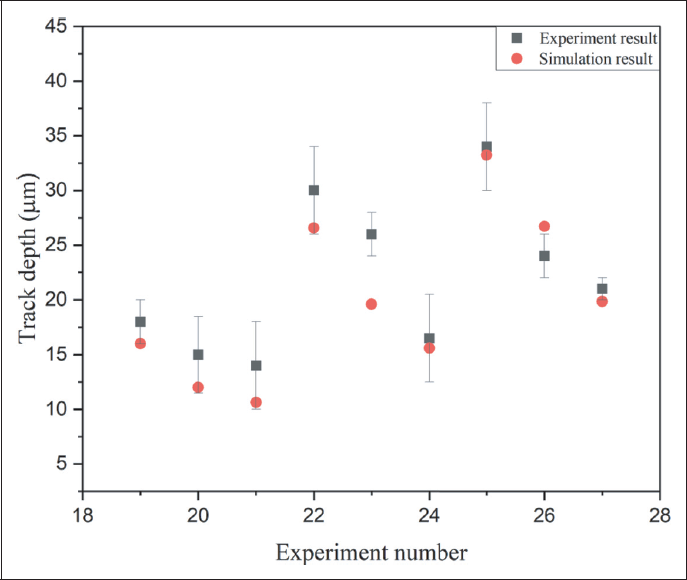
Figure 11 shows a comparison of the predicted track depths obtained from the simulations and as obtained from the experiments. As seen, both the data match well. Furthermore, from the simulations, it is also understood that the value of the ablative heat transfer coefficient plays a major role in the accurate prediction of the track depth. Hence, it should be carefully calculated based on the fundamental energy balance relations as outlined in Eqn. 8 (Section 1).
I. Comparison of simulation with experimental track depth.
Multi-tracks
The protruded micro features are produced by removing the material around the desired shape. The machined area gets covered by stacking these single tracks adjacent to each other. Line overlap study is done by overlapping the tracks for a smooth machined surface. Further, the scanning angle is changed on each pass of machining in the scanning strategy study to select the optimal method for the proper shape of the feature.
Line overlap study
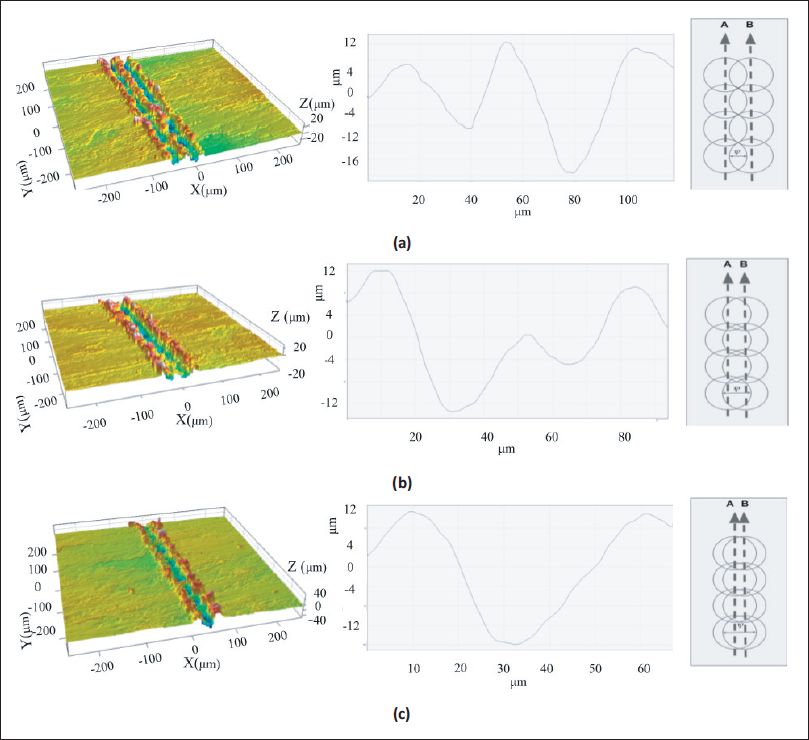
The percentage of overlap between the lines dictates the characteristics like surface roughness and depth of the machined zone. The overlap distance is varied from 40%–80% (i.e., 20-40 μm). Figure 12 shows the topographical image and contour line of the multi-tracks. At higher overlap distance the tracks form a single crater pushing away the re-deposition to one side as seen in Figure 12c. With increase in percentage overlap the machined area looks smooth without the formation of a central peak in between. The tracks with an overlap distance of 40 μm show better topography and contour diagram with less redeposition compared to the other two overlaps. Thus the protruded features are fabricated with an overlap distance of 40 μm (80%).
Topographical image and sectional line diagram of two adjacent tracks with overlap distance of (a) 40%, (b) 60% and (c) 80%.
Scanning strategy study
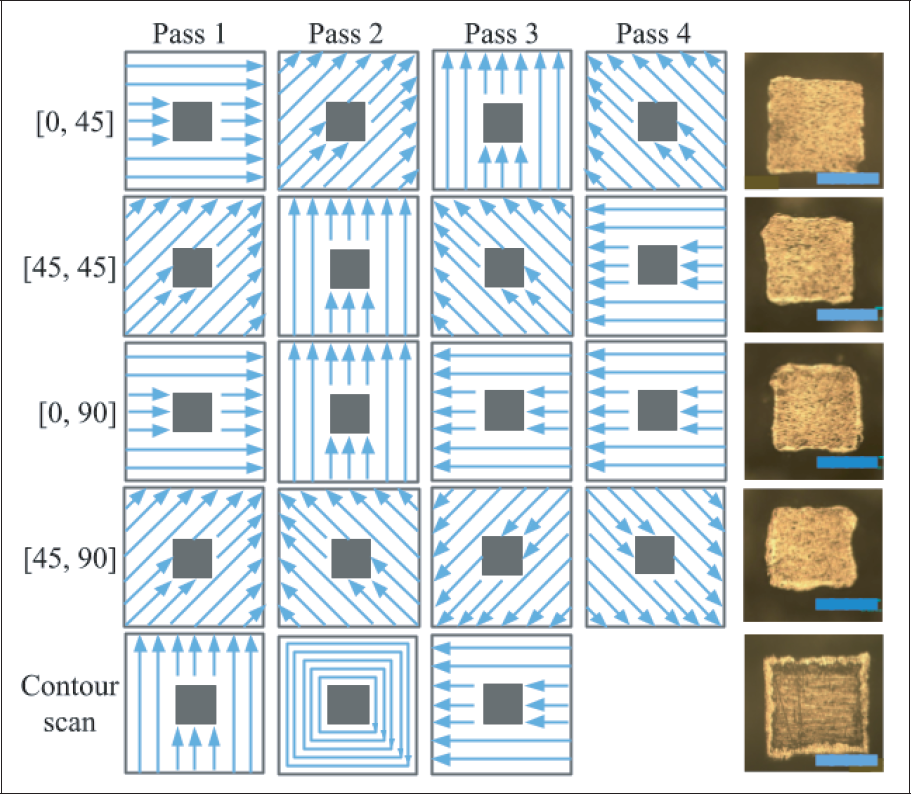
A square shaped feature of size 400 μm is fabricated. Five different scanning strategies are selected based on the orientation of the scan tracks after every pass. They are termed [0,45], [45,45], [0,90], [45,90], and contour scan- ning. This rotation of the scanning angle is done for four passes and this forms one cycle of machining. These cycles are repeated four times; hence 16 passes are machined. The feature is fabricated at the center of the machined surface so as to determine the effect of the strategy on the edges of the shape and side walls of the protrusion.
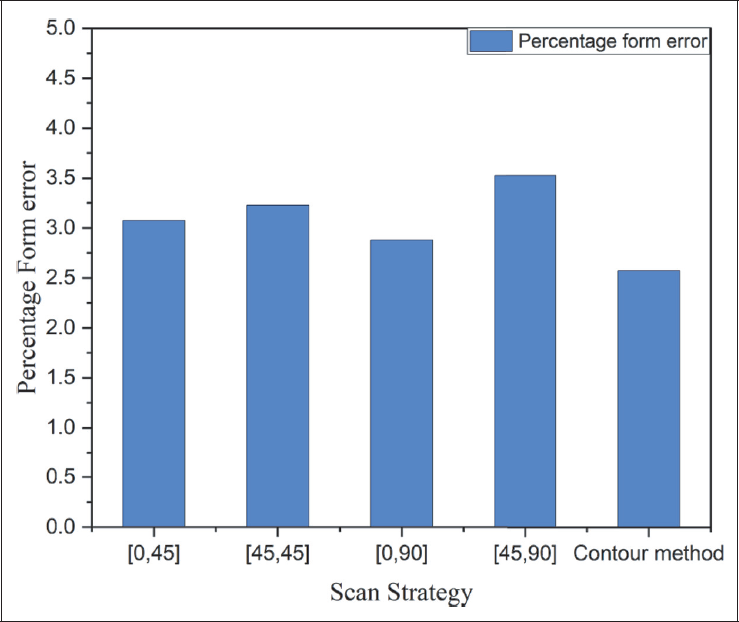
Figure 13 shows the various scanning strategies, their respective passes in each cycle, and the fabricated square protrusion on each strategy. Figure 14 shows the percentage form error obtained for the scanning strategies. The features made of the contour method show less error in the form, hence contour method scanning strategy is used for the fabrication of micro-features.
Vector diagram of each cycle in a scanning strategy and the fabricated features (200
scale bar).
Percentage form error in the square feature for various scanning strategies.
Fabrication of protruded micro-features
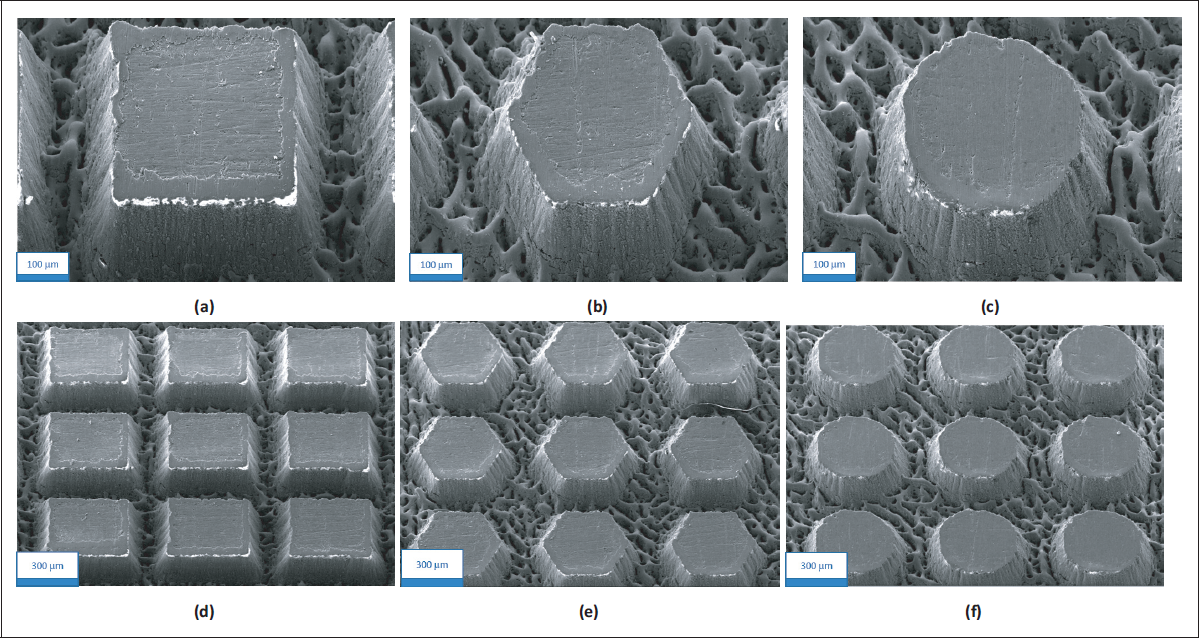
From the obtained optimum parameter of single and multiple track analysis, the protruded features are fabricated. Three different shapes of protrusions like polygon (square, hexagon), and circle are planned for fabrication as they are the widely used shapes in any micro-manufacturing process. The contour scan method comes as the best suited method as it covers the area in the form of concentric feature shapes. This avoids the deterioration of the edges over multiple laser passes. The features are designed with a uniform size of 400 μm (side of the square section, distance between the parallel sides for hexagonal section, and diameter of the circular section) and a space of 200 μm between the shapes. Figure 15a–15c shows the SEM image of single protrusion of the three shapes in tilted mode, depicting the side walls and the machined surface. Figure 15d–15f shows SEM image of the array of the fabricated protruded features. The fabrication is done in multiple passes (30 passes) of laser scan to attain a proper height of the protrusions. The height of the protrusions is in the range of 250-300 μm. Fabrication of protruded features is done as 3 ×3 arrays of square, hexagonal, and circular sections. These types of arrayed protruded micro-features can be used for enhancing the performance of the parts in tribology, drag reduction, radiation absorption, heat transfer, and so on.
SEM images of fabricated protrusions (a) Square section, (b) Hexagonal section and (c) Circular section and array of protrusions like (d) Square array, (e) Hexagonal array and (f) Circular array.
Conclusions
In this work, array of various shapes of protruded micro features were fabricated on AA 6063 using laser micromachining. The important conclusions of the study are as follows:
Three different cross sections, namely, pile-up section, W-section, and Gaussian section are seen for scanning speeds of 100 mm/s, 200 mm and 300 mm/s respectively while the laser power and frequency remains constant. For the investigated range of process parameters, track depth increases, and track width decreases with increasing laser power and frequency. The surface roughness of the tracks increases with laser power and scan speed but it decreases with frequency It was found that the nominal track depth, track width, and less roughness obtained for L
P
= 30 W, f = 50 kHz, and V
s
= 300 mm/s. A numerical model for predicting the track depth was proposed and a dominant effect of ablative heat transfer coefficient (h
a
) on the prediction of track depth for specified operating parameters was observed. The simulation results showed good agreement with the experimental result. The optimal overlap distance of the tracks was found to be 40 μm for the obtained optimized process parameters. Further, it is observed that the contour method scanning strategy produced protruded micro features with minimal form error. Arrays of the polygon and circular protruded microfeatures were machined using the optimized parameters by multiple passes of overlapped single tracks according to the contour scanning strategy. These arrays of protruded micro-features were made with consideration of various applications such as tribology, drag reduction, radiation absorption, heat transfer, etc.
Footnotes
Acknowledgement
The authors of this article would like to acknowledge the CFMM, facility of IIT Palakkad for providing the laser machining system. Special thanks to CIF, IIT Palakkad for helping in the characterization process by providing access to their FESEM, Carl Zeiss Gemini 300 and Non-contact profilometer, NanoMap 1000 WLI. The authors would like to thank Mr. Shanmugapriyan, IIT Palakkad, for their valuable inputs.
Declaration of Conflicting Interests
The authors declared no potential conflicts of interest with respect to the research, authorship and/or publication of this article.
Funding
The authors received no financial support for the research, authorship and/or publication of this article.