
Abstract
Objective:
Primary open-angle glaucoma (POAG) is a leading cause of vision loss, with lipid metabolism implicated in its pathogenesis. Our study explores lipid metabolism-derived acylation modifications in POAG using GEO, GWAS, and PubChem databases.
Methods:
Integrated multi-omics approaches were employed: Mendelian randomization assessed causal relationships between lipid traits and POAG risk; transcriptomic analysis (gene set variation analysis, weighted gene co-expression network analysis) identified key acylation-related genes; machine learning selected feature genes; and single-cell sequencing validated mechanisms in human trabecular meshwork samples.
Results:
Four lipid metabolism-derived acylations (palmitoylation, myristoylation, succinylation, malonylation) were significantly upregulated in POAG. Core genes 5′-aminolevulinate synthase 2 (ALAS2) and phospholipase C epsilon 1 (PLCE1) were mechanistically linked: ALAS2 catalyzed acyl-CoA accumulation, while myristoylated PLCE1 promoted trabecular fibrosis via collagen type IV alpha 3 chain interaction. External datasets confirmed these findings.
Conclusion:
Lipid-derived acylations drive POAG through ALAS2-mediated acyl-CoA production and PLCE1-induced fibrosis, revealing novel targets for intervention. Lipid metabolism-derived acylation modifications, particularly succinylation, propionylation, and myristoylation, may play a crucial role in POAG. These findings highlight the potential role of acylation modifications in POAG and offer new insights into POAG’s molecular mechanisms and potential research directions.
Plain language summary
Glaucoma is a common eye disease that can cause irreversible blindness, often linked to high pressure inside the eye. We know that the way the body processes fat (fat metabolism) plays a role in this disease, but the exact details have been a mystery. Understanding this process is key to finding new ways to treat patients. In our study, we used powerful computer techniques to analyze large amounts of genetic data from the eye tissue of glaucoma patients and healthy individuals. We focused on tiny chemical changes to proteins, which are triggered by fat metabolism. We discovered that four specific fat-related changes were much more common in people with glaucoma. Our analysis also identified two key genes, ALAS2 and PLCE1, that appear to be central to this process. The ALAS2 gene helps produce the chemical building blocks that cause these protein changes. The PLCE1 gene is involved in creating scar tissue in the eye’s drainage system (the trabecular meshwork). This scarring can block fluid from leaving the eye, causing pressure to build up and damaging the optic nerve. These findings provide a new explanation for how problems with fat metabolism can lead to glaucoma. By pinpointing these specific genes and their actions, we have identified promising targets for developing new therapies. Future research could focus on creating drugs that influence these genes or the protein changes they control, potentially preventing scarring and protecting vision. While our results are from computer analysis, they provide a crucial roadmap for the next steps: laboratory experiments to confirm these mechanisms and explore new treatments.
Introduction
Primary open-angle glaucoma (POAG) is a leading cause of vision loss, characterized by elevated intraocular pressure (IOP), optic nerve damage, and visual field deterioration, often progressing asymptomatically until advanced stages.1–3 Chronic optic nerve injury due to sustained elevated IOP leads to progressive damage of optic nerve fibers.4–6 The insidious onset and subtle early symptoms typically result in diagnosis only after significant optic nerve damage, potentially leading to irreversible blindness.7,8 While elevated IOP is a key contributor to POAG pathogenesis, genetic,9–11 environmental,12,13 and other biological factors9,14–16 also play critical roles. These factors contribute to the variability in POAG risk and complicate treatment strategies. Given the lack of clear early symptoms, early screening and diagnosis have become central to research efforts. 17 Recent advancements in molecular biology and genomics offer promising opportunities for early diagnosis10,18,19 and form the foundation for precision medicine in POAG management.
With societal advancement, the global prevalence of obesity and related diseases such as fatty liver, type 2 diabetes, and sleep apnea has surged. Emerging studies indicate a potential link between obesity, lipid metabolism, and POAG. Jae Yeun Lee et al. found that nutritional intake was associated with POAG progression in a cohort of Korean patients. 20 Similarly, Shi Song Rong et al. identified phenotypic and genetic overlap between POAG and body fat distribution. 21 In obese populations, elevated blood glucose and lipid levels may exacerbate POAG, with dyslipidemia contributing to its risk. A meta-analysis by Guimei Huang and Jiayi Wang demonstrated that dyslipidemia increases POAG risk, while Simon Nusinovici et al. suggested that cholesterol transport dysregulation could be implicated in POAG onset.22,23 Lipid metabolism might affect POAG by increasing orbital fat, blood viscosity, and episcleral venous pressure, which reduces aqueous humor outflow and elevates IOP. Additionally, lipid metabolism may induce oxidative stress in the trabecular meshwork (TM). Research by Yang Zhang and Ruiqi Han et al. showed that the transmembrane and coiled-coil domains 1 (TMCO1) gene drives ferroptosis through lipid peroxidation and induces TM extracellular matrix (ECM) deposition via the mitogen-activated protein kinase 1 (ERK/MAPK) pathway. Moreover, Kexin Liu et al. highlighted the crosstalk between lipid oxidation, the Piezo1 ion channel, and POAG. 24
Intermediate metabolites of lipid metabolism also play a crucial role in post-translational modifications, including butyrylation, crotonylation, and succinylation. These modifications have been extensively studied in various diseases, such as cancers,25–27 neurodegenerative diseases,24,28 and cardiovascular diseases. 29 Regarding glaucoma, current research has predominantly focused on acetylation modifications. The impact of this acylation on glaucoma pathogenesis is critically dependent on its subcellular localization. Specifically, acetylation of p53, nuclear factor kappa B (NF-κB), and signal transducer and activator of transcription 3 (STAT3) in retinal ganglion cells promotes neuronal apoptosis, inflammation, and senescence, thereby exerting detrimental effects in glaucoma. 30 Conversely, acetylation of α-tubulin in TM cells enhances microtubule stability and contributes to IOP reduction. 31 Although research on acylation modifications in POAG remains in its nascent stages, preliminary studies indicate their potential pathophysiological significance. For instance, Jaclyn Y. Bermudez and Hannah C. Webber identified an association between histone acetylation and elevated transforming growth factor beta 2 (TGF-β2) expression, which may promote TM damage. 32 Nevertheless, significant knowledge gaps persist regarding the effects of acylation modifications on POAG, particularly concerning emerging modifications such as lactylation, β-hydroxybutyrylation, and succinylation. This underscores the critical need for further investigation into the roles of acylation modifications in POAG pathogenesis.
While the role of acetylation modifications in POAG pathogenesis has garnered increasing attention, research into other acylation modifications remains largely unexplored. To address this significant knowledge gap and explore the potential impact of novel, non-acetyl acylation modifications on POAG, our study integrated a gene set associated with 13 distinct non-acetyl acylation modifications. Utilizing transcriptomic data from the POAG TM in the GEO database, we employed a comprehensive analytical framework including differential gene enrichment analysis, Mendelian randomization (MR), weighted gene co-expression network analysis (WGCNA), machine learning, and molecular docking techniques. Our primary objective was to investigate the influence of these specific non-acetyl modifications on POAG and identify key genes associated with them.
Material and methods
Data sources
Transcriptome data of human POAG TM were obtained from the GEO database (https://www.ncbi.nlm.nih.gov/gds). The dataset GSE27276 (normal = 19, POAG = 17) was used as the training set for differential expression analysis, WGCNA, and machine learning, while GSE4316 (normal = 3, POAG = 2) served as the validation set for gene expression validation. Both datasets were derived from Homo sapiens TM tissues, including POAG patients and healthy controls. The inclusion criteria for POAG subjects were a confirmed diagnosis of POAG, while controls had no history of glaucoma or other ocular neurodegenerative diseases. The dataset GSE231749 (normal = 1, Glaucoma = 1) was used for single-cell analysis and originated from Macaca mulatta TM tissues in order to model POAG-like pathology in a controlled setting. MR analysis data were sourced from the GWAS database, with exposure factors including ebi-a-GCST002783 (sample_size = 236,781, nsnp = 2,529,499), ieu-a-91 (sample_size = 72,546, nsnp = 2,331,456), and met-d-S_VLDL_PL_pct (sample_size = 115,078, nsnp = 12,321,875), and the disease outcome bbj-a-75 (sample_size = 22,795, nsnp = 5,961,428). Acylation modification-related gene sets were collected from the GeneCards database (https://www.genecards.org/) and relevant literature sources for gene set variation analysis (GSVA) scoring and WGCNA analysis.33–39 Protein structures for key genes were predicted using AlphaFold (https://alphafold.ebi.ac.uk/), and the corresponding PDB files were retrieved. Acylation modification ligand structures were downloaded from the PubChem database (https://pubchem.ncbi.nlm.nih.gov/) in SDF format.
Differentially expressed genes analysis and functional enrichment
Differentially expressed genes (DEGs) in the training set were identified using the limma package, with thresholds set at adjusted p < 0.05 and |log2FC| > 0.5. Volcano plots and heatmaps were generated using ggVolcano and ComplexHeatmap packages. Functional enrichment analysis of DEGs was performed with the clusterProfiler package, using Gene Ontology (GO) and Kyoto Encyclopedia of Genes, Genomes (KEGG) as the background, and applying the parameters: pvalueCutoff = 0.05, pAdjustMethod = “BH”, qvalueCutoff = 0.05, and minGSSize = 3.
MR analysis
MR analysis was conducted using the TwoSampleMR package, based on the exposure factors and disease outcome. Single Nucleotide Polymorphism (SNPs) were filtered with the thresholds p1 = 5e-08, p2 = 5e-08, r2 = 0.001, and kb = 1000. Five methods (MR Egger, Weighted Median, Inverse Variance Weighted (IVW), Simple Mode, and Weighted Mode) were used to assess causal relationships between exposure factors and disease outcomes.
Single-sample gene set enrichment analysis and Boruta analysis
For acylation modification-related gene sets, Single-sample gene set enrichment analysis (ssGSEA) was performed using the GSVA package. Acylation modification scores were ranked by disease status and assessed for significance using the Boruta package, with a p-value threshold of 0.001 to identify key factors influencing POAG.
Weighted gene co-expression network analysis
WGCNA analysis was performed on the training set, with outliers excluded. The optimal soft threshold was determined, and a gene Topological Overlap Matrix (TOM) clustering tree was constructed using the dynamic tree-cutting algorithm (minimum gene number = 100). Correlation coefficients between modules and traits were calculated using Pearson’s method, and heatmaps were generated. The module most strongly correlated with disease status was identified as the key module, and its correlation with acylation modification scores was assessed. Acylation modifications significantly correlated with POAG were selected using thresholds of |cor| >0.3 and p <0.05.
Overlapping gene analysis
Venn diagrams were used to identify common genes among DEGs, key module genes, and acylation modification-related genes significantly correlated with POAG status. These genes were considered candidate genes.
Feature gene selection
Feature gene selection for candidate genes was performed using Least Absolute Shrinkage and Selection Operator (LASSO) and Support Vector Machine-Recursive Feature Elimination (SVM-RFE) with 5-fold cross-validation, with samples classified according to their disease status (POAG or control). The intersection of feature genes from both methods was used for disease status grouping, and receiver operating characteristic (ROC) curves were generated using the pROC package. Gene expression levels were analyzed in the training set using the Wilcoxon test, with box plots of the validation set drawn using the ggplot2 package. Genes with an area under the curve (AUC) >0.7, significant expression differences in the training set, and consistent expression trends in the validation set were considered key acylation modification genes in POAG.
Molecular docking
Protein structure files and acylation modification ligand files were used to identify candidate protein pockets using the CB-Dock2 platform (https://cadd.labshare.cn/cb-dock2/php/index.php). Molecular docking was performed using AutoDock Vina, with docking poses exhibiting scores <0.6 considered reliable and visualized. The Pearson correlation coefficients between key acylation modification molecules and all other genes in the training set were calculated and ranked.
Gene functional analysis
Single-gene GSEA was performed using the clusterProfiler package, with GO and KEGG as the background and pvalueCutoff = 0.05, pAdjustMethod = “BH” as thresholds to explore the potential biological roles of key acylation modification genes in the training set.
Single-cell analysis
For the GSE231749 dataset, the Seurat package was used to construct a single-cell analysis object. Quality control was performed by filtering low-quality cells based on thresholds of nFeature_RNA <4000, nCount_RNA <15,000, and percent.mt <10. The DoubletFinder package was employed to detect and remove doublet cells. Data normalization was performed using the LogNormalize algorithm, and the top 2000 highly variable genes were selected for Principal Component Analysis (PCA) clustering. Based on the first 30 principal components, Uniform Manifold Approximation and Projection (UMAP) clustering was conducted at a resolution of 0.6. The FindAllMarkers function was used to identify marker genes for each cell cluster, followed by GO and KEGG enrichment analysis of these markers. Cell types were annotated using CellMarker2.0. The cell cluster with the highest number of key gene-positive cells was identified as the key cell population. Finally, pseudotime trajectory analysis was performed on the key cells using the monocle3 package.
Statistical analysis
Analyses used GraphPad Prism (v9.0, GraphPad Software, Inc., San Diego, CA, USA), R (v4.2.1), Cytoscape (v3.8.0, developed by the Cytoscape Consortium, University of California, San Diego, CA, USA), SPSS (v26.0, IBM Corporation, Armonk, NY, USA), and STRING. Diagnostic performance was evaluated via ROC curves (AUC, sensitivity, specificity, Youden’s index). Statistical tests included: the Kolmogorov-Smirnov test for normality; the Unpaired t-test and the Wilcoxon test for group comparisons. Significance thresholds: *p < 0.05, **p < 0.01, ***p < 0.001.
Results
Dysregulated expression of lipid metabolism-related genes in the TM of POAG patients
To investigate molecular differences between POAG patients and controls in the trabecular meshwork, differential expression analysis was performed using the limma package (Supplemental Table 1). A total of 376 DEGs were identified, with 184 genes upregulated and 192 downregulated (Figure 1(a) and (b)). Functional enrichment analysis of these DEGs revealed disruptions in biological processes related to lipid metabolism (Supplemental Tables 2 and 3), such as monocarboxylic acid binding, fatty acid binding, and positive regulation of phosphatidylinositol 3-kinase/protein kinase B signaling, which are involved in cell growth and development (Figure 1(c) and (d)). These findings align with previous studies by Tianyi Kang, Yi Zhou, 40 and Minna Helin-Toiviainen, Seppo Rönkkö, 41 confirming the abnormal expression of lipid metabolism-related genes in the TM of POAG patients.

Differential gene expression analysis between POAG and normal samples. (a) Volcano plot of differential genes between POAG and normal samples. The x-axis represents the log2 fold change (POAG/normal), and the y-axis shows −log10(adjusted p-value). Each point corresponds to a gene, with pink dots indicating upregulated genes and green dots indicating downregulated genes. The top 10 differentially expressed genes are labeled. (b) Circular heatmap of differential genes between POAG and normal samples. Each small square represents a gene, with color intensity indicating the gene expression level (red for high expression, blue for low expression). Each circle represents a sample, displaying the top 20 upregulated and top 20 downregulated genes, ranked by adjusted p-value, across different samples. (c) GO enrichment bubble plot of differential genes between POAG and normal samples. The x-axis represents the proportion of differentially expressed genes enriched in each pathway, and the y-axis lists the associated GO terms. The bubble size reflects the number of differentially expressed genes in each term, while the bubble color indicates the statistical significance of the enrichment. (d) GO enrichment bar plot of differential genes between POAG and normal samples. The x-axis represents the number of differentially expressed genes enriched in each pathway, and the bar color indicates the statistical significance of the pathway enrichment.
Causal relationship between lipid-related exposure factors and POAG
MR analysis further supported our hypothesis. Using data from the GWAS database, we conducted a two-sample MR analysis with ebi-a-GCST002783 (BMI), ieu-a-91 (Obesity class 2), and met-d-S_VLDL_PL_pct (Phospholipids-to-total lipids ratio in small Very Low Density Lipoprotein (VLDL)) as exposure factors, and bbj-a-75 (Open-angle glaucoma) as the disease outcome. The analysis revealed that higher lipid levels, body weight, and obesity were significantly associated with POAG risk (Figure 2(a)–(c), (j)–(l)). To validate the MR results, we performed leave-one-out, horizontal pleiotropy, and heterogeneity analyses. Leave-one-out analysis showed stable results after removing each SNP (Figure 2(d)–(f)), excluding outliers. Horizontal pleiotropy analysis indicated no confounding by other factors (p > 0.05), reinforcing the association between body weight, obesity, lipid levels, and POAG risk (Tables 1–3). MR scatter plots showed that, under the IVW method, the intercept of the MR fitting line was near zero. Although the MR Egger test showed a slight intercept for ieu-a-91 (Figure 2(k)), its p-value supported a credible effect, likely due to the limited number of instrumental variable SNPs. Heterogeneity tests revealed no significant heterogeneity across cohorts (p > 0.05). Overall, MR analysis suggested a potential causal relationship between lipid levels, obesity, and increased POAG risk.

Mendelian randomization analysis. (a–c) Forest plots illustrating SNP associations from ebi-a-GCST002783, ieu-a-91, and met-d-S_VLDL_PL_pct with bbj-a-75. SNPs right of the dashed line indicate a risk effect on bbj-a-75, while those on the left indicate a protective effect. Aggregated effects of all SNPs on bbj-a-75, assessed by MR Egger and Inverse Variance Weighted methods, are shown at the bottom. (d–f) Leave-one-out forest plots for SNPs from ebi-a-GCST002783, ieu-a-91, and met-d-S_VLDL_PL_pct against bbj-a-75. Each horizontal line represents the model’s effect excluding the corresponding SNP, with overall effects presented at the bottom for all excluded SNPs. (g–i) Funnel plots of SNPs from ebi-a-GCST002783, ieu-a-91, and met-d-S_VLDL_PL_pct with respect to bbj-a-75. Red and blue lines represent two statistical testing methods, with SNPs distributed around the lines. A symmetrical distribution around the red line suggests conformity with Mendel’s second law of random assortment. (j–l) Scatter plots depicting SNP correlations from ebi-a-GCST002783, ieu-a-91, and met-d-S_VLDL_PL_pct with bbj-a-75. The x-axis indicates SNP effects on exposure, while the y-axis reflects their effects on outcomes. Colored lines denote fit lines from various MR algorithms; a positive slope indicates a risk factor, whereas a negative slope indicates a protective factor. A non-zero intercept in the red line (Inverse Variance Weighted method) suggests potential confounding.
Inverse variance weighted Mendelian randomization results for exposure factors and outcomes.
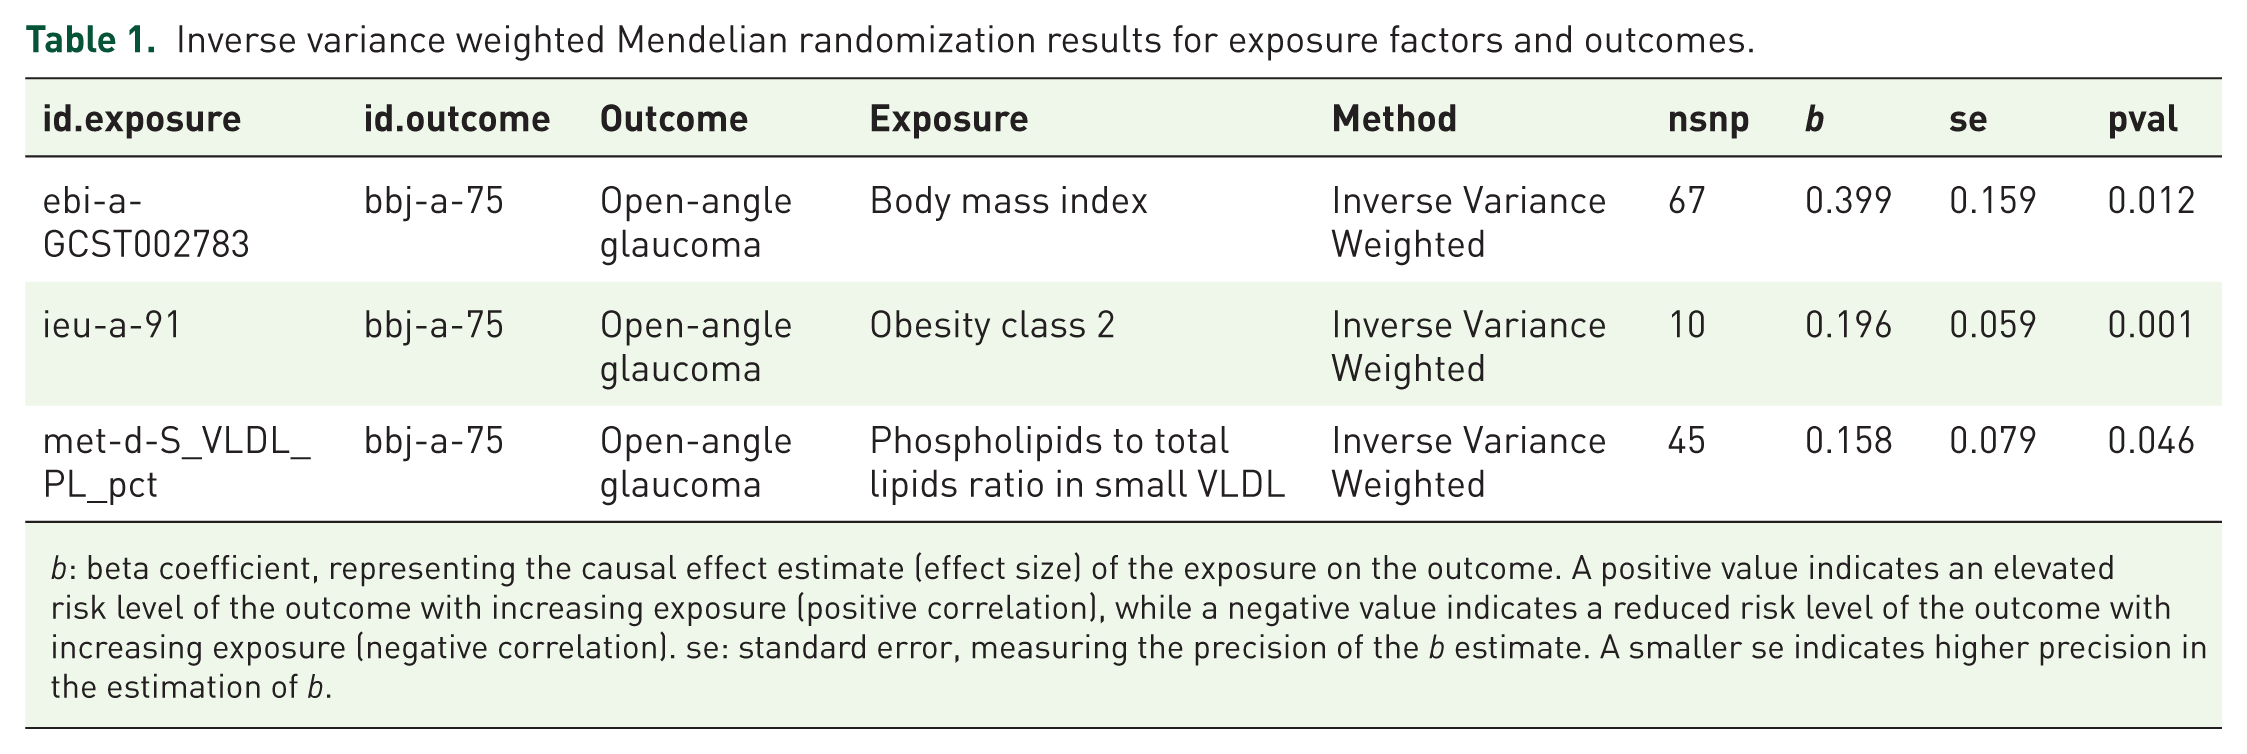
b: beta coefficient, representing the causal effect estimate (effect size) of the exposure on the outcome. A positive value indicates an elevated risk level of the outcome with increasing exposure (positive correlation), while a negative value indicates a reduced risk level of the outcome with increasing exposure (negative correlation). se: standard error, measuring the precision of the b estimate. A smaller se indicates higher precision in the estimation of b.
Horizontal pleiotropy test results for exposure factors and outcomes in Mendelian randomization.

egger_intercept: an intercept near 0 indicates the absence of horizontal pleiotropy. se: standard error, measuring the precision of the egger_intercept estimate. A smaller se indicates higher precision in the estimate of the intercept.
Heterogeneity test results for exposure factors and outcomes in Mendelian randomization.

Q: Cochran’s Q statistic. A larger Q value indicates greater heterogeneity in effect estimates across instrumental variables. Q_df: degrees of freedom for the heterogeneity test, reflecting the number of instrumental variables. Q_pval: p-value of the Q statistic. A Q_pval <0.05 indicates statistically significant heterogeneity.
Screening of acylation modification-related genes affecting POAG
Lipids generate bioactive intermediates like acyl-CoA and short-chain fatty acids, which influence protein acylation modifications. Given the significant alterations in lipid metabolism and carboxylic acid-binding genes in POAG patients’ trabecular meshwork, we compiled 13 acylation modification-related genes, including those involved in 2-hydroxyisobutyrylation, benzoylation, butyrylation, crotonylation, formylation, and others. GSVA scoring on these gene sets revealed that modifications such as succinylation, propionylation, myristoylation, glutarylation, and lactylation were significantly associated with POAG (Figure 3(a)). ROC curve analysis demonstrated excellent diagnostic performance for these five acylation modifications. To identify genes directly related to POAG, we integrated WGCNA analysis. After excluding outliers (Figure 3(c) and (d)), the optimal soft threshold was determined to be 3 (Figure 3(e)), resulting in 22 valid modules and one gray module (Figure 3(f)). Pearson correlation analysis revealed that the MEred module (Supplemental Table 4) had the highest correlation with POAG (|cor| = 0.86, p = 3e-11), with acylation modifications such as succinylation, propionylation, myristoylation, and glutarylation within this module being strongly associated with POAG (Figure 3(g)). Intersection analysis identified 16 candidate genes that exhibited significant expression changes and were influenced by these acylation modifications, marking them as potential POAG-related acylation genes.
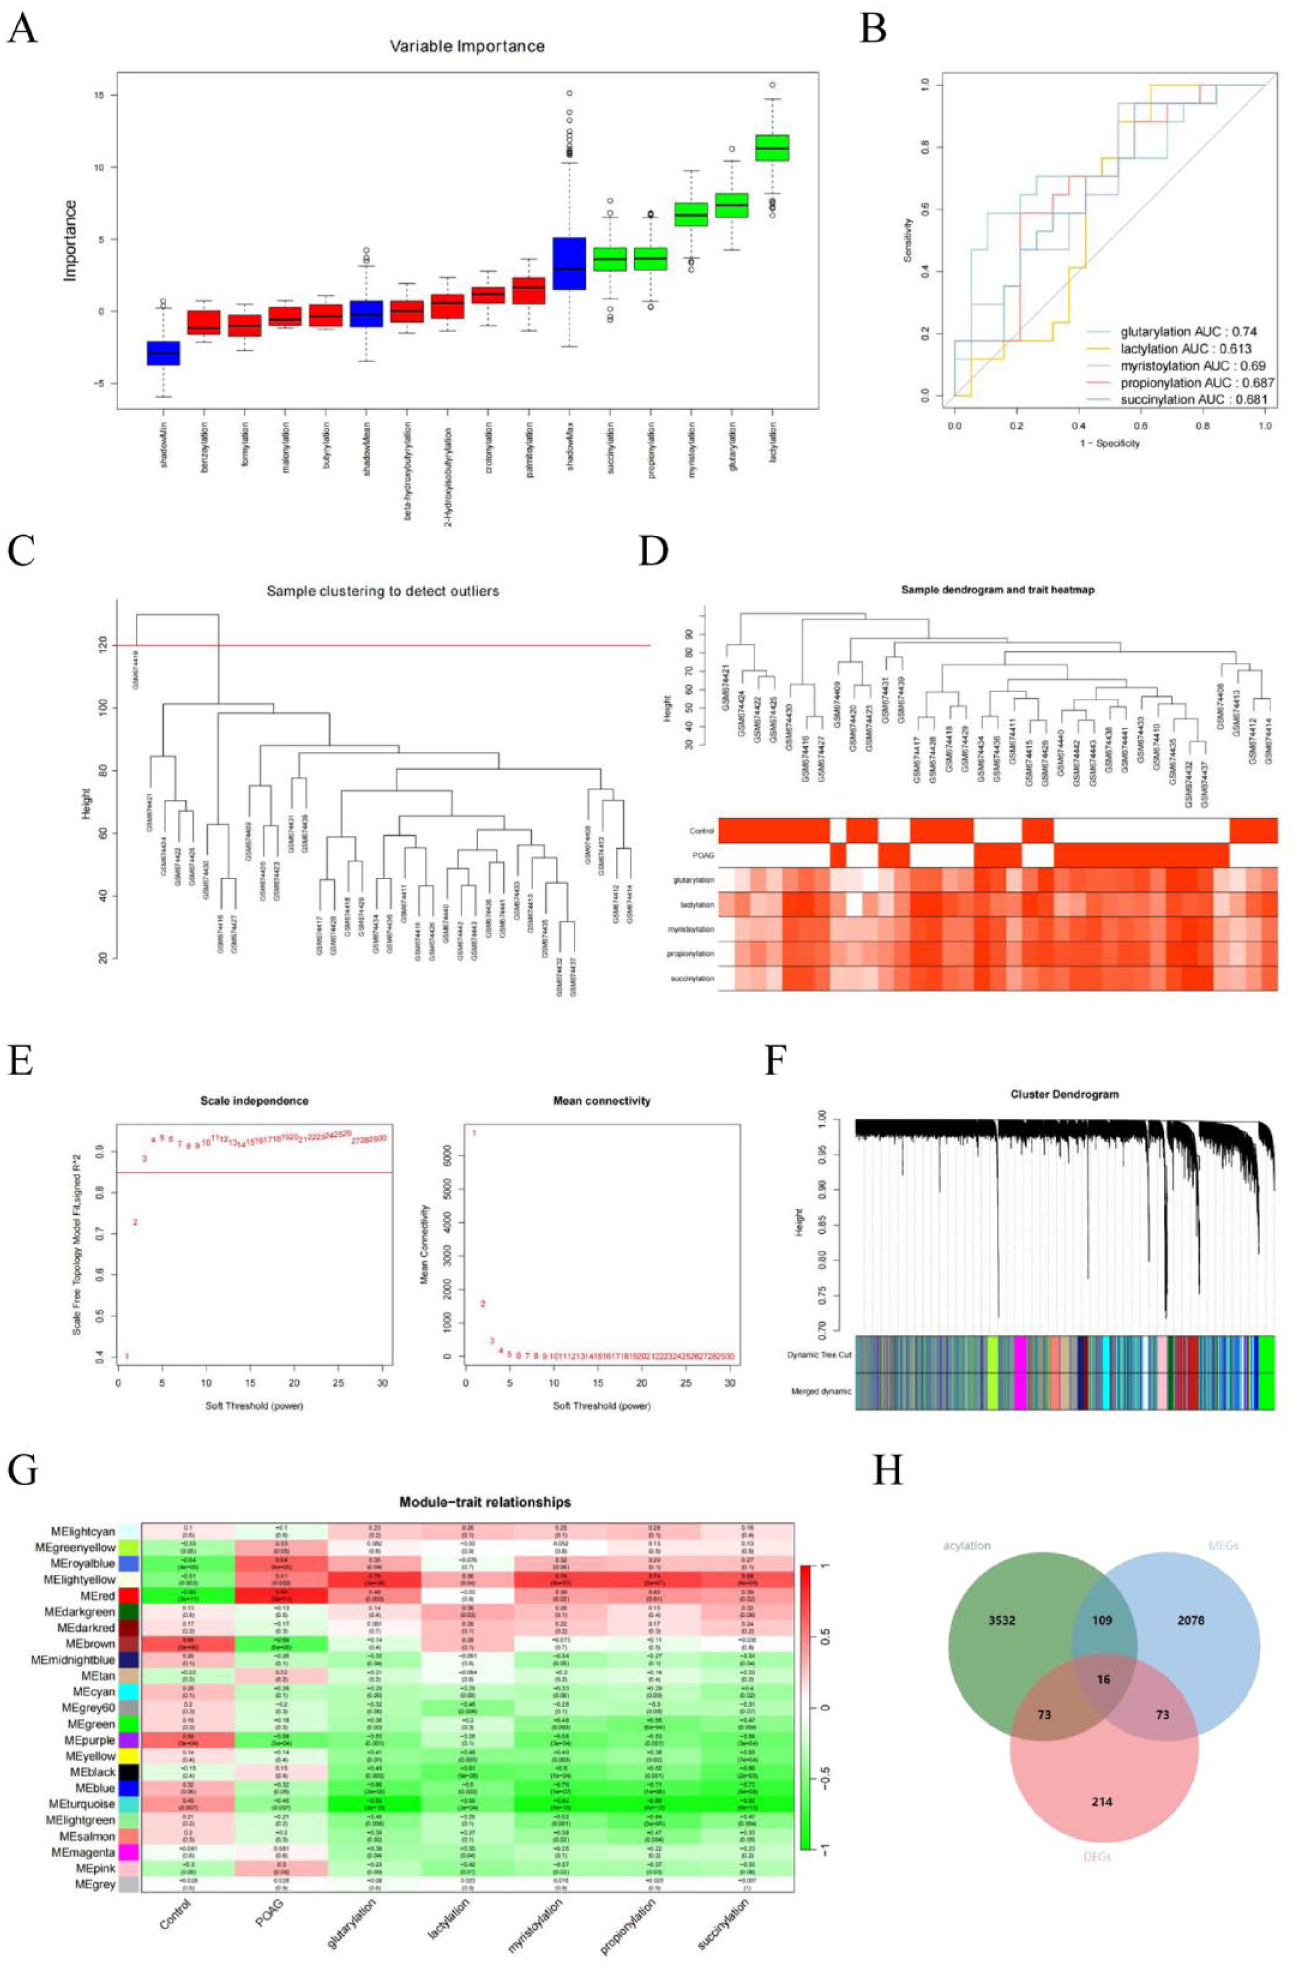
Key acylation modification genes associated with POAG. (a) Importance ranking of acylation modification gene sets based on Boruta analysis. Boxes further to the upper-right indicate a stronger association with the disease status. Red represents rejected scores, green indicates accepted scores, and blue corresponds to the three thresholds in the Boruta analysis. (b) ROC curve for acylation modification scores selected by Boruta. Different colored curves represent the diagnostic performance of each acylation modification score in distinguishing disease status. A larger AUC indicates higher diagnostic performance. (c) WGCNA sample clustering dendrogram. Red lines indicate abnormal samples, which are outliers in the WGCNA clustering. (d) Sample clustering and trait distribution heatmap after removing abnormal samples. The upper panel shows the re-clustered sample dendrogram after outlier removal, and the lower panel illustrates the distribution of traits across different samples. (e) Gene TOM clustering soft threshold distribution scatter plot. The x-axis represents the power parameter, and the left y-axis shows the scale-free fit index (signed R2). A higher R2 value indicates a better fit to a scale-free topology. The right y-axis represents the mean adjacency of genes within corresponding modules. (f) Gene TOM clustering tree at the optimal soft threshold. The upper panel shows the gene TOM clustering tree based on the dynamic tree cutting algorithm, while the lower panel highlights the gene modules identified in the clustering. (g) Heatmap of module-trait correlations. Red squares indicate positive correlations, while green indicates negative correlations. Darker colors represent stronger correlations, with correlation coefficients and corresponding p-values annotated within parentheses. (h) Venn diagram of genes from selected WGCNA modules, differentially expressed genes, and acylation modification-associated genes.
Given the significant alterations in lipid metabolism and carboxylic acid-binding genes in POAG patients’ trabecular meshwork, we compiled 13 acylation modification-related genes, including those involved in 2-hydroxyisobutyrylation, benzoylation, butyrylation, crotonylation, formylation, and others. GSVA scoring on these gene sets revealed that modifications such as succinylation, propionylation, myristoylation, glutarylation, and lactylation were significantly associated with POAG (Figure 3(a)). ROC curve analysis demonstrated excellent diagnostic performance for these five acylation modifications. To identify genes directly related to POAG, we integrated WGCNA analysis. After excluding outliers (Figure 3(c) and (d)), the optimal soft threshold was determined to be 3 (Figure 3(e)), resulting in 22 valid modules and one gray module (Figure 3(f)). Pearson correlation analysis revealed that the MEred module (Supplemental Table 4) had the highest correlation with POAG (|cor| = 0.86, p = 3e-11), with acylation modifications such as succinylation, propionylation, myristoylation, and glutarylation within this module being strongly associated with POAG (Figure 3(g)). Intersection analysis identified 16 candidate genes that exhibited significant expression changes and were influenced by these acylation modifications, marking them as potential POAG-related acylation genes.
Screening of feature acylation modification genes related to POAG
To identify the acylation modification-related genes exhibiting the most significant expression characteristics in POAG, we performed feature gene selection using LASSO-Class and SVM-RFE with 5-fold cross-validation. LASSO-Class selected eight genes (Figure 4(a) and (b)), while SVM-RFE identified five genes (Figure 4(c)). The five common genes selected by both methods demonstrated strong diagnostic potential for distinguishing POAG from normal individuals. ROC curve analysis confirmed the high diagnostic accuracy of these five genes (Figure 4(d)). To assess their universality, expression tests were conducted on both the training and validation datasets. Due to missing HBG2 gene data in the validation set and limited POAG samples, Wilcoxon tests were performed for 5′-aminolevulinate synthase 2 (ALAS2), DEAD-box helicase 17 (DDX17), phospholipase C epsilon 1 (PLCE1), and reelin (RELN) in the training set, and expression trends were examined in the validation set (Figure 4(f) and (g)). Significant differences in expression were observed for these genes in the training set, with consistent expression trends for ALAS2, PLCE1, and RELN in the validation set. These findings identified ALAS2, PLCE1, and RELN as candidate feature acylation modification genes for POAG.

Selection of key acetylation modification genes. (a) LASSO logistic regression penalty residual plot. The x-axis represents log(Lambda), and the y-axis indicates the error rate in LASSO regression. The dashed line on the left denotes the position of minimum cross-validation error, which determines the optimal log(Lambda) value. The number of selected feature genes is displayed above the dashed line. (b) LASSO logistic regression coefficient plot. The x-axis shows log(Lambda), while the y-axis represents the cross-validation error. As the penalty coefficient lambda varies, most variable coefficients shrink to zero. At the optimal lambda (lambda.min = 0.01147868), eight non-zero coefficient variables are selected. (c) Relationship plot between SVM-RFE generalization error and number of features. The x-axis denotes the number of feature genes, and the y-axis depicts the generalization error under 5-fold cross-validation. The line trend illustrates the relationship between the number of feature genes and generalization error, with circles marking the point of minimum SVM-RFE error. (d) Venn diagram of feature genes selected by LASSO-Class and SVM-RFE. (e) ROC curve for intersection feature genes. (f, g) Box plots of intersection feature gene expression in training and validation sets. Due to the validation set containing fewer than three POAG samples, statistical tests were not performed.
Molecular docking analysis of feature acylation modification genes
Acylation modifications influence protein function through binding with small molecules derived from lipid metabolism intermediates. To explore the relationship between feature genes and acylation modifications, we predicted the tertiary structures of ALAS2, PLCE1, and RELN using AlphaFold and performed molecular docking with acylation modification donor molecules from the PubChem database (Figure 5). The results indicated that ALAS2 and PLCE1 exhibited low binding energies with their respective molecules, suggesting strong associations with acylation modifications. However, RELN did not show reliable binding sites (Table 2). Notably, ALAS2 possesses well-defined binding sites for succinyl-CoA and propionyl-CoA, suggesting its potential involvement in diverse acylation modifications. Thus, ALAS2 and PLCE1 may play significant roles in POAG pathogenesis through acylation modifications (Tables 4–7).

Docking of key acetylation modification proteins with acetylation donor molecules. (a) Docking of ALAS2 with succinyl-CoA (C3 overview). (b) Docking of ALAS2 with succinyl-CoA (C3 detail). (c) Docking of ALAS2 with succinyl-CoA (C5 overview). (d) Docking of ALAS2 with succinyl-CoA (C5 detail). (e) Docking of ALAS2 with propionyl-CoA (C3 overview). (f) Docking of ALAS2 with propionyl-CoA (C3 detail). (g) Docking of ALAS2 with propionyl-CoA (C5 overview). (h) Docking of ALAS2 with propionyl-CoA (C5 detail). (i) Docking of PLCE1 with tetradecanoic acid (C3 overview). (j) Docking of PLCE1 with tetradecanoic acid (C3 detail). (k) Docking of PLCE1 with tetradecanoic acid (C4 overview). (l) Docking of PLCE1 with tetradecanoic acid (C4 detail). (m) Docking of PLCE1 with tetradecanoic acid (C2 overview). (n) Docking of PLCE1 with tetradecanoic acid (C2 detail). In these figures, protein structures are colored according to their B-factors. The hydrogen bonds between the ligands (shown in ball-and-stick representation) and the proteins are indicated by dashed lines. The binding sites between the protein and ligand are labeled, with detailed information provided in the Supplemental Table.
Docking results of ALAS2 with succinyl-CoA.

ALAS2, 5′-aminolevulinate synthase 2.
Docking results of ALAS2 with propionyl-CoA.
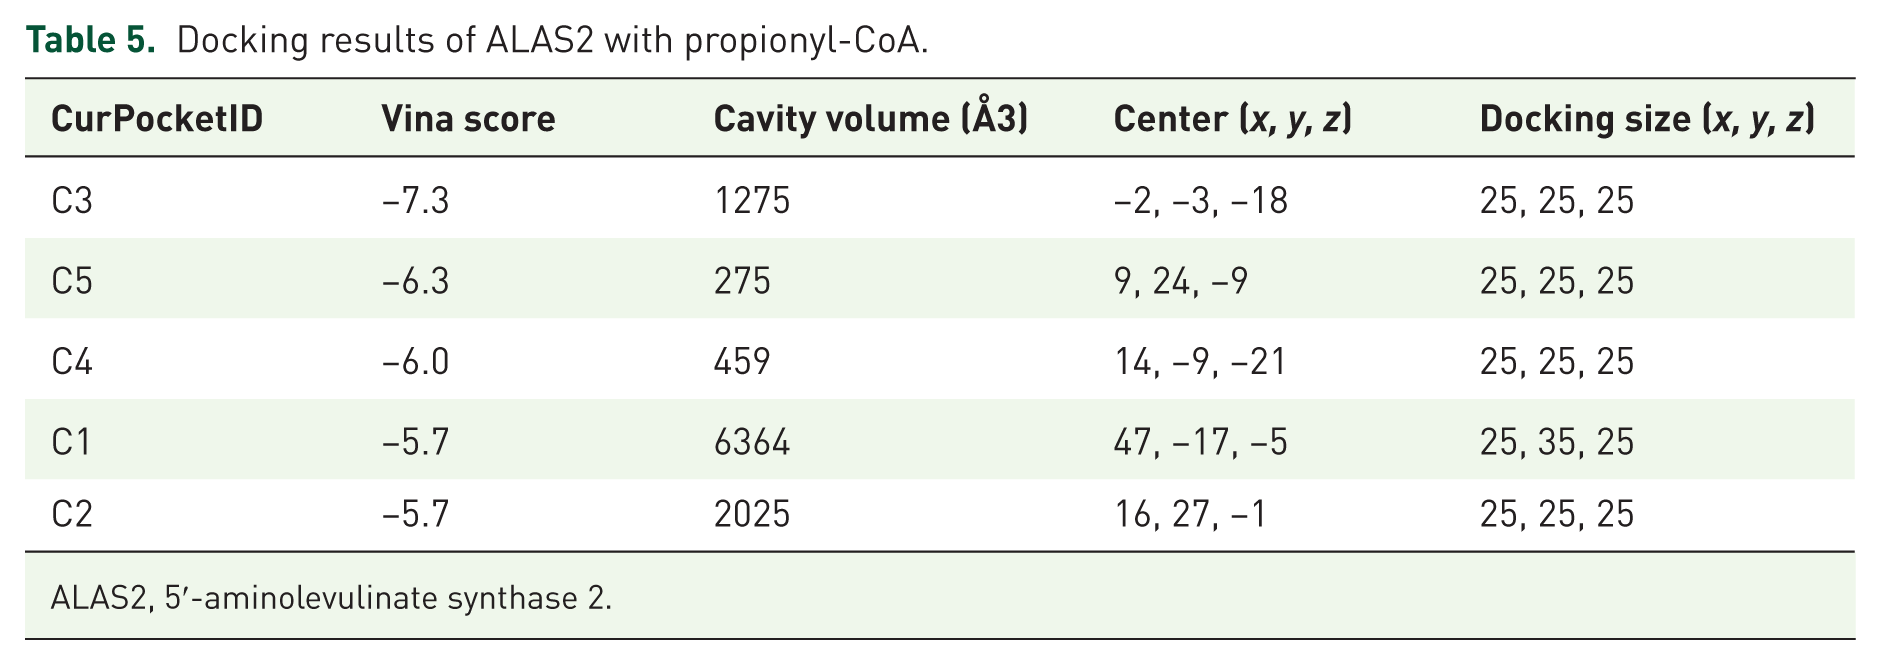
ALAS2, 5′-aminolevulinate synthase 2.
Docking results of PLCE1 with tetradecanoic acid.

PLCE1, phospholipase C epsilon 1.
Docking results of RELN with tetradecanoic acid.

RELN, reelin.
Exploration of potential functions of key acylation modification genes
To investigate the potential roles of ALAS2 and PLCE1 in POAG, GSEA enrichment analysis was conducted on the training set (Supplemental Tables 5–8). The results showed that ALAS2 expression was positively correlated with oxidative-reduction activity, with enriched GO terms related to aerobic electron transport and Adenosine Triphosphate (ATP) synthesis (Figure 6(a)). KEGG pathway analysis highlighted associations with oxidative phosphorylation and neurodegenerative diseases (Figure 6(b)). PLCE1, on the other hand, was linked to tissue fibrosis and keratinization, with GO terms related to collagen-containing ECM and epidermal development (Figure 6(c)). KEGG pathways associated with PLCE1 included muscle cell cytoskeleton and fatty acid metabolism (Figure 6(d)). These functional enrichments support the potential involvement of ALAS2 and PLCE1 in POAG, particularly in oxidation-reduction activity and fibrosis, processes that negatively impact POAG progression.
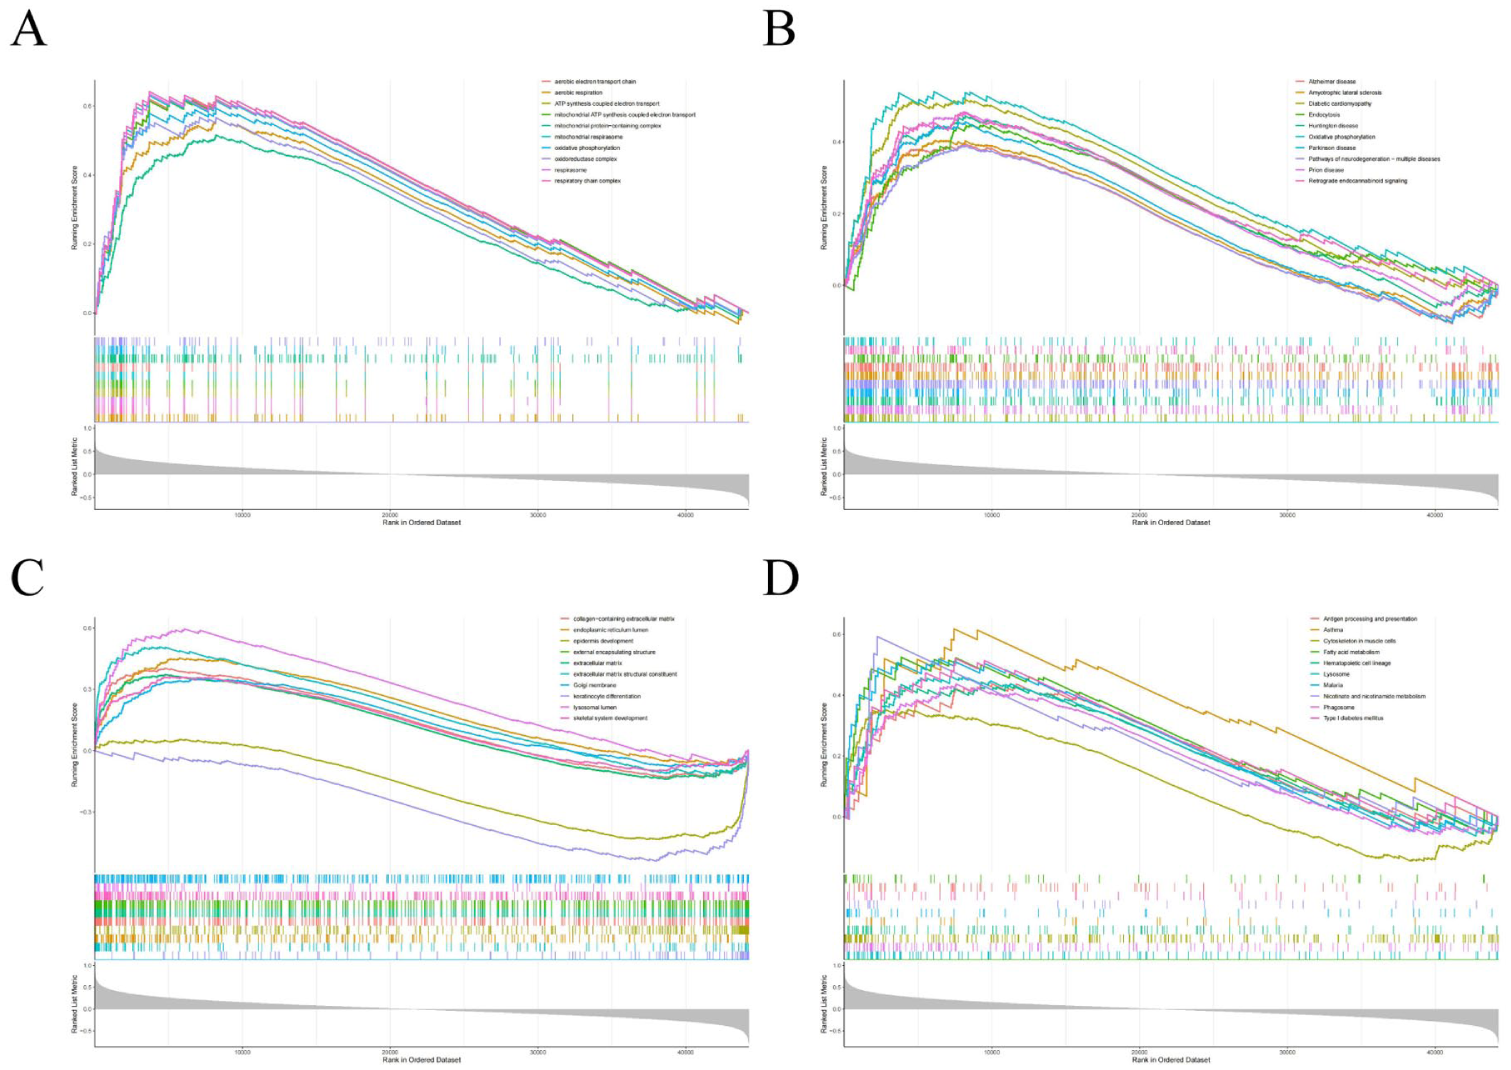
Single-gene GSEA of key acetylation modification genes. (a) ALAS2 single-gene GSEA—GO enrichment curve. (b) ALAS2 single-gene GSEA—KEGG enrichment curve. (c) PLCE1 single-gene GSEA—GO enrichment curve. (d) PLCE1 single-gene GSEA—KEGG enrichment curve. In these plots, the y-axis represents the enrichment score. A positive enrichment score indicates that a particular functional gene set is enriched at the top of the ranked gene list, while a negative enrichment score indicates enrichment at the bottom. The x-axis represents genes, with each vertical line corresponding to an individual gene. The plots display the top 10 significant enrichment results for the key acetylation modification genes.
Single-cell analysis of key genes
Following quality control of the GSE231749 dataset (Supplemental Figure 1), cell populations were annotated based on GO and KEGG enrichment of their characteristic markers, combined with CellMarker2.0 (Supplemental Figures 1 and 7(a)). The results revealed that the key gene PLCE1 was predominantly expressed in TM cells, whereas ALAS2 was not detected in the single-cell data (Figure 7(b)). This suggests that PLCE1 primarily influences Glaucoma progression by modulating TM cell function. Further UMAP clustering of TM cells (Figure 7(c)) and differential gene expression analysis between Glaucoma and Normal groups, as well as between PLCE1-positive and PLCE1-negative cells (Figure 7(d) and (e)), identified 178 genes with consistent upregulation or downregulation patterns (Figure 7(f) and (g)). These findings highlight the heterogeneity between normal and Glaucoma TM cells, with the observed gene expression differences potentially directly linked to PLCE1 expression status. Protein-protein interaction network analysis of these genes and PLCE1 demonstrated an interaction between PLCE1 and collagen type IV alpha 3 chain (COL4A3) (Figure 7(h)). Enrichment analysis indicated that the 178 DEGs were associated with pathways such as: “Regulation of smooth muscle contraction,” “AGE-RAGE signaling pathway in diabetic complications,” “Rap1 signaling pathway.” This suggests their involvement in TM cell adhesion, cytoskeleton dynamics, ECM remodeling, and fibrotic processes. Pseudotime trajectory analysis revealed that PLCE1-positive cells were concentrated at the terminal differentiation stage, overlapping significantly with Glaucoma cell-enriched regions, implicating PLCE1 in TM fibrosis and functional degeneration. Notably, PDGFRA, TGFB2, and LTBP1 were highly expressed in the early differentiation stage, while ACTA2, COL8A2, and FBLN5 exhibited sustained high expression in the late-stage differentiation (Figure 7(d) and (e)). These findings align with the molecular mechanisms proposed in our study: Early-stage genes (PDGFRA, TGFB2, LTBP1) are known to regulate ECM remodeling and fibrotic signaling pathways, consistent with the lipid metabolism-driven fibrotic processes identified in our differential gene and GSEA analyses (Figures 1(c) and (d), 6(c) and (d)). TGFB2 further corroborates the role of TGF-β signaling in TM fibrosis, as highlighted in the Introduction. Late-stage genes (ACTA2, COL8A2, FBLN5) are associated with ECM deposition and smooth muscle contraction, directly linking to the fibrotic and cytoskeletal dysregulation observed in POAG pathogenesis. The interaction between PLCE1 and COL4A3 (Figure 7(h)) further supports this mechanism, as both genes are implicated in ECM stability and TM dysfunction. In summary, single-cell analysis demonstrates that PLCE1 is specifically expressed in Glaucoma TM cells, interacts with COL4A3, and influences fibrotic and other biological processes in TM cells.

Single-cell analysis. (a) Marker gene bubble plot for cell type annotation. Bubble size represents the percentage of cells expressing the marker gene within the cluster; color intensity represents the average expression level of the marker gene within the cluster. (b) Single-cell annotated UMAP plots showing: single-cell clustering distribution; distribution of annotated cell types; expression distribution of the key gene PLCE1 in the Normal versus Glaucoma. (c) TM cell subpopulation UMAP plots showing: TM cell clustering distribution; distribution of cells from different source groups; expression distribution of the key gene PLCE1 in Normal versus Glaucoma TM cells. (d, e) Volcano plots of DEGs. (d) Normal versus Glaucoma TM cells. (e) PLCE1-positive versus PLCE1-negative TM cells. (f, g) Venn diagrams of DEGs from Normal versus Glaucoma and PLCE1-positive versus PLCE1-negative comparisons. (f) Intersection of upregulated genes. (g) Intersection of downregulated genes. (h) PPI network of the intersecting genes. Red nodes represent upregulated genes; blue nodes represent downregulated genes; the yellow node labels PLCE1. (i) Bubble plot of enrichment analysis for the intersecting genes. Bubble color represents enrichment significance (−log10(p-value)); bubble size represents the number of enriched genes. (j) UMAP plot of TM cell pseudotime analysis showing: differentiation pseudotime distribution; cluster subpopulation distribution; sample type distribution; expression distribution of the key gene PLCE1. (k) Expression curves of TM cell fibrosis-related genes along the pseudotime trajectory.
Discussion
POAG is a leading cause of irreversible vision loss globally. 6 Accumulating evidence indicates that systemic metabolic status significantly influences the pathological progression of POAG. For instance, dysregulated cortisol metabolism and the accumulation of high cortisol levels can induce TM fibrosis, ECM deposition, and cytoskeletal reorganization (e.g., formation of cross-linked actin networks), ultimately impairing aqueous humor outflow. 42 Additionally, abnormalities in amino acids such as arginine and glycine may impact neuroprotection and oxidative stress responses in POAG. 43 Among various metabolic pathways, lipid metabolism has recently emerged as a research focus in POAG due to its high oxidative activity.40,44,45
Our differential expression analysis revealed dysregulated genes involved in lipid metabolism and carboxylic acid binding. MR analysis further suggested that lipid levels significantly influence POAG risk. These findings are consistent with previous studies40,46–48 underscoring the role of lipid metabolism in POAG. Current research on lipid metabolism in POAG has primarily focused on lipid oxidation-related pathways, such as cell death,49,50 inflammation,51,52 and signaling.53,54 However, research on acylation modifications in POAG remains limited. In our study, GSVA analysis revealed that multiple acylation modifications significantly impact POAG onset. Notably, WGCNA analysis identified four acylation modifications—succinylation, propionylation, myristoylation, and glutarylation—as strongly associated with POAG. Further screening highlighted ALAS2, PLCE1, and RELN as key genes. Molecular docking indicated that ALAS2 is associated with propionylation and succinylation, while PLCE1 is influenced by myristoylation. Previous studies have validated the interaction between ALAS2 and succinyl-CoA55–57 supporting our findings.
ALAS2 (5′-aminolevulinate synthase 2) catalyzes the decoupling of succinyl-CoA to produce succinyl groups, which are involved in acylation modifications. 58 Given the structural similarity between succinyl-CoA and propionyl-CoA,59,60 ALAS2 may also catalyze the production of propionyl groups from propionyl-CoA. We hypothesized that ALAS2 contributes to POAG pathogenesis by catalyzing the formation of acyl groups from lipid metabolism intermediates, which then modulate protein acylation via succinylation and propionylation. These modifications are emerging as key regulators of multiple intracellular pathways, including fibrosis progression, 61 immune regulation, 62 cell proliferation, 63 and cell death. 64 Our analysis suggests that upregulation of ALAS2 in POAG TM may promote these acylation processes, contributing to disease progression.
PLCE1 (phospholipase C epsilon 1) encodes a phospholipase that catalyzes the hydrolysis of phosphatidylinositol-4,5-bisphosphate to produce inositol 1,4,5-trisphosphate (IP3) and diacylglycerol (DAG), which regulate various biological processes such as cell growth, differentiation, and gene expression. 65 At present, research on PLCE1 has mainly focused on kidney disease, and several studies have shown that this gene is closely related to renal fibrosis.66–68 In addition, PLCE1 has been reported to be one of the potential risk sites for retinal detachment. 69 Our molecular docking analysis suggests that PLCE1 may also be myristoylated through its interaction with tetradecanoic acid, potentially activating its signaling functions. GSEA enrichment analysis indicates that PLCE1 is involved in TM fibrosis, which may impair aqueous humor outflow in POAG patients. 47
Single-cell analysis further revealed that PLCE1 is predominantly expressed in TM cells of glaucoma patients and may influence disease progression via interaction with COL4A3. COL4A3 encodes type IV collagen, a major component of basement membranes. Abnormal deposition of COL4A3 in the cornea, as observed in a prior study, 68 could extend to the anterior chamber angle, interacting with the TM ECM and increasing aqueous humor outflow resistance. Myristoylation of PLCE1 may alter its interaction with COL4A3, promoting ECM fibrosis in the TM and contributing to glaucoma pathogenesis.
Currently, drug research targeting ALAS2 and PLCE1 is relatively limited, particularly FDA-approved medications for these targets are still lacking. Analysis results indicate that targeting these two genes may have potential therapeutic effects for POAG. However, this inference requires further screening and experimental validation.
In summary, our analysis reveals that acylation modifications potentially impact POAG pathogenesis. ALAS2 likely catalyzes acyl-CoA reactions, generating ligands for succinylation and propionylation, thereby modulating protein acylation and influencing the biological processes within the trabecular meshwork in POAG. PLCE1, by undergoing myristoylation, may contribute to trabecular meshwork fibrosis, exacerbating POAG progression.
Conclusion
In summary, our bioinformatic investigation reveals that lipid metabolism-derived acylation modifications—specifically succinylation, propionylation, and myristoylation—are significantly implicated in POAG pathogenesis. The study proposes a novel mechanistic model wherein ALAS2 drives the production of acyl-CoA donors, while myristoylated PLCE1 promotes trabecular meshwork fibrosis via interaction with COL4A3. However, it is crucial to acknowledge that these findings and the proposed model are primarily predictive, derived from integrated multi-omics analyses, and await experimental validation in vitro and in vivo. Future work should focus on empirically confirming these mechanisms, identifying the specific modified protein substrates, and assessing the therapeutic potential of targeting these acylations, thereby translating our computational insights into tangible biological understanding and clinical strategies for POAG.
Supplemental Material
sj-pdf-9-oed-10.1177_25158414251405373 – Supplemental material for Multi-omics analysis unveils the role of lipid metabolism-derived acylation modifications in POAG and its potential implications
Supplemental material, sj-pdf-9-oed-10.1177_25158414251405373 for Multi-omics analysis unveils the role of lipid metabolism-derived acylation modifications in POAG and its potential implications by Sijie Zhao, Che Xu, Qing Dai, Ziqing Gao and Jian Chen in Therapeutic Advances in Ophthalmology
Supplemental Material
sj-xlsx-1-oed-10.1177_25158414251405373 – Supplemental material for Multi-omics analysis unveils the role of lipid metabolism-derived acylation modifications in POAG and its potential implications
Supplemental material, sj-xlsx-1-oed-10.1177_25158414251405373 for Multi-omics analysis unveils the role of lipid metabolism-derived acylation modifications in POAG and its potential implications by Sijie Zhao, Che Xu, Qing Dai, Ziqing Gao and Jian Chen in Therapeutic Advances in Ophthalmology
Supplemental Material
sj-xlsx-2-oed-10.1177_25158414251405373 – Supplemental material for Multi-omics analysis unveils the role of lipid metabolism-derived acylation modifications in POAG and its potential implications
Supplemental material, sj-xlsx-2-oed-10.1177_25158414251405373 for Multi-omics analysis unveils the role of lipid metabolism-derived acylation modifications in POAG and its potential implications by Sijie Zhao, Che Xu, Qing Dai, Ziqing Gao and Jian Chen in Therapeutic Advances in Ophthalmology
Supplemental Material
sj-xlsx-3-oed-10.1177_25158414251405373 – Supplemental material for Multi-omics analysis unveils the role of lipid metabolism-derived acylation modifications in POAG and its potential implications
Supplemental material, sj-xlsx-3-oed-10.1177_25158414251405373 for Multi-omics analysis unveils the role of lipid metabolism-derived acylation modifications in POAG and its potential implications by Sijie Zhao, Che Xu, Qing Dai, Ziqing Gao and Jian Chen in Therapeutic Advances in Ophthalmology
Supplemental Material
sj-xlsx-4-oed-10.1177_25158414251405373 – Supplemental material for Multi-omics analysis unveils the role of lipid metabolism-derived acylation modifications in POAG and its potential implications
Supplemental material, sj-xlsx-4-oed-10.1177_25158414251405373 for Multi-omics analysis unveils the role of lipid metabolism-derived acylation modifications in POAG and its potential implications by Sijie Zhao, Che Xu, Qing Dai, Ziqing Gao and Jian Chen in Therapeutic Advances in Ophthalmology
Supplemental Material
sj-xlsx-5-oed-10.1177_25158414251405373 – Supplemental material for Multi-omics analysis unveils the role of lipid metabolism-derived acylation modifications in POAG and its potential implications
Supplemental material, sj-xlsx-5-oed-10.1177_25158414251405373 for Multi-omics analysis unveils the role of lipid metabolism-derived acylation modifications in POAG and its potential implications by Sijie Zhao, Che Xu, Qing Dai, Ziqing Gao and Jian Chen in Therapeutic Advances in Ophthalmology
Supplemental Material
sj-xlsx-6-oed-10.1177_25158414251405373 – Supplemental material for Multi-omics analysis unveils the role of lipid metabolism-derived acylation modifications in POAG and its potential implications
Supplemental material, sj-xlsx-6-oed-10.1177_25158414251405373 for Multi-omics analysis unveils the role of lipid metabolism-derived acylation modifications in POAG and its potential implications by Sijie Zhao, Che Xu, Qing Dai, Ziqing Gao and Jian Chen in Therapeutic Advances in Ophthalmology
Supplemental Material
sj-xlsx-7-oed-10.1177_25158414251405373 – Supplemental material for Multi-omics analysis unveils the role of lipid metabolism-derived acylation modifications in POAG and its potential implications
Supplemental material, sj-xlsx-7-oed-10.1177_25158414251405373 for Multi-omics analysis unveils the role of lipid metabolism-derived acylation modifications in POAG and its potential implications by Sijie Zhao, Che Xu, Qing Dai, Ziqing Gao and Jian Chen in Therapeutic Advances in Ophthalmology
Supplemental Material
sj-xlsx-8-oed-10.1177_25158414251405373 – Supplemental material for Multi-omics analysis unveils the role of lipid metabolism-derived acylation modifications in POAG and its potential implications
Supplemental material, sj-xlsx-8-oed-10.1177_25158414251405373 for Multi-omics analysis unveils the role of lipid metabolism-derived acylation modifications in POAG and its potential implications by Sijie Zhao, Che Xu, Qing Dai, Ziqing Gao and Jian Chen in Therapeutic Advances in Ophthalmology
Footnotes
Acknowledgements
We extend special gratitude to Mr. Chengye Li from BAIZE Academic for his expert technical support in bioinformatics analysis and algorithm implementation, which was critical to the multi-omics integration in this research.
Declarations
Supplemental material
Supplemental Material for this article is available online.
References
Supplementary Material
Please find the following supplemental material available below.
For Open Access articles published under a Creative Commons License, all supplemental material carries the same license as the article it is associated with.
For non-Open Access articles published, all supplemental material carries a non-exclusive license, and permission requests for re-use of supplemental material or any part of supplemental material shall be sent directly to the copyright owner as specified in the copyright notice associated with the article.