
Abstract
Background:
Glaucoma is an optic neuropathy which causes irreversible vision loss. Standard perimetry, which is essential for glaucoma diagnosis, can only detect glaucomatous visual filed loss when considerable structural damage has occurred. Contrast sensitivity is one of the visual function tests that is reduced in eyes with glaucoma. It is known to be affected in pre-perimetric stages of glaucoma.
Objective:
The objective of this study was to investigate the discriminating ability of central contrast sensitivity perimetry in eyes with and without glaucoma.
Design:
The study employed a cross-sectional study design.
Methods:
The study participants were made of two groups; eyes diagnosed with glaucoma by an ophthalmologist based on visual field test and optical coherence tomography (OCT) and age- and sex-matched controls who were declared free from glaucoma. Static contrast sensitivity (CS) was measured in the central 10° of visual field using a custom psychophysical test.
Results:
There were 45 eyes with glaucoma and 45 age- and sex-matched controls in this study. The static CS in the glaucoma group was significantly reduced in 9 out of the 13 tested locations in the central 10° of the visual field. The mean static CS at 5°, 10°, superior hemifield and inferior hemifield were all significantly reduced in the glaucoma patients compared to the controls.
Conclusion:
Static CS measurement is a sensitive approach that can be utilized to aid in the detection of glaucoma. The use of static CS can be adopted in the development of a cost-effective yet sensitive screening tool for the detection of glaucoma.
Introduction
Glaucoma is a term describing a group of ocular disorders with multi-factorial aetiology united by a clinically characteristic intraocular pressure-associated optic neuropathy that may lead to irreversible blindness. 1 Glaucoma is the second leading cause of blindness globally, after cataracts. However, glaucoma presents a greater public health challenge than cataracts because the blindness it causes is irreversible. Glaucoma as a public health issue is of increasing importance as the global population increases in both age and number.2,3 In 2013, the prevalence of glaucoma worldwide was 3.54% with Africa having the highest prevalence of 4.79%. It was projected that in 2020, 76.0 million people will be affected by glaucoma and this number is set to increase to 111.8 million people in 2040, disproportionately affecting people residing in Africa and Asia. By 2020, an estimated 11.2 million people will be bilaterally blind from glaucoma worldwide. In Ghana, the prevalence of glaucoma from 2006 to 2008 was 6.8%,4 –6 which is higher than the reported sub-Saharan African prevalence.
Individuals with glaucoma are mostly asymptomatic and often diagnosed very late in the disease process. Slowing and preventing the progression of optic neuropathy and vision loss is possible if the disease is detected early and adequate treatment is given. 7 The current tool used to detect visual function loss in glaucoma is the visual field test (VFT). By the time VFT can be used to detect visual field loss, a considerable amount of structural damage would have occurred especially in the macular region. The test pattern most widely used in VFT does not adequately sample the macular region. Only four points fall within the central 8° where over 30% of the retinal ganglion cells (RGC) are found and these four points fall outside the region of highest RGC density as seen with OCT.8 –10
Contrast sensitivity (CS), colour vision and foveal sensitivity are all affected even before any form of visual field defect is detected. 11 And of all these visual functions, CS is the most sensitive method of assessing and quantifying optic nerve damage in glaucoma patients. Visual field loss in glaucoma begins in the periphery, and as such, initial losses of CS will likely be in these regions. Many studies have been conducted in this regard and the results confirm this notion.12,13 Several studies have also shown that central visual function is also affected in the early stages of the disease as opposed to previous traditional knowledge that indicated that peripheral visual function is long affected before central visual function.8,14 –16 This study therefore assessed the discriminative ability of the central 10° of the retina in eyes with and without glaucoma using a custom CS perimeter.
Method
Setting
A cross-sectional design was employed, and it took place in the Laser and Fibre Optics Centre at the Physics Department in the University of Cape Coast. The centre has a dark room which allows for easy and efficient control of the room ambience. Participants were recruited from University of Cape Coast Eye Clinic (UCC-EC) and Bishop Ackon Memorial Christian Eye Centre (BAMCEC). The study period was from April 2022 to December 2022.
Stimuli
The stimuli were vertical 0.5 cpd sinusoidal Gabor patch gratings with a fixed size of 3° of visual angle. The experiment employed static CS testing. The stimuli were generated using the Psychopy library (v3.0) and presented to the participants on a visually flat, single, gamma-corrected 23-inch colour graphic video monitor (Model: TSS-20112096) with a monitor refresh rate of 60 Hz. The stimuli were made of black and white gratings with varying contrast levels from 1% to 100% and were presented on a uniformly grey background. The luminance contrast for the stimuli was specified by the formula: (Lmax–Lmin)/(Lmax+Lmin) with Lmax and Lmin representing the luminance of the white and black bars in the gratings, respectively. A single stimulus was presented at 13 different locations in the central 10° of the visual field as shown in Figure 1. The contrast of the gratings was increased slowly and smoothly by manual operation from 1% and participants were instructed to tap a response button as soon as they could just detect the stimulus. The response button was a smartphone programmed to make a ringing bell sound. At the sound of the bell, the research assistant stopped ramping up the stimulus and then pressed a key to record the contrast level, at which point the bell was rung. This level is automatically recorded into an excel sheet.

Locations of tested points in the static Contrast Sensitivity Perimetry.
The luminance output of the monitor used to present the stimuli was gamma corrected before data collection using established techniques as described by Metha et al. 17 The monitor was calibrated and gamma corrected using a Smart Sensor photometer (Model:AS803) to ensure correct stimuli configuration and display settings as well as avoid unwarranted visual outputs caused by luminance artefacts. 18 The non-linear and linear gamma outputs of the monitor before and after the calibration are shown in Figure 2. After power-on, the monitor required 40 min to reach a stable luminance and as such CS testing began only after this minimum warm up time. Warm up characteristics of the monitor are shown in Figure 3.

Non-linear gamma output and linearized output.

Warm up characteristics of the monitor.
Three measurements were averaged at each of the 13 points to determine the participants’ CS at that point. The average CS recorded at each test location was converted to logCS after the experiment ended and was recorded. False positives were checked on four random occasions by not presenting a stimulus for an extended period. Fixation losses were manually checked by viewing the eye position of the participants on a separate laptop equipped with an external webcam. None of the participants required refractive correction before participating in the experiment. No time limit was imposed although the average time limit for most participants was 5 min for each test. Both tests were performed on a single visit.
Sampling
The minimum sample size of 88 participants (44 participants in each of the two groups) was required for the study. The sample size was determined with G*Power version 3.1.9.7 (Heinrich Heine University Dusseldorf, General psychology and work psychology working group) with an effect size of 0.8 and α = 0.05 (two tailed) for a Mann–Whitney U test.
Participant recruitment
Participants with primary open-angle glaucoma (glaucoma group) as well as controls with healthy eyes (non-glaucoma group) were recruited from the UCC-EC or the Bishop Ackon Memorial Christian Eye Clinic BAMCEC. Participants were recruited into the glaucoma group if they had been previously diagnosed with POAG and were being managed for at least 6 months. A glaucoma diagnosis was based on an intraocular pressure (IOP) > 21 mmHg at the time of diagnosis and a notable glaucoma characteristic of a visual field defect. Participants in the non-glaucoma group were visually healthy with no history of glaucoma and no demonstrable optic nerve head structural damage on OCT and no visual field defect on standard threshold static perimetry (Humphrey visual field test analyser with 30-2 and 10-2 SITA standard). All participants in both groups were 18 years or older.
Participants were excluded from both groups if they had advanced glaucoma or best corrected vision of worse than 0.3 LogMAR and N12 for distance and near visual acuity, respectively. Participants with ocular and/or systemic comorbidities were also excluded.
All participants underwent a comprehensive eye examination, including visual acuity, refraction, slit lamp examination, tonometry, direct ophthalmoscopy, OCT and VFT to help confirm their inclusion in each of the two groups.
Data collection process
Participants were dark adapted for at least 5 min before starting the tests. A test run with only five points was conducted to ensure that the participants fully understood the test and what was required of them. The tests were performed monocularly, preferably the right eye unless it did not meet the inclusion criteria. The head of the participant was stabilized in a headrest which was adjusted such that the eye of the participant was 60 cm away from the monitor and aligned to the centre of the screen. The test was conducted in a dark room. The result of the CSP test was saved automatically in a Microsoft Excel file which was later imported into R for statistical analysis. The research assistant who carried out the test was not involved in recruiting the participants and did not carry out any clinical examinations, neither was he aware of the glaucoma status of the participants.
Data analysis
The data were analysed using R (version 3.6.0, https://www.r-project.org/). Descriptive analyses were performed on the demographic and baseline characteristics such as IOP, retinal nerve fibre layer (RNFL) thickness and mean deviation (MD) of the VFT. Mann–Whitney U test was used to compare the demographics and baseline characteristics between the glaucoma group and the control group. Mann–Whitney U test was used to compare the mean static CS at the various tested locations between the glaucoma group and the control group. Statistical significance was drawn at p-value less than 0.05 (two tailed).
Results
There were an equal number of persons with POAG (n = 45) and control (N = 45) in the study. The gender distribution of male and female within each group was 49% and 51%, respectively. There was no statistically significant difference between the ages of persons with POAG (41.44 ± 18.20 years) and normal (40.49 ± 15.02 years). All measured clinical parameters (IOP, ARNFL thickness and MD) were found to have means that were significantly different between the two groups as shown in Table 1.
Demographic and baseline characteristics of the study population.

The means of the CS values at all 13 points which were tested in eyes with and without glaucoma are reported in Table 2. All test locations showed that the mean CS scores for the controls were higher than the eyes with glaucoma. Approximately 69% of the tested point of the controls had mean scores that were significantly higher than the glaucoma group.
Comparison of static CS between glaucoma eyes and controls among the 13 test points evaluated with the contrast sensitivity perimeter (Mann–Whitney U test).

CS, contrast sensitivity.
p-value is less than 0.05.
5° versus 10° of visual field
Four points were tested in the central 5° of the visual field and eight points were tested in the 10° visual field. The CS at 5° and 10° were compared among the glaucoma group and the controls. A Mann–Whitney U test showed that there was a no significant difference (W = 799, p = 0.0856) in mean CS between the control group (0.86 ± 0.37) and the glaucoma group (0.73 ± 0.39) within the central 5°. However, the mean CS of test points at 10° showed a significantly lower CS (W = 693, p = 0.0102) among the control group (0.77 ± 0.33) compared to the glaucoma group (0.58 ± 0.35).
Superior hemifield versus inferior hemifield
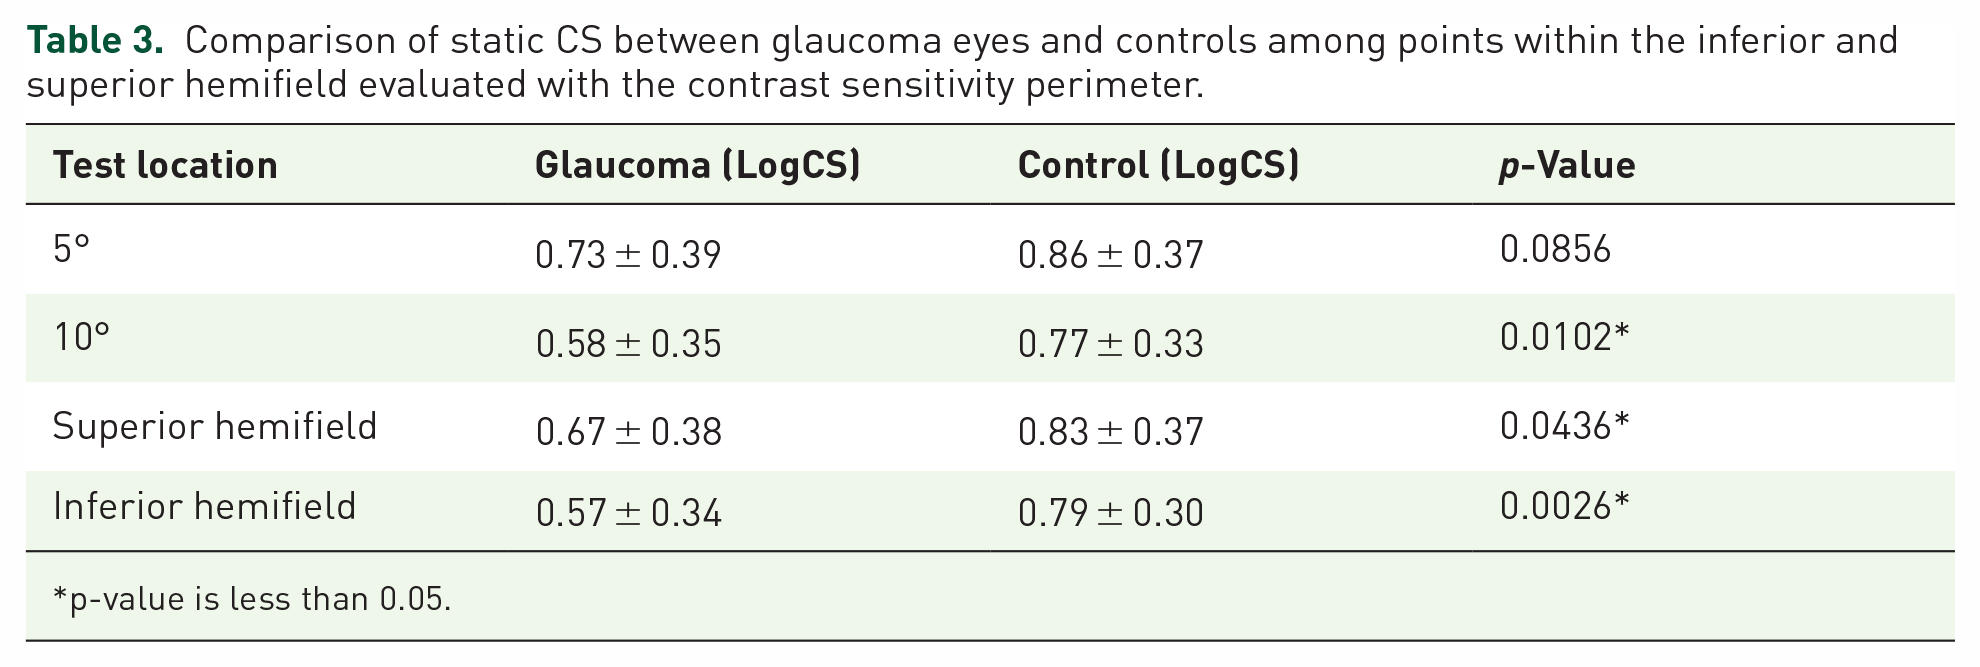
A total of five points were tested in each of the hemifields (i.e. five points in the superior hemifield and five points in the inferior hemifield). The mean CS in the superior and inferior hemifield in the glaucoma group was also compared to that of the controls in Table 3. A Mann–Whitney U test showed that the mean CS in the superior hemifield was significantly higher (W = 762, p = 0.0436) in the control group (0.83 LogCS ± 0.37) than in the glaucoma group (0.67LogCS ± 0.38). Likewise, the mean CS in the inferior hemifield was significantly higher (W = 590.5, p = 0.0026) in the control group (0.79 LogCS ± 0.30) than in the glaucoma group (LogCS 0.57 ± 0.34).
Comparison of static CS between glaucoma eyes and controls among points within the inferior and superior hemifield evaluated with the contrast sensitivity perimeter.
p-value is less than 0.05.
Overall mean CS
The CS of all the 13 tested points were averaged and compared between the two groups as shown in Figure 4. Mann–Whitney U test showed a significant difference in the overall mean CS in the glaucoma group (0.64 ± 0.35) compared to the control group (0.80 ± 0.34), W = 723, p = 0.0197.

Comparison of overall mean static CS between glaucoma patients and controls.
Discussion
This study aimed to determine if CS could be used to detect glaucoma within central 10° of the visual filed. The results indicated that CS was reduced in participants with glaucoma.
Static CS perimetry has been used extensively in many studies12,19 –21 but most of these studies focused primarily on the peripheral visual field. Only a few of such studies incorporated the central visual field 22 , and even that, relatively fewer points in the central 10° were tested. However, in this study, the central 10° was solely investigated.
Studies using static gratings have all reported that there is a reduction in the CS in glaucoma patients compared to controls. Falcão-Reis et al., found in their study that CS was significantly reduced in patients with glaucoma, but this was only true for the peripheral retina. Two of the eight glaucoma participants in their study showed a remarkable reduction of CS in the central 0° which was the only central point test. 12 They explained that the lack of detecting CS reduction in the central retina in their study was probably because they set the upper limit for normal CS too high. They recommended that to improve the discriminating power of the test, the peripheral and central retina should be tested separately. This study focused on testing the central retina by testing more points in the central 10° (13 points) as compared to only one point in the study by Falcão-Reis et al. And unlike the results obtained in the central CS in the study by Falcão-Reis et al., there was a significant reduction in the CS in the glaucoma participant even at 0° of fixation. Lundh and Lennerstrand tested 3 points; fixation point (0°), 10° above fixation and 10° below fixation. 13 Unlike Falcão-Reis et al., they reported a reduction in CS in the glaucoma group in all three locations including the 0° point that was reported by Falcão-Reis et al., to be unaffected in their study.12,13
All the 13 points in the central 10° measured in this study were averaged to obtain a single CS value to represent the overall CS at the central 10° of vision. This is quite different from all the other studies. A single value makes it very easy to compare loss in CS due to glaucoma. The overall CS at 10° was significantly higher in the controls as compared to the glaucoma group. More research needs to be done in this regard to establish a single CS value not only for the central 10° but also for the entire visual field. When a single value is established as the threshold value, one can easily suspect glaucoma if the overall CS value falls below this threshold value.
Altogether, the development of this CSP has shown an exciting promise to the development of a very sensitive and cost-effective screening tool for the detection of glaucoma. More research can be done to include more participants to increase the sensitivity of this test and even help to detect early glaucoma before any damage to visual function is detected. Results from this study and other previous studies 23 show that a comprehensive and very sensitive test that includes both central and peripheral testing using CSP can be developed to not only screen for glaucoma but also to make a definite diagnosis of glaucoma. The Spaeth/Richman contrast sensitivity test (SPARCS) 23 assesses almost 30°of the visual field. However, focusing on the central visual field provides the additional advantage of deploying the CSP on smaller screens, such as smartphones.
Aside from estimating the CS for the various tested points, this study went further to computer a single CS value for each of the following: 5° of the visual field, 10° of the visual field, inferior hemifield, superior hemifield and the full area of the 10° of the visual field. All of these calculations were done by simply averaging the individual measurements that fall in a particular category. This makes it easier to detect where greater damage is occurring. A single-value threshold can be presented below which glaucoma can be suspected. A pattern can also be developed from this to show how glaucoma affects CS in the various areas of the visual field. This can be extended to study the pattern of damage of many other diseases such as age-related macular degeneration and diabetic retinopathy and subsequently detect and diagnose such diseases using CSP.
A major limitation of this study was the lack of staging of glaucomatous damage in the eyes used. However, it must be noted that patients with end stage glaucoma were excluded from the study.
Conclusion
Static CS was lower among eyes with glaucoma compared to their age-matched normal within 10° of the central visual field. Significant differences in CS were detected beyond the 5° of the central visual field. All points in the temporal and inferior 10° of the visual field showed significant depression. Static CS measurement can be utilized to aid in the early detection of glaucoma. The use of static CS can also be adopted in the development of a cost-effective yet sensitive screening tool for the detection of glaucoma.
Footnotes
Acknowledgements
The authors acknowledge the support of the Directorate of Research, Innovation and consultancy of the University of Cape Coast in conducting this study. The management of the Department of Optometry and Vision Science eye clinic and the Bishop Ackon Memorial Christian Eye Clinic.