
Abstract
Background:
Deterioration in peripheral contrast sensitivity (CS) can be an indicator to detect progressive deterioration of visual function in patients with idiopathic intracranial hypertension (IIH).
Objectives:
The aim of this study was to evaluate the changes in central and peripheral CS and optical coherence tomography (OCT) parameters and in patients with IIH.
Design and Methods:
In this pilot observational study, data of 20 eyes of 10 ‘treatment-naïve’ IIH patients were analyzed. Detailed ocular examination was performed including CS assessment using both Pelli–Robson (PR) test and Spaeth–Richman Contrast Sensitivity Test (SPARCS) along with the OCT for macular and optic nerve head (ONH) parameters. A comparative analysis was done for CS and OCT parameters from baseline to a follow-up visit > 12 months (range: 18–24 months).
Results:
The study population had a female preponderance (80%, n = 8), and mean age at diagnosis was 31.9 ± 10.3 years. Mean follow-up period was 21.2 months (range: 15–24 months). At presentation, 6/6 visual acuity was noted in 75% eyes (n = 15) while all eyes had 6/6 vision at the last follow-up. Average PR score increased from 1.96 ± 0.36 to 2.30 at the last visit (Wilcoxon test: V = 0.0, p ⩽ 0.001) while average SPARCS score (total) increased from 71.85 ± 9.10 to 77.55 ± 6.20 (Paired t-test: t = −2.3, p = 0.035). Change in SPARCS score was significant in average total score (p = 0.035), and quadrant-wise score in superonasal (p = 0.014), inferonasal (p = 0.001), and inferotemporal (p = 0.021) quadrants. Same trend in SPARCS scores was observed when eyes with and without recurrence were analyzed. Statistically significant difference in retinal nerve fiber layer (RNFL) thickness (p = 0.007) and macular thickness (MT) in nasal quadrant (p = 0.006) was seen between the eyes with recurrence and without recurrence.
Conclusion:
Peripheral CS showed significant difference in all eyes over time. It showed significant change in eyes with recurrence, even in the presence of intact visual acuity and preserved central CS. Changes in RNFL thickness and nasal MT could differentiate eyes which developed recurrence from normal eyes.
Keywords
Introduction
High intracranial pressure (ICP) can be a consequence of a variety of pathologies, out of which idiopathic intracranial hypertension (IIH) is a unique and relatively uncommon [IIH is included in the rare disease database of National Organization for Rare Disorders (NORD)]. The incidence of IIH is quite low; recent studies putting the number at 1.8 per 100,000 individuals. 1 Although, IIH is a disorder of neural origin, its effects are most prominently noted in the eye. Papilledema characterized by the optic disk swelling secondary to elevated ICP occurs due to impaired axoplasmic flow in the optic nerve head (ONH). 2 It is now recognized that a delay in establishing diagnosis and treatment initiation can cause irreversible loss of vision in these patients. 3
While Snellen visual acuity (VA) measurement gives an idea about the gross visual status, it may not pick up subtle changes in the visual function. Contrast sensitivity (CS) testing may highlight subtle dysfunction of the visual system by assessing spatial vision loss. Loss of CS with preserved Snellen VA has been observed in glaucoma, 4 another pathology with optic nerve dysfunction. Loss of central and peripheral CS in IIH has already been established by a previous study of ours. 5
Modified Frisen criteria is the most commonly used scale clinically to grade the severity of IIH. However, inter- and intraobserver variability has been reported owing to the subjective assessment. 6 As a result, quantitative methods are gaining popularity to predict the prognosis of IIH. One such method is optical coherence tomography (OCT) which is a simple, sensitive and non-invasive tool that can precisely and objectively quantify the retinal nerve fiber layer (RNFL), peripapillary retina, and the macular area. OCT can accurately pick the increased RNFL thickness and cup volume in acute stages and thinning of RNFL thickness in chronic stages. 7 The macular region comprises 50% of retinal ganglion cells (RGCs) and hence changes in macular parameters are used as an indicator of structural loss in many ocular pathologies. Athappilly et al. 8 have shown that ganglion cell complex (GCC) analysis can serve as a potential indicator of neuronal loss in IIH.
The current study aims to look at the long-term changes occurring in both central and peripheral CS and OCT parameters in IIH. As IIH has a relapsing and recurring course of disease, we also look at how these functional and structural tests behave in patients with recurrence.
Materials and methods
This pilot study prospectively enrolled and studied 20 eyes of 10 treatment-naive IIH patients, presenting to the Neurology/Ophthalmology services of Government Medical College and Hospital in Chandigarh, India.
Patients of either gender, above 18 years of age, meeting the modified Dandy criteria 9 were enrolled, after ruling out concurrent ocular pathologies. Modified Dandy criteria include an alert and awake patient, with the signs of high ICP, absence of localizing signs, no intracranial abnormalities on magnetic resonance imaging (MRI)/computed tomography (CT) and with opening pressures on lumbar puncture (LP) exceeding 25 cm H2O.
Written informed consent was obtained from all the patients before LP. LP was performed under aseptic conditions by an anesthesiologist in lateral decubitus position, and post-procedure patient was kept under observation in the post-operative ward.
Contrast-enhanced MRI scans (Using Philips ACHIEVA, 1.5 Tesla) were done along with MR venography and post-contrast T1, post-contrast FLAIR, T2 STAR Perfusion, and T2 Sag scans for every patient, followed by LP to establish the diagnosis of raised ICP. A regimen of tablet Acetazolamide 750–1000 mg in daily divided dose (TID/QID) was started, followed by tapering as per response to therapy. Tablet Topiramate was started in a dose of 25–50 mg daily after neurologist’s opinion in patients who could not tolerate Acetazolamide or showed deterioration.
Body mass index (BMI; weight in kilograms/square of height in meters) was calculated for all enrolled subjects. Weight loss and sodium-restricted diet were advised to obese patients, after consultation with institutional dietary department.
Detailed neurological and ophthalmological examinations were done by a trained neurologist and ophthalmologist, respectively. Ophthalmological examination included Snellen VA testing, meticulous slit lamp examination, intraocular pressure (IOP) measurement with a calibrated applanation tonometry, and fundus examination with + 90D lens. Modified Frisen grading 6 was used to grade papilledema. Pseudoisochromatic ishihara’s chart with 38 plates was used for testing color vision.
CS evaluation was done using Pelli–Robson (PR) chart and Internet-based, Spaeth–Richman Contrast Sensitivity Test (SPARCS) test. PR and SPARCS were done by different individuals and the results were masked; patient identity data were coded and then analyzed by a masked statistician.
Spectral domain OCT (Cirrus 500, Carl Zeiss Inc.) was used for evaluating ONH and macular parameters.
Visual field testing was performed by 24-2 protocol SITA FAST protocol on the Humphrey perimeter HVF 750 II (Zeiss Meditec, Dublin, CA). Headache Impact Scale (HIT-6) questionnaire 10 was used to grade the severity of headache. HIT-6 scores patients in a range of 36–78 based on six questions related to headache in the past 1-month period of symptoms.
CS testing
PR test
PR chart has large Sloan letters that occupy approximately one cycle per degree of vision. Testing is performed at 1 m and letters are arranged in triplets, with decrease in contrast by 0.15 logs units for each triplet. The contrast tested ranges from 100% to 0.56% (log CS 0.00–2.25). Patients are given a score for a contrast level if they have answered two of the three letters in a triplet correctly. The letter-by-letter scoring system is used, whereby each letter correctly identified is scored as 0.05 log units. Test ends when the patient misses two of the three letters in a triplet.
We used LED light with 22 color temperature, 6500K, and lumens of 1900Lm without daylight to minimize glare (the light level in the room was measured using a luxmeter application on smartphone).
SPARCS
It is an online test, which can be accessed at https://www.sparcscontrastcenter.com. A standard computer screen with resolution of 1024 × 768, gray levels of 256 and dimensions 22 × 26.5 cm2 is used. For performing this test, the patient sits at a distance of 50 cm from the display, so that the test screen involves 30° horizontal vision and 23.5° vertical vision. The test includes five areas: four peripheral areas of testing and one central area. The subject fixates his eye on the central test area, thus subtending angle of 5° in horizontal meridian and 3.5° in the vertical meridian. Gratings become visible randomly in any of the five testing areas and the subject must identify and click on the testing area in which the grating appeared. Gratings remain visible only 300 ms and have a spatial frequency of 0.4 cycles per degree. Fixation is broken temporarily to click on the testing area with grating and then the subject re-fixates on the central square to prepare for the next grating. SPARCS system considers the correct and incorrect responses to decide the contrast threshold. Quadrant-wise score [supertemporal (ST), superonasal (SN), inferotemporal (IT), inferonasal (IN), and central (CC)] and total score are shown at the end, 100 being the maximum possible score (score of 20 per testing area). Odds of guesswork are low as gratings have a random pattern of appearance and the subject has five choices to choose from. The test does not incorporate Latin letters, which might be memorized by the patients; therefore, SPARCS is likely to have better test–retest reliability and can be used even for illiterate patients.
We performed CS testing monocularly for each eye, both for PR and SPARCS. For patients who had difficulty in understanding, a mock SPARCS test was also done. The assessor remained in the room and observed the patient when they were undertaking the SPARCS test. The participant was given a break of 5–15 min after the practice test.
Testing was conducted in a room with fluorescent lighting and no windows to minimize glare and reflections. The light level in the room was measured using a luxmeter application on smartphone and was in the range of 750–780 lux.
OCT scan
RNFL thickness was measured using the optic disk 200 × 200 scan to obtain a cube with a side of 6 mm, with the patient fixating on an internal machine target. Every scan captured a cube with dimensions of 6 × 6 × 2 mm3 composed of 200 linear B-scans in an interval of around 1.5 s (27,000 A-scans/s). Macular cube 200 × 200 protocol was performed to determine the macular thickness (MT). Macular GCC thickness [ganglion cell layer plus inner plexiform layer (GC-IPL)] was also recorded.
Spectral domain OCT imaging was performed by a trained technician. Best of three OCT scans with no or least segmentation errors was chosen. A scan was deemed acceptable only if posterior segment visualization was adequate to observe the optic disk and scan spokes, centration was proper onto the optic disk/macula and signal strength of scan was better than 6. Enhanced depth imaging (EDI-OCT) was performed to visualize the choroidal details if choroidal folds were observed clinically.
Changes in all functional and structural parameters were studied from baseline to the latest follow-up visit (which was > 12 months since first visit). Recurrence of IIH was defined as re-appearance of disk edema of any grade in eyes which had achieved complete resolution of disk edema at any stage during the study period.
Data were coded and recorded in MS Excel spreadsheet program, and SPSS v23 (IBM Corp.) was used for data analysis. Group comparisons for continuously distributed data were made using independent sample ‘t’ test when comparing two groups. If data were found to be non-normally distributed, appropriate non-parametric tests in the form of Wilcoxon test/Kruskal–Wallis test were used for these comparisons. Chi-square test was used for group comparisons for categorical data. Statistical significance was kept at p < 0.05.
Results
Demographic data
Data of 20 eyes of 10 treatment-naïve IIH patients, who met the inclusion criteria, were analyzed. Majority of participants were females (80%, n = 8). The average age of presentation was 31.9 ± 10.3 years overall, while it was 31.8 ± 9 for females and 32 ± 19.7 years for males. The average BMI at baseline was 28 ± 3.8 kg/m2 (obese category according to WHO criteria for Asians), while gender-wise distribution was 29.5 ± 2.1 kg/m2 in females and 22 ± 2.5 kg/m2 (normal range of BMI according to WHO criteria) in males. The average BMI at current visit had reduced to 27.1 ± 2.8, the change being statistically non-significant. The mean HIT-6 score at baseline was 57.2 (substantial impact), which reduced to 48.4 (little or no impact) at the present follow-up (p < 0.05). The mean follow-up period was 21.2 months, ranging from a minimum of 15 months to a maximum of 24 months. The mean (±SD) cerebrospinal fluid (CSF) opening pressure for all cases was 32.4 ± 10.7 cm H2O.
Visual examination
At baseline, 15 eyes (75%) had Snellen VA 6/6, 3 eyes (15%) had 6/9, 1 eye (5%) had 6/18 while VA in 1 eye (5%) was 6/36. At the last follow-up visit, all eyes had a VA of 6/6 on Snellen chart. Color vision was normal in all eyes at baseline and at all follow-up visits. Fundus examination at baseline revealed Grade 5 disk edema in two eyes (10%), Grade 4 disk edema in two eyes (10%), Grade 3 disk edema in two eyes (10%), Grade 2 disk edema in nine eyes (45%), Grade 1 disk edema in four eyes (20%), and one eye (5%) did not have disk edema. All patients had symmetric disk edema bilaterally except for two patients (20%).
At the last follow-up, 12 eyes (60%) eyes showed no disk edema while 6 eyes (30%) had Grade 1 disk edema and 2 eyes (10%) had Grade 2 disk edema. Recurrence was noted in five eyes (25%) during the study period. Progression of disk edema was noted in one patient (both eyes showed progression); this patient was lost to follow-up for 1 year and discontinued medication on his own. The overall change in Modified Frisen Grade from baseline to current follow-up was statistically significant (Stuart–Maxwell test: χ2 = 15.000, p = 0.010). Figure 1 illustrates disk edema grade (Modified Frisen) at the two visits.

Modified Frisen grade of disk edema at baseline and current follow-up visits.
Contrast sensitivity
PR chart showed the highest score possible (2.30) in all eyes at last follow-up visit, even in eyes with recurrence compared to contrast deficits being detected in 14 eyes (70%) at initial visit. The average PR score increased from 1.96 ± 0.36 at first visit to 2.30 at current visit, the change over time being statistically significant (Wilcoxon test: V = 0.0, p ⩽ 0.001).
At the initial visit, CS testing using SPARCS revealed average total score of 71.85 ± 9.10, while average scores quadrant-wise were 16.17 ± 2.46 (ST), 15.41 ± 2.06 (SN), 14.35 ± 2.43 (CC), 12.97 ± 1.91 (IT), and 13.03 ± 2.48 (IN). The mean scores at the last follow-up were 77.55 ± 6.20 (SPARCS total), 15.96 ± 1.68 (ST), 16.66 ± 1.52 (SN), 14.26 ± 1.64 (CC), 15.03 ± 3.29 (IT), and 15.61 ± 1.23 (IN). A statistically significant change was noted from baseline in average total SPARCS score (Paired t-test: t = −2.3, p = 0.035), SN quadrant (Wilcoxon test: V = 20.5, p = 0.014), IT quadrant (Wilcoxon test: V = 37.0, p = 0.021), and IN quadrant (Wilcoxon test: V = 8.0, p = 0.001). The average PR and SPARCS scores and change over time have been elucidated in Table 1.
Comparison of SPARCS scores at initial visit and current follow-up visits.

CC, central; CS, contrast sensitivity; IN, inferonasal; IT, inferotemporal; PR, Pelli–Robson; SN, superonasal; SPARCS, Spaeth–Richman Contrast Sensitivity Test; ST, supertemporal.
Average SPARCS scores of eyes with higher grades of papilledema (Grade 3/4/5) were separately analyzed (Table 2). A statistically significant difference was noted in total score (paired t-test, p = 0.036), SN (Wilcoxon test, p = 0.036), and IN (Wilcoxon test, p = 0.036) quadrants.
SPARCS in eyes with higher grades of disk edema (Grade 3/4/5), n = 6.
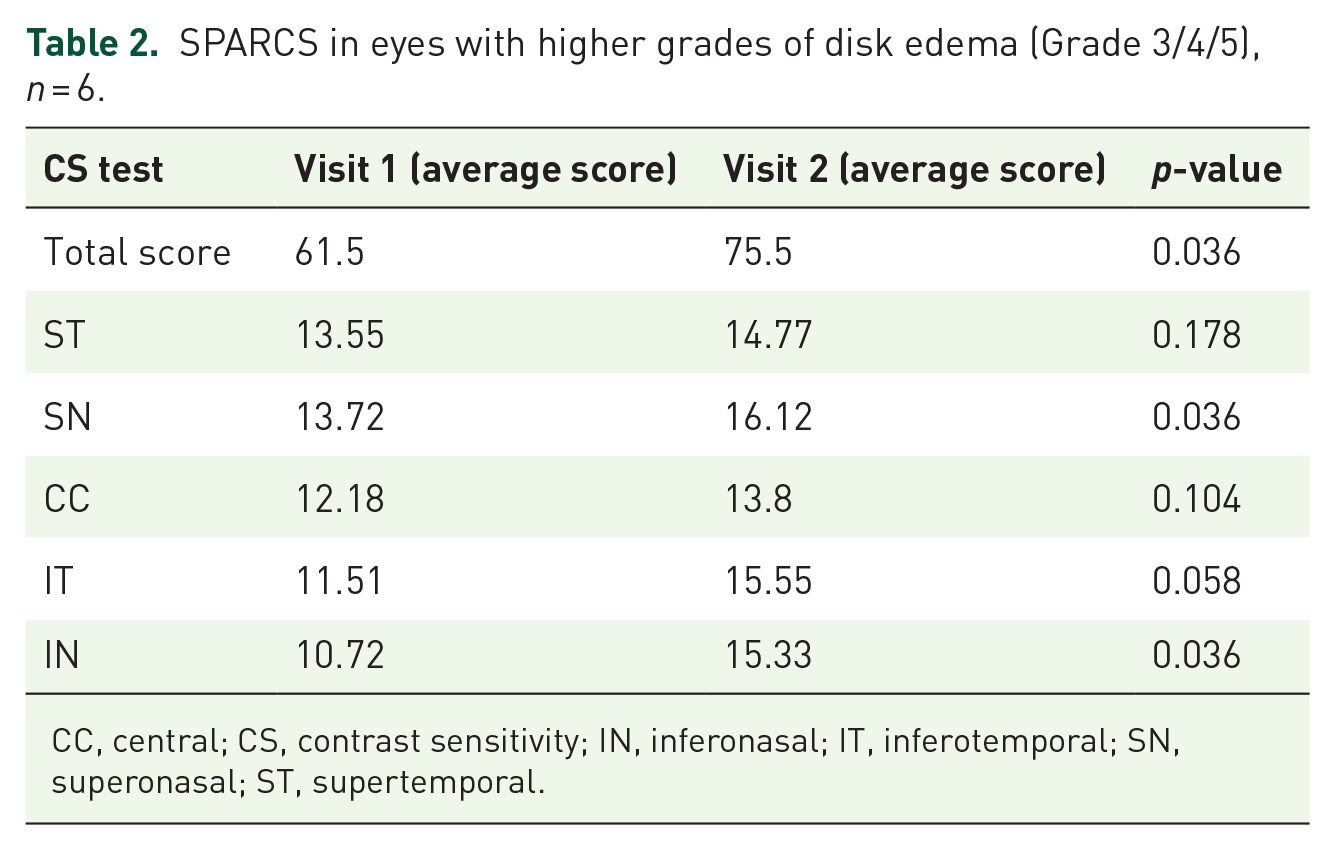
CC, central; CS, contrast sensitivity; IN, inferonasal; IT, inferotemporal; SN, superonasal; ST, supertemporal.
CS scores were compared in eyes with recurrence to those which did not have recurrence. The overall change in PR CS score over time was compared in the two groups using the Generalized Estimating Equations method. There was no significant difference in the trend of PR CS score over time between the two groups (p = 0.535).
SPARCS scores of the two groups were also compared by the Generalized Estimating Equations method. No statistically significant difference was seen in average total scores or in any of the quadrants between eyes with recurrence and eyes without recurrence of disk edema. However, it was noted that the change in SPARCS from baseline to the last follow-up scores was statistically significant in average total score along with average scores in SN, IT, and IN quadrants in eyes which did not have recurrence. In eyes with recurrence, no significant difference was noted in average score or quadrant-wise score from baseline to the last visit. Table 3 elucidates the difference in scores between the two groups.
SPARCS scores of eyes with and without recurrence.

CC, central; CS, contrast sensitivity; IN, inferonasal; IT, inferotemporal; SN, superonasal; SPARCS, Spaeth–Richman Contrast Sensitivity Test; ST, supertemporal.
OCT parameters
The change in OCT parameters is shown in Table 4. All OCT parameters showed a statistically significant difference from baseline to current follow-up visit (p < 0.05) except for macular GCC thickness.
Change in OCT parameters from baseline to current follow-up.

GCC, ganglion cell complex; ONH, optic nerve head; RNFL, retinal nerve fiber layer.
While evaluating change in OCT parameters of eyes with recurrence and eyes without recurrence, it was noted that a significant difference was present in only two parameters between the two groups, namely RNFL thickness and nasal MT.
In eyes with recurrence, the mean RNFL thickness (µm) decreased from a maximum of 154.6 at the baseline to a minimum of 144.4 at the current follow-up. This change was not statistically significant (Wilcoxon test: V = 9.0, p = 0.812). In eyes without recurrence, the mean RNFL thickness (µm) decreased from a maximum of 186.93 at the baseline to a minimum of 82.07 at the current follow-up. This change was statistically significant (Wilcoxon test: V = 105.0, p = 0.001). The overall change in RNFL thickness was compared in the two groups using the Generalized Estimating Equations method. There was a significant difference between the two groups (p = 0.007).
The mean nasal MT (µm) in eyes with recurrence decreased from a maximum of 311 at the baseline to a minimum of 303.8 at the current follow-up visit. This change was not statistically significant (Wilcoxon test: V = 11.0, p = 0.438). In eyes without recurrence, the mean nasal MT (µm) decreased from a maximum of 315.73 at the baseline to a minimum of 275.73 at the current follow-up. This change was statistically significant (Wilcoxon test: V = 120.0, p ⩽ 0.001). The overall change in nasal MT was compared in the two groups using the Generalized Estimating Equations method. There was a significant difference in the trend of nasal MT over time between the two groups (p = 0.006).
The above findings must be interpreted with a disclaimer that the inbuilt, commercially available software may be susceptible to measurement artifacts as it was not designed to evaluate patients with disk edema where the normal architecture of retinal borders is obscured.
Correlation of SPARCS central score with macular GCC
At baseline, Visit 1: There was a moderate positive correlation between GCC and SPARCS CC and this correlation was statistically significant (Spearman correlation, ρ = 0.54, p = 0.015). For every 1 unit increase in SPARCS (CC) (Visit 1), the GC-IPL (µm) (Visit 1) increases by 3.95 units.
At the last visit, Visit 2: There was a weak negative correlation between GCC and SPARCS CC and this correlation was not statistically significant (ρ = −0.12, p = 0.615). Figure 2 illustrates the correlation between macular GCC and SPARCS CC at Visit 1. Figure 3 depicts the correlation of nasal MT with SPARCS SN at Visit 1 and the last follow-up.

Correlation between SPARCS central (CC) and macular GCC: (a) at baseline (Visit 1) and (b) at last follow-up (Visit 2).

Correlation of nasal MT with SPARCS SN: (a) at baseline (Visit 1) and (b) at last follow-up (Visit 2).
Correlation of ON cup volume with modified Frisen grade of disk edema
At baseline, Visit 1: There was a significant difference between the different grades of disk edema in terms of ON cup volume (Kruskal–Wallis test, χ2 = 13.884, p = 0.016), with the median ON cup volume being the highest in eyes without disk edema.
At the last visit, Visit 2: There was no significant difference between the eyes with different grades of disk edema in terms of ON cup volume (Kruskal–Wallis test, χ2 = 4.207, p = 0.122).
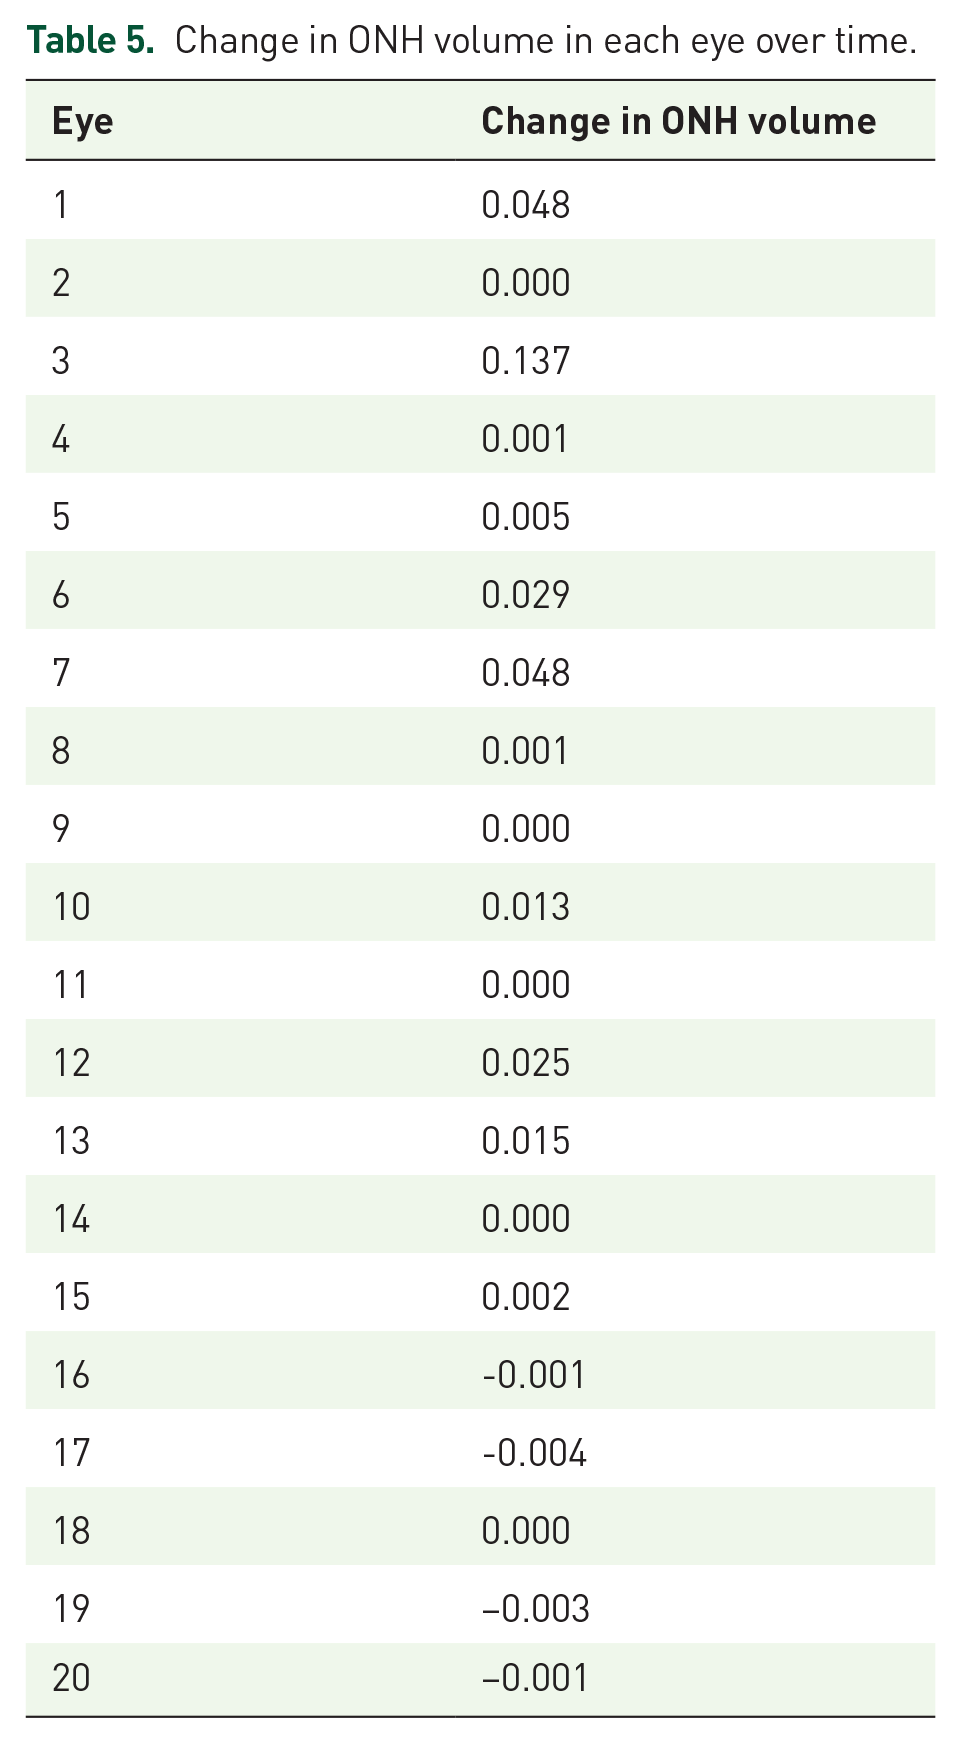
The change in ON cup volume from first visit to current follow-up has been elucidated in Table 5.
Change in ONH volume in each eye over time.
Correlation of average GCC with PR score
At baseline, Visit 1: There was a weak positive correlation between average PR CS Score and average GCC at Visit 1, but this correlation was not statistically significant (ρ = 0.16, p = 0.489).
At the last visit, Visit 2: There was no correlation between average PR CS score and average GCC at the last follow-up visit.
Correlation of nasal MT with SPARCS SN
At baseline, Visit 1: There was a moderate negative correlation between SPARCS SN and nasal MT and this correlation was statistically significant (Spearman correlation, ρ = −0.51, p = 0.021). For every 1 unit increase in SPARCS SN, the nasal MT decreased by 8.51 units.
At the last visit, Visit 2: There was a moderate positive correlation between SPARCS SN and nasal MT and this correlation was not statistically significant (ρ = 0.35, p = 0.126). Figure 3 depicts the correlation of nasal MT with SPARCS SN at Visit 1 and last follow-up.
Correlation of nasal MT with SPARCS IN
At baseline, Visit 1: There was a moderate negative correlation between SPARCS IN and nasal MT and this correlation was statistically significant (Spearman correlation, ρ = −0.52, p = 0.019). For every 1 unit increase in SPARCS IN, the nasal MT decreased by 7.63 units.
At the last visit, Visit 2: There was a moderate positive correlation between SPARCS IN and nasal MT and this correlation was not statistically significant (ρ = 0.36, p = 0.115). Figure 4 depicts the correlation of nasal MT with SPARCS IN at baseline and last follow-up.

Correlation of nasal MT with SPARCS IN:. (a) at baseline (Visit 1) and (b) at last follow-up (Visit 2).
Discussion
IIH is known to run a chronic and recurrent course of disease; 11 thus, long-term follow-up is essential for all patients, even those in whom papilledema has resolved completely. Our study includes a mean follow-up of 21.2 months since the time of IIH diagnosis. The baseline demographic features of our study population were similar to those noted in previous studies, showing a female preponderance (80% patients, n = 8). The idiopathic intracranial hypertension treatment trial (IIHTT) 12 had noted that 98% IIH patients were females while studies in Indian IIH patients by Takkar et al. 3 (95% females) and Pal et al. 13 (94% females) also revealed a major female preponderance. A young patient population was seen in our study, with the average age of presentation being 31.9 ± 10.3 years. It is similar to the mean age of patients noted by Takkar et al. 3 (32.8 ± 11.06 years) in Indian IIH patients while IIHTT study 12 had also noted a young study population (29.0 ± 7.4 years). The mean BMI of patients was 28 ± 3.8 kg/m2 at baseline, which reduced to 27.1 ± 2.8 kg/m2 at the current follow-up, the difference being statistically insignificant. Most of the patients had abandoned diet plan advised midway through treatment and three patients (30%) even reported weight gain. A statistically significant difference was noted in frequency and severity of headache from baseline, indicated by reduction in mean HIT-6 from 57.2 (baseline) to 48.4 (current follow-up).
Recurrence of disk edema was noted in three patients (30%), each having recurrence in one eye. Recurrence was associated with weight gain in two out of three patients (67%) and all three patients were off-medication at the time of recurrence. Only one patient with recurrence (10%) reported headache while rest two were asymptomatic. Another patient (10%) stopped medication on his own and worsening of disk edema in both eyes (Grade 1 to Grade 3) was noted at current follow-up visit. A study by Kesler et al. 11 and his team had noted recurrence in 40% IIH patients, and all patients were off-treatment when recurrence occurred. They noted vision deterioration in 31.5% patients with recurrence, which is in contrast to our study (no visual impairment in any patient). They also observed that no parameters were different during recurrence from initial presentation, thus making it impossible to predict recurrence. A retrospective study on recurrence in IIH observed that 44% with recurrence had history of weight gain while 6% were exposed to drugs implicated in IIH (minocycline/tetracycline). 14 Another retrospective study found a statistically significant difference in BMI of patients with recurrence and those without recurrence, concluding that weight gain predisposes a treated patient to recurrence. 15 We sought neurology opinion for all patients with recurrence. No patient had any cognitive decline/dysfunction, and none were advised any neurosurgical intervention, such as serial LP or CSF shunting procedures.
At baseline, VA was 6/6 in 75% eyes (n = 15), even in the presence of contrast deficit, underlining that CS is more sensitive than VA measurement for subtle visual dysfunction. This finding agreed with previous studies, which had noted contrast deficits even with intact Snellen acuity in IIH.5,16 At current follow-up, the best-corrected Snellen VA was 6/6 in all eyes, even in those with recurrence or progression of papilledema, thus implying that VA measurement may not pick up recurrence or progression.
CS was tested using PR chart (central contrast) and SPARCS test (central and peripheral CS). Our previous study on CS in IIH had concluded that CC and peripheral CS both are affected. 5 At baseline, 70% of eyes (n = 14) had contrast deficits on PR chart testing but at current follow-up, all eyes had full score on the PR chart (2.30). SPARCS tests CS across 30° horizontally and 23.5° vertically. SPARCS revealed a statistically significant change in total score, and also in SN, IN, and IT quadrants. On comparing eyes with recurrence to those without recurrence, no significant difference was noted in PR testing. Comparing eyes with recurrence and without recurrence, a statistically significant difference in total SPARCS score along with SN, IN, and IT quadrants was noted. Our findings clearly indicate that peripheral CS is affected more than central CS in IIH. In eyes with recurrence, while VA and central CS remained unaffected, it was peripheral CS testing that revealed a statistically significant difference from eyes without recurrence. Peripheral retina has lower number of RGCs and is also optically affected by various aberrations, both of these contributing to a worse peripheral CS than central CS in optic nerve dysfunction, such as in glaucoma. 17 Neural sampling is low in the peripheral retina and CS function suddenly declines after a certain cut-off spatial frequency. 18 In our study, statistically significant difference from baseline to current follow-up was noted in total SPARCS score and in three out of four peripheral areas, but not in center. Eyes with higher papilledema (Grade 3/4/5) showed a statistically significant difference from baseline to current follow-up in total SPARCS score and in the two nasal quadrants (SN, IN). Peripheral CS testing thus may hold a key in clinical evaluation of these patients and in recurrence.
All OCT parameters showed a statistically significant difference from baseline, except for macular GCC. A decline in RNFL thickness, disk area, and rim area could be attributed to decrease in disk edema with treatment and eventual atrophy of RGCs. Huang-Link et al. 19 have noted in their research that RNFL was a sensitive monitoring tool in IIH while increased rim area, increased rim thickness, and decreased optic cup volume were consistent markers for high ICP and relapse. Another research work on ONH parameters in IIH had noted that even mild increase in ICP causes a significant fall in ON cup volume and values of zero are a noticeable feature on OCT in IIH patients. 20 We have similarly noted markedly low optic cup volumes in our patients at baseline, with several patients having values of zero due to fullness of optic cup owing to edema. Our study showed that baseline ON cup volume was significantly higher in eyes with low-grade edema or with no edema. A statistically significant difference between different grades of papilledema was noted with respect to ON cup volume at baseline but the same was not observed at current visit, probably due to most eyes having no edema/lower grades of edema presently.
Athappilly et al. 8 noted that increased RNFL thickness and atrophy of GCC had no correlation, but GCC analysis could indicate optic nerve injury and loss of vision. However, another study on OCT in IIH had concluded that most patients showed normal GCC values and they did not vary even in severe papilledema or high ICP. 20 In our study, average macular GCC did not show any significant change at current follow-up visit from baseline. A moderate positive correlation between macular GCC and SPARCS CC score was noted but only at the baseline visit and not at the current follow-up visit. No correlation was noted between PR score and average macular GCC at any of the visits. Previous studies had noted a selective thickening of nasal macula in papillomacular area due to its proximity to the optic nerve. 21 In our study, average nasal MT showed a statistically significant decrease at the current follow-up from baseline while the average central MT had in fact increased in the same time period. A strong positive correlation between nasal MT and RNFL thickness was noted at the latest follow-up visit, and this correlation was statistically significant (ρ = 0.75, p ⩽ 0.001). While evaluating OCT parameters in eyes with and without recurrence, only two parameters showed a statistically significant difference between the two groups: average nasal MT and average RNFL thickness. Thus, increase in RNFL thickness and nasal MT in a patient in remission may serve as pointers toward the recurrence of disease. Since both the nasal quadrants of SPARCS (SN, IN) showed statistically significant change from baseline, we correlated them with nasal MT. A statistically significant moderately negative correlation was observed between nasal MT with both the nasal SPARCS quadrants (SN, IN) at baseline visit. This implied that patients with lower nasal MT had better SPARCS scores in peripheral areas nasally, indicating better peripheral CS in patients with lower nasal MT. However, no correlation between them could be noted at the current follow-up.
Through this study, we comprehensively assessed several structural and functional parameters of visual function in IIH. We also tried to look at the factors that were different in eyes with recurrence. A lot of research has been done in IIH recently but there is still a lot that needs to be uncovered to fully understand this rare disease.
Elnahry et al. 22 have shown that peripapillary microperimetry may help in the diagnosis of early atrophy by demonstrating the failure of improvement in the peripapillary sensitivity following medical or surgical treatment. Microperimetry requires special equipment for spatially resolved mapping of visual sensitivity, while SPARCS is freely available on the Internet.
Limitations of our study include a small sample size, not including visual field parameters for analysis and a relatively shorter follow-up period, when compared to few previous studies. However, as this disease is rare with an unknown prevalence in India, we intend to add as much as we can to the currently available literature.
Conclusion
IIH is a chronic relapsing and recurring disease, which needs monitoring even after the resolution of papilledema. Peripheral CS shows early changes and may hold aces in monitoring disease and detecting recurrence. RNFL thickness and nasal MT were the only OCT parameters that could differentiate eyes with recurrence from those without recurrence. We recommend monitoring of peripheral CS, RNFL thickness, and nasal MT to detect subtle changes even when other functional aspects of visual function are unaffected.
Supplemental Material
sj-docx-1-oed-10.1177_25158414221083358 – Supplemental material for Change in contrast sensitivity and OCT parameters in idiopathic intracranial hypertension
Supplemental material, sj-docx-1-oed-10.1177_25158414221083358 for Change in contrast sensitivity and OCT parameters in idiopathic intracranial hypertension by Obaidur Rehman, Parul Ichhpujani, Ekta Singla, Reetika Negi and Suresh Kumar in Therapeutic Advances in Ophthalmology
Footnotes
Author contributions
Conflict of interest statement
The authors declared no potential conflicts of interest with respect to the research, authorship, and/or publication of this article.
Funding
The authors received no financial support for the research, authorship, and/or publication of this article.
Ethics statement
The Institutional Ethics Committee of the Government Medical College and Hospital (Chandigarh, India) approved the study (Approval No. GMC/IEC/2018/187) before its initiation. An informed, written consent was provided by the patients prior to the enrollment in the study. The study followed the tenets of the Declaration of Helsinki.
Supplemental material
Supplemental material for this article is available online.
References
Supplementary Material
Please find the following supplemental material available below.
For Open Access articles published under a Creative Commons License, all supplemental material carries the same license as the article it is associated with.
For non-Open Access articles published, all supplemental material carries a non-exclusive license, and permission requests for re-use of supplemental material or any part of supplemental material shall be sent directly to the copyright owner as specified in the copyright notice associated with the article.