
Abstract
Background:
In recent years, the role of some hematological parameters used as chronic inflammation markers in the pathogenesis of many ocular and systemic diseases has been investigated. For ocular diseases such as uveitis, keratoconus, and retinal vein occlusion, the neutrophil/lymphocyte ratio (NLR) and systemic immune-inflammatory index (SII) have been reported to be useful inflammatory biomarkers. It has also been reported that low-grade chronic inflammation plays a role in the formation of pseudoexfoliation.
Objective:
To evaluate the NLR, SII, and platelet-lymphocyte ratio (PLR) in patients with pseudoexfoliation syndrome (PEXS) and pseudoexfoliative glaucoma (PEXG).
Design:
This was a retrospective case-control study.
Methods:
This study evaluated the clinical and laboratory data of 34 patients with PEXS, 33 patients with PEXG, and 33 control patients. Detailed eye examination notes in patient files and blood count measurements were recorded.
Results:
SII values were the highest in the PEXS group, followed by the PEXG and control groups (582.01 ± 339.9, 478.14 ± 211.7, and 413.98 ± 129.5, respectively) (p = 0.043). In paired comparisons, the SII values of the PEXS group were significantly higher than the control group (p = 0.011). The mean NLR rate was highest in the PEXS group, followed by the PEXG and the control groups (2.46 ± 1.6, 2.17 ± 0.8, and 1.69 ± 0.4, respectively) (p = 0.023). In paired comparisons, the mean NLR levels were higher in the PEXS and the PEXG groups than in the control group (p = 0.03 and p = 0.01, respectively). There was no significant difference between the groups in terms of PLR. According to receiver operating characteristic curve analysis, the optimal cut-off value for estimating PEXS was found as >449.4 for SII and 1.78 for NLR (p = 0.011 and p = 0.031, respectively).
Conclusions:
In PEXS patients, both SII and NLR were significantly higher, albeit in a small group of patients, and SII may be a helpful and supportive parameter for NLR in risk estimation in these patients. There was a statistically significant difference only in NLR in patients with PEXG when compared with the control group. However, these results need to be supported by future longitudinal and larger studies to identify any possible link between hematological inflammatory markers and pseudoexfoliation.
Keywords
Introduction
Pseudoexfoliation syndrome (PEXS) is a disease in which abnormal fibrillary extracellular material is produced and accumulates in many ocular and extraocular tissues. Although ocular findings are mainly observed in anterior segment structures, conjunctiva and orbital structures may also be involved. 1
Although the incidence of PEXS varies by region, in one study, the prevalence of PEXS was approximately 26 per 100,000, compared with approximately 10 per 100,000 for pseudoexfoliative glaucoma (PEXG). 2 Based on these data, we can say that approximately 40% of patients with PEXS may develop PEXG. PEXS tends to evolve into PEXG, especially in older patients. There is a correlation between the severity of glaucoma and the amount of exfoliation material present in the trabecular meshwork and inner wall of Schlemm’s canal. PEXG is the most common type of open-angle glaucoma with an identifiable cause, accounting for approximately 20–25% of cases. 3
Although the pathophysiologic mechanisms underlying PEXS have not yet been fully elucidated, it is thought that biochemical and pathologic processes caused by various molecules play a role in oxidative damage and inflammation.1,4 Studies suggest that subclinical inflammation plays a role in the initiation of the fibrotic matrix process that is characteristic of PEX syndrome/glaucoma. 5 High systemic levels of the inflammatory marker, tumor necrosis factor-α, have been associated with PEXG and have been reported to possibly serve as a biomarker for undiagnosed early glaucoma and/or a marker for disease progression. 6 The association of PEXS with many age-related chronic degenerative diseases such as Alzheimer’s disease, atherosclerosis, and cardiovascular disorders has been shown previously.7,8 In addition, the importance of the underlying chronic inflammatory processes in the pathogenesis of these diseases has been reported in the literature.9,10
Recently, many studies have been published using new biomarkers that can be easily calculated with whole blood parameters to determine systemic inflammation. One of the most important values is the neutrophil-lymphocyte ratio (NLR) and the systemic immune-inflammatory index (SII). The use of SII, which is formed by collecting whole blood parameters under a single parameter during the inflammation process, as an inflammation marker, has come to the fore in recent publications. SII was calculated by multiplying the neutrophil count by the platelet count and dividing by the lymphocyte count, as previously described. 11 It has been investigated in many diseases in which inflammation plays a role and in reported diseases associated with PEXS.12–14
In this study, we aimed to evaluate NLR, platelet-to-lymphocyte ratio (PLR), and SII levels in patients with PEXS and PEXG, considering the role of inflammation in the pathogenesis of PEXS and similar studies in PEXS-related diseases such as cardiovascular or cerebrovascular diseases. Also, we aimed to investigate whether these inflammatory markers could be used to diagnose PEXS and PEXG. When we reviewed the literature, we found no other study evaluating SII levels in PEXS and PEXG.
Materials and methods
Medical records between January 2017 and October 2022 were used to obtain the research data. The medical records of patients who underwent cataract surgery at Sultan Abdulhamid Han Training and Research Hospital were reviewed retrospectively between January 2017 and October 2022. Detailed eye examination notes in patient files were evaluated.
Patients with PEXS consisted of typical pseudoexfoliative material deposition on the anterior lens capsule, iris, and pupillary margin in dilated eye examination but with intraocular pressure (IOP) below 21 mm Hg, standard visual field, and optic nerve head findings. The patient group with PEXG consisted of patients with pseudoexfoliative material in the anterior eye segment, clinical and imaging findings of glaucomatous optic neuropathy, glaucomatous damage in the visual field, and IOP > 21 mm Hg. Control patients were selected from age and sex-matched patients who presented for routine cataract surgery in our clinic and were completely healthy in terms of the eye except for cataracts. Optic disc, IOP, and visual field examinations of these patients were within normal limits, and they had no findings in favor of PEXS and glaucoma. In the power analysis based on the results of a previous similar study, 15 it was determined appropriate to recruit 30 patients for each group (α = 0.05, 80% power; G*Power 3.0.10, Franz Faul, University of Kiel, Kiel, Germany)
Patients who had undergone any surgery in the last 3 months, patients who received regular anti-inflammatory therapy, and patients with missing data were excluded from the study. In addition, patients with diabetes mellitus, autoimmune or inflammatory ocular/systemic disease, hematologic disease and malignancy, and acute/chronic infections were excluded from the study.
Best-corrected visual acuity, biomicroscopic examinations, IOP measurements, and automatic perimetry results were noted from the files of all patients who had cataract surgery. After applying the exclusion criteria, clinical and laboratory data of 34 patients with PEXS, 33 patients with PEXG, and 33 control patients were evaluated.
The complete blood count (CBC) parameters taken 1 week before the surgery were examined for anesthesia approval for the patients. Venous blood samples were taken from the antecubital region between 09:00 a.m. and 12:00 p.m. The samples were analyzed within 6 hours after sampling using a Mindray BC-6800 automated hematology analyzer (Mindray Bio-Medical Electronics, Shenzhen, China). The results of the CBC determined white blood cells, neutrophil counts, lymphocyte counts, and platelet counts. NLR was obtained by dividing the absolute neutrophil count by the absolute lymphocyte count, and PLR was obtained by dividing the absolute platelet count by the absolute lymphocyte count. SII was calculated by multiplying the neutrophil count by the platelet count and dividing by the lymphocyte count.
The IBM SPSS 26.0 (IBM Corp., Armonk, New York, USA) package program was used in the study’s statistical analysis. Descriptive statistics (frequency, percentage, median, mean, standard deviation, min, and max. values) of the groups’ demographic data and blood values (all parameters) were calculated. Before comparing the groups, whether the groups were normally distributed for all parameters was checked using the Shapiro–Wilk test. If at least one of the three groups was not normally distributed, the Kruskal–Wallis test was used. If all three groups were normally distributed, analysis of variance was used.
In paired group comparisons for significant parameters, the Mann–Whitney U test was used for groups that were not normally distributed, and Bonferroni correction was used for normally distributed groups. Statistical analyses were evaluated at a 95% confidence interval and significance at p < 0.05 level. Receiver operating characteristic (ROC) curves were also used to show the sensitivity and specificity of the optimal SII and NLR cut-off values in patients with PEXS. Areas under the curve (AUC) were calculated.
Results
Thirty-four patients (17 women, 17 men, mean age: 68.12 ± 7.4 years) in the PEXS group, 33 patients (13 women, 20 men, mean age: 70.24 ± 6.7 years) in the PEXG group, and 33 patients in the control group (21 females, 12 males, mean age: 66.82 ± 7.1 years), were included in the study. The three groups were similar in age and sex distribution (p = 0.148 and p = 0.142, respectively) (Table 1).
Comparison of laboratory data between PEXS, PEXG, and control groups.

Data are expressed as the mean ± SD or number of cases as appropriate.
Statistically significant results.
IOP, intraocular pressure; NLR, neutrophil-to-lymphocyte ratio; PEXG, pseudoexfoliative glaucoma; PEXS, pseudoexfoliation syndrome; PLR, platelet-to-lymphocyte ratio; RNFL, retinal nerve fiber layer; SD, standard deviation; SII, systemic immune inflammation index; WBC, white blood cell count.
There was no significant difference between the groups in terms of IOP (p > 0.05). There was no antiglaucomatous drug use in PEXS and control groups; however, in the PEXG group, 11 (33.3%) patients were using one antiglaucomatous drug, 15 (45.5%) were using two antiglaucomatous drugs, 2 (6.1%) were using three antiglaucomatous drugs, and 5 (15.2%) patients were using four antiglaucomatous drugs. The mean retinal nerve fiber layer thickness was thinnest in the PEXG group, followed by the PEXS and the control groups (76.03 ± 16.6 µm, 99.97 ± 7.7 µm, and 101.88 ± 9.6 µm, respectively) (p < 0.001), as expected.
The SII value was highest in the PEXS group, followed by the PEXG and control groups, respectively (582.01 ± 339.9, 478.14 ± 211.7, and 413.98 ± 129.5, respectively) (p = 0.043) (Figure 1). In paired comparisons, it was observed that the SII value of the PEXS group was significantly higher than the control group (p = 0.011) (Table 2).

Comparison of systemic immune inflammation index levels (SII) between the PEXS (n = 34), PEXG (n = 33), and control groups (n = 33).
Pairwise comparisons of NLR, PLR, and SII values between groups.

NLR, neutrophil-to-lymphocyte ratio; PEXG, pseudoexfoliative Glaucoma; PEXS, pseudoexfoliation syndrome; PLR, platelet-to-lymphocyte ratio; SD, standard deviation; SII, systemic immune inflammation index.
The mean NLR rate was highest in the PEXS group, followed by PEXG and control groups (2.46 ± 1.6, 2.17 ± 0.8, and 1.69 ± 0.4, respectively) (p = 0.023) (Figure 2). In paired comparisons, mean NLR levels were higher in the PEXS and PEXG groups than in the control group (p = 0.03 and p = 0.01, respectively) (Table 2). There was no difference between the groups regarding PLR and other parameters (p > 0.05). The results are shown in Table 1.

Comparison of NLR between the PEXS (n = 34), PEXG (n = 33), and control groups (n = 33).
In the ROC curve analysis, the predictive values of NLR and SII for the diagnosis of PEXS were calculated based on the AUC area. The AUC of the NLR and SII for PEXS were 0.654 and 0.68, respectively (Figures 3 and 4). The optimal cut-off value of SII to predict PEXS was >449.43, with 61.8% sensitivity and 60.6% specificity (95% confidence interval 0.552–0.808, p = 0.011). The cut-off value for the probable diagnosis of PEXS was 1.78, with a sensitivity of 64.7% and specificity of 63.6% for the NLR value, which was statistically significant (p = 0.031) (Figures 3 and 4).

ROC curve of SII for discrimination between controls (n = 33) and PEXS (n = 34).
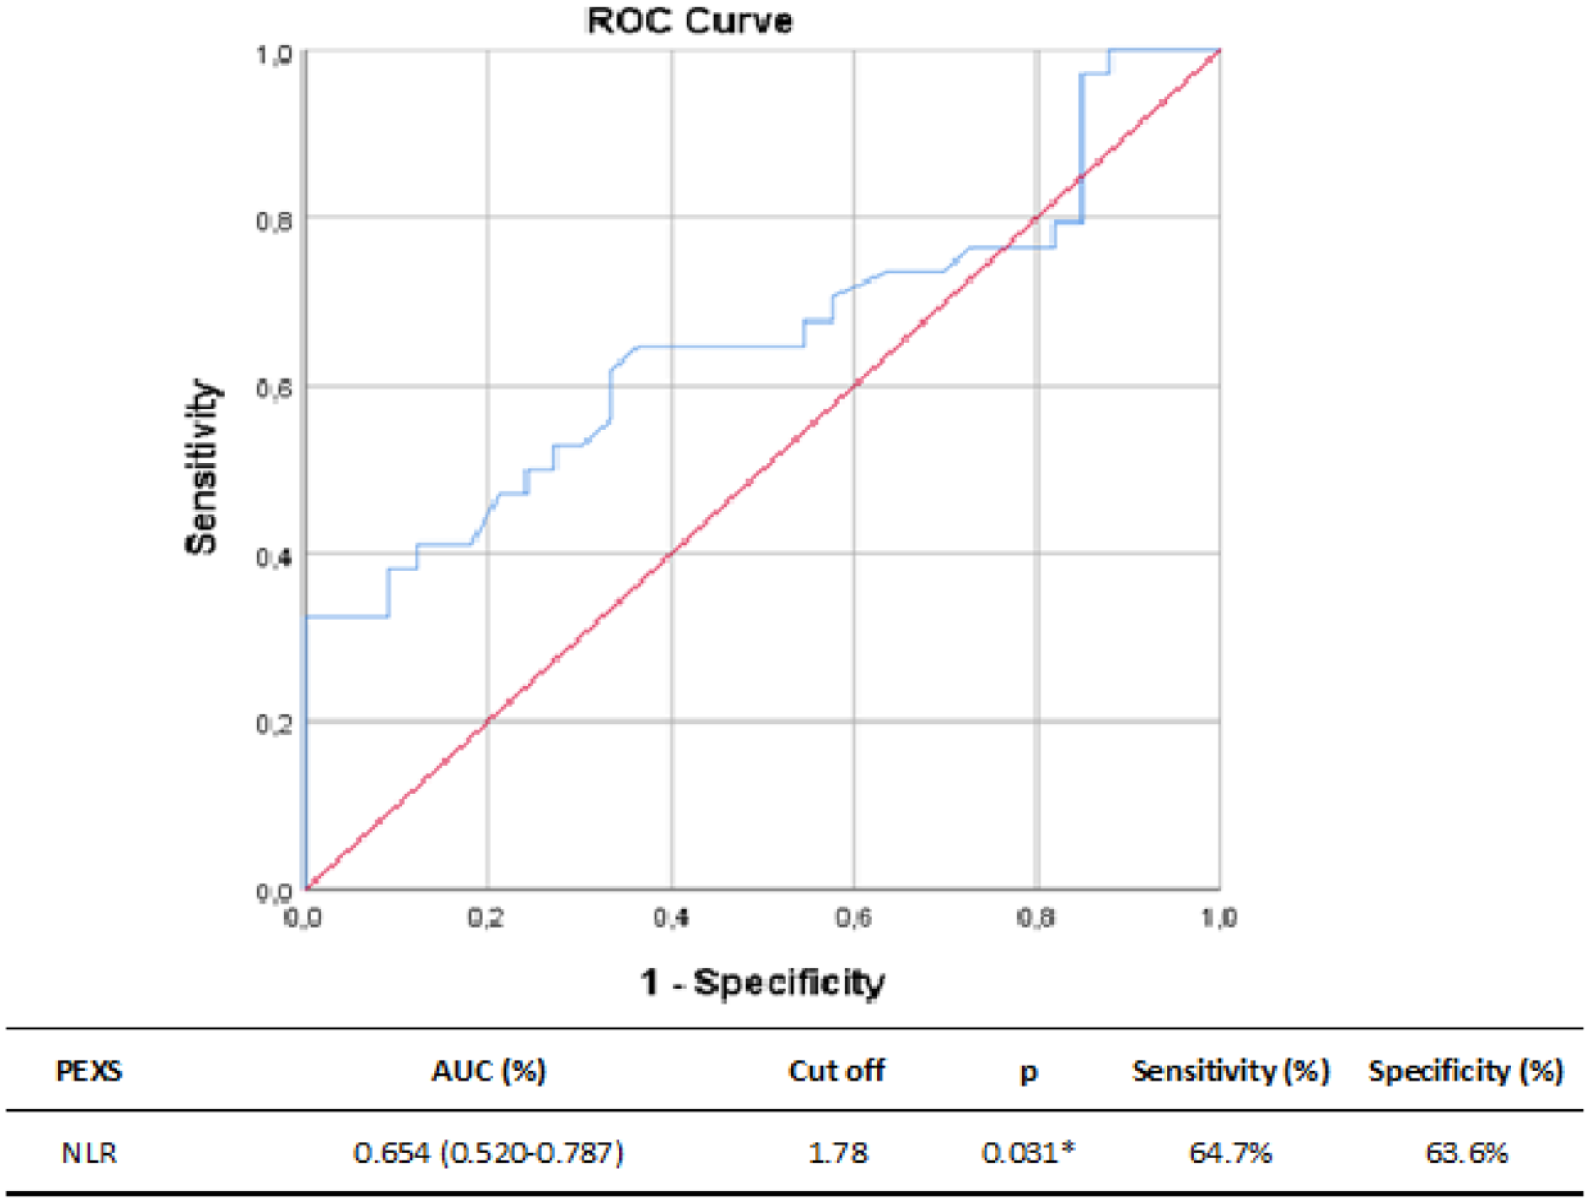
ROC curve of NLR for discrimination between controls (n = 33) and PEXS (n = 34).
Discussion
The precise mechanisms related to the pathogenesis and formation of PEXS are still not clearly understood. The lysyl-oxidase-like-1 gene located on chromosome 15q24.1 as a genetic factor is a significant risk factor for PEXS and PEXG.16,17 The importance of inflammatory mediators in the formation of PEXS has been demonstrated. Yildirim et al. 18 showed that local and chronic inflammation caused by complement factors, especially interleukin-6, played a central role in developing PEXS. Stress-related, spatial, and temporal inflammation in the anterior segment has also been shown to play a role in pseudoexfoliation formation. 5
In recent years, several studies have shown that parameters easily calculated from CBC, such as SII, NLR, and PLR, are valuable in demonstrating the role of inflammation in some diseases.19,20 Although there are some studies in the literature on these inflammatory markers related to ocular diseases and PEXS, to our knowledge, this is the first study to evaluate SII levels in patients with PEXS and PEXG. We showed a significant increase in SII and NLR in patients with PEXS compared with healthy controls. In patients with PEXG, both SII and NLR were higher than the control group, but there was a statistically significant difference only in NLR value. In the ROC analysis, we found cut-off values of 1.78 for NLR and 449.43 for SII to distinguish patients with PEXS from the control group. The results of previous studies showing the predictive value of NLR in PEXS are consistent with our results; however, this is the first study to report the predictive value of SII for PEXS.21,22
With inflammation, neutrophil and platelet counts increase in whole blood parameters, and lymphopenia is observed. Although neutrophils occur secondary to systemic inflammation, the decrease in lymphocyte counts indicates a weakening of cellular immunity. NLR can be evaluated as a cellular immune response that occurs in response to developing systemic inflammation. The diagnostic and prognostic value of NLR has been investigated in many eye diseases where inflammation plays a role, such as glaucoma, dry eye disease, keratoconus, and retinal vein occlusion. 23 Kurtul et al. 22 reported the relationship between NLR and PEXS for the first time and found that the mean NLR value was 2.08 ± 0.61 in PEXS, 2.20 ± 0.58 in PEXG, and 1.51 ± 0.57 in the control group. They found that the NLR rate was statistically significantly higher in patients with PEXS and PEXG. Also, in the same study, the area under the ROCs curve for NLR was 0.776, and an NLR value of 1.72 or higher predicted PEXS with 77% sensitivity and 71% specificity. Another study evaluating similar patient groups showed that NLR was higher in PEXS and PEXG patient groups than in the control group. A cut-off value of 1.76 was significantly predictive in differentiating patients with PEXG from controls. 15
SII is a new-generation inflammatory biomarker created from CBC data. It can reflect the immune-inflammatory state more comprehensively because it shows neutrophils, lymphocytes, and platelet counts involved in the inflammatory process in a single parameter. As a marker of the inflammatory process, SII has found a significant place as a prognostic factor, especially in malignancies.11,24 Very few studies have presented its diagnostic and prognostic value in ophthalmic diseases.20,25–28
A study investigating the effect of inflammation in keratoconus patients showed that SII was higher in patients with keratoconus, similar to NLR and PLR. In addition, it was emphasized that SII might be superior to NLR and PLR both in assessing the disease’s severity and predicting the inflammatory state. 20 In a large study in which 5352 patients were evaluated, SII was significantly higher in patients who developed cystoid macular edema after routine phacoemulsification surgery in risk-free eyes compared with the control group. In addition, SII has been reported to help predict the development of pseudophakic cystoid macular edema. 25
Elbeyli et al. 26 reported that SII was a better predictor of the development of macular edema in diabetic retinopathy than NLR. In their recent study, Kurtul et al. 27 evaluated the relationship between disease severity and SII, NLR, and PLR in non-infectious uveitis. They showed that SII was superior to NLR and PLR in determining the severity of anterior uveitis and that only SII was correlated with the severity of posterior uveitis. They also suggested that SII might be a useful marker in monitoring anti-inflammatory treatment response in patients with non-infectious uveitis.
A study evaluating NLR, PLR, and SII values in patients with primary open-angle glaucoma (POAG) found these parameters significantly higher in patients with POAG than in the control group. Even if the patients were divided into different age and sex subgroups, NLR and SII values were consistently higher in patients with POAG compared with the control group. It has also been shown that glaucoma severity correlates with NLR and SII. ROC analyses revealed that the NLR, PLR, and SII areas under the ROC curve to predict patients with POAG were 0.627, 0.569, and 0.986, respectively. The best cut-off point of NLR was 1.998 with a sensitivity of 59.8% and a specificity of 63.0%; for SII, it was 947.365 with a sensitivity of 95.4% and a specificity of 95.7%. 28 In this study, where we analyzed SII levels from patients with PEXS and PEXG for the first time, we showed that SII value is helpful in the diagnosis and prediction of PEXS, similar to NLR. We analyzed the areas under the curve of the NLR and SII parameters by ROC curve analysis to distinguish between cases with PEXS and control cases (Figures 3 and 4). We found that SII was a better discriminating parameter in distinguishing the PEXS group from the control groups (AUC = 0.68, AUC = 0.654, respectively).
In our study, we found the mean NLR, PLR, and SII values of the PEXS group to be relatively higher than the PEXG study group, although it was not statistically significant. In other studies, some authors found NLR and PLR values higher in the PEXG group, whereas other researchers found similar results between the two groups.15,21,22 Regarding SII, we found no similar studies in the literature. Our study is a cross-sectional study. Although some patients with PEXS progress towards glaucoma, variability may appear in these parameters at different stages, so the results should be supported by longitudinal studies. However, we think that our results will contribute to the literature because there are scant data on this subject in the literature.
Although our study serves its purpose, it has several limitations. First, the number of patients in the groups was small despite having the sample size targeted by power analysis. Therefore, statistical power was limited to detect differences between the groups. In addition, the retrospective nature of the study design is another important limitation. More longitudinal studies with more patients are needed to explore the possible role of serum NLR and SII levels in PEXS. The study did not include data on some proinflammatory cytokines or markers of inflammation that might work (e.g., C-reactive protein). Furthermore, our study population is exclusively Caucasian, so our results need to be supported by further studies with other ethnicities.
Conclusion
In recent years, it has been shown that SII based on peripheral lymphocyte, neutrophil, and platelet counts better reflects local immune response and systemic inflammation and has a high prognostic value in many diseases. In the literature, there are studies on the role of NLR and PLR, which are other inflammatory indices associated with many ocular diseases in patients with PEXS. Our central hypothesis in this study was to understand the importance of SII in both diagnosis and risk estimation of patients with PEXS and PEXG. Our study showed that in PEXS patients, both SII and NLR were significantly higher, albeit in a small group of patients, and SII may be a helpful and supportive parameter for NLR in risk estimation in these patients. In patients with PEXG, both SII and NLR were higher than the control group, but there was a statistically significant difference only in NLR. Despite the limitations mentioned above, we think that this study is valuable as a small pilot study in evaluating neutrophils, lymphocytes, and platelets involved in inflammation under a single parameter such as SII, and in revealing their relationship with PEXS-PEXG. In addition, with the advantages of low cost and easy accessibility, NLR and SII values may be potential predictors of increased inflammatory activity in patients with PEXG and PEXS, provided that they are supported by comprehensive and prospective studies.