
Abstract
Background:
Diabetes mellitus (DM) is one of the world’s greatest health emergencies of the 21st century. Ocular complications of DM are commonly chronic and progressive, but vision loss can be effectively prevented or delayed with early detection and timely treatment. Therefore, regular comprehensive ophthalmologic examinations are mandatory. Ophthalmic screening and dedicated follow-up for adults with DM are well established, whereas, there is no consensus on optimal recommendations for the pediatric population, reflecting the lack of clarity about the current burden of disease in this age group.
Objectives:
To determine the epidemiology of ocular complications of diabetes and to assess optical coherence tomography (OCT) and optical coherence tomography angiography (OCTA) macular features in a pediatric population with DM. To review ophthalmological screening and follow-up plans for the diabetic pediatric population.
Design:
Observational study.
Methods:
Retrospective consecutive cohort study of all 165 diabetic patients (330 eyes) aged 0–18 years, examined between January 2006 and September 2018 at the Pediatric Department of ‘S. Maria della Misericordia’ Udine Hospital who underwent at least one complete ophthalmologic examination at the Ophthalmology University Clinic at the Udine Hospital. OCT and OCTA data were available for 37 patients (72 eyes, 2 excluded). The associations between ocular complications and selected potential risk factors were evaluated by univariate analyses.
Results:
No patient had signs of ocular diabetic complications or any macular morphological or micro-vascular impairment, regardless of any potential risk factor. The prevalence of strabismus and refractive errors in the study group, was found to be similar to non-diabetic pediatric populations.
Conclusion:
Screening and follow-up of ocular diabetic complications in children and adolescents could be performed less frequently than in adults with diabetes. There is no need to screen potentially treatable visual disorders in diabetic children earlier or more frequently than in the healthy children thus reducing time spent in hospital and permitting a better tolerance to medical examinations in diabetic pediatric patients. We described the OCT and OCTA patterns in a pediatric population with DM.
Epidemiology of ocular complications of diabetes, optical coherence tomography (OCT), and optical coherence tomography angiography (OCTA) macular features in a pediatric population with diabetes mellitus.
Several ophthalmic diseases can be associated with diabetes mellitus, and there are a growing number of studies focusing on OCT and OCTA in diabetic patients. However, there are few studies focusing on the pediatric population.
We described clinical features, OCT, and OCTA patterns in a pediatric population with diabetes mellitus.
Introduction
Diabetes mellitus (DM) is one of the world’s greatest health emergencies of the 21st century. It is included among the four most common chronic diseases and the top-10 world’s leading causes of death, 1 and its incidence and prevalence are constantly increasing. 2
Patients with DM are at higher risk of developing macro- and micro-vascular complications compared to people without DM. 3 Diabetic retinopathy (DR) is the most common micro-vascular complication of DM worldwide. It affects almost one-third of diabetic patients 4 and is the leading cause of legal blindness in the working age population worldwide.5,6 Estimates on DR epidemiology in different diabetic populations are extremely variable: DR prevalence in the pediatric population appears to be lower than in adults. The youngest age at which non-proliferative and proliferative DR have been observed are 5 and 15 years, respectively, all prior to the late 1990s, with the shortest duration of DM being 5 years.7–9 Ophthalmoscopy is the primary method for evaluating DR, though, in selected cases, diagnostic ancillary imaging modalities may be useful. 10 Among them, optical coherence tomography (OCT) and optical coherence tomography angiography (OCTA) are non-invasive tools enabling reproducible quantitative assessment of the retinal morphology, thickness, and microcirculation.11–13
Other than DR, a number of ophthalmic diseases are associated with DM, including refractive changes, ocular surface diseases, cataract, glaucoma, diabetic papillopathy, and paralytic strabismus. 14
Ocular complications of DM are commonly chronic and progressive, but vision loss can be effectively prevented or delayed with early detection and timely treatment.15,16 Therefore, regular comprehensive ophthalmologic examinations are mandatory.
Ophthalmic screening and dedicated follow-up for adults with DM are well established, 17 whereas, there is no consensus on optimal recommendations for the pediatric population, reflecting the lack of clarity about the current burden of disease in this age group.17–27
Objectives
The aim of this study is to determine the epidemiology of ocular complications of diabetes and to assess OCT and OCTA macular features in a pediatric population with DM. We also sought to review ophthalmological screening and follow-up plans for the diabetic pediatric population.
Patients and methods
A retrospective consecutive cohort study was conducted on all 165 diabetic patients aged 0–18 years examined between January 2006 and September 2018 at the Pediatric Department of Udine Hospital, who underwent at least one complete ophthalmologic examination at the Ophthalmology Department of Udine Hospital.
Clinical data collected included gender, age at diagnosis of DM, age and duration of DM at each examination, serum glycated hemoglobin (HbA1c) levels, type of DM and medical therapy, body mass index (BMI), lipid profile, renal function, any co-morbidity, and any complication of DM at each examination. If multiple examinations were available, the mean ± standard deviation [SD] of each measurement was calculated. Average HbA1c levels were calculated excluding data collected within the first year of DM diagnosis, as HbA1c levels still reflect glycaemia before diagnosis and the honeymoon period.
Ocular data collected included Hirschberg corneal light reflex test, Cover test, Lang I and II stereo test, ocular motility examination, best-corrected visual acuity, either Goldmann or iCare intraocular pressure if possible, cycloplegic refractions, slit-lamp biomicroscopy, and dilated fundus examination.
Refractive errors were obtained by cycloplegic refractions and classified by the amount of spherical equivalence (in diopters [D]) into the following categories: hyperopia (⩾2.00 D of hyperopia in patients younger than 6 years, ⩾1.50 D of hyperopia in patients aged 6 years or older), myopia (⩾0.25 D of myopia), and astigmatism (⩾1.00 D of astigmatism).
Among patients enrolled, 37 aged 6–18 years underwent imaging of both eyes with OCT and OCTA (Triton DRI-OCT, Topcon, Japan). Scans were obtained without pupillary dilatation. All scans had an image quality factor of 60/100 or greater and were performed by a single trained operator under standardized conditions. A single trained operator reviewed all images to ensure correct segmentation and to identify poor quality scans, where data were insufficient for proper analysis.
OCT was performed with 3D macular cube scan (7.0 × 7.0 mm – 512 × 256) and five-line cross-scan (9 mm, 9 mm) centered on the fovea. The Early Treatment Diabetic Retinopathy Study (ETDRS) grid was used for reporting retinal thickness.
OCTA was performed with 3 mm × 3 mm images of the macula, centered on the fovea. Foveal avascular zone (FAZ) area in both the superficial (SCP) and deep capillary plexus (DCP) layer, and macular capillary vascular density in the SCP were analyzed. The border of the FAZ area was manually calculated by a single operator. Integrated automated algorithms provided by the machine’s software were used to quantify macular capillary vascular density.
Descriptive statistics summarized baseline characteristics of the enrolled subjects. The associations between diabetes-related complications and selected potential risk factors were evaluated by univariate analyses. The Pearson Correlation Index was used to assess statistical significance, which was defined as a p value < 0.05. The Student’s t-test was used to compare OCT and OCTA features in our study group and in other study populations. Statistical analyses were performed using IBM SPSS Statistics 24.
Results
Overall, 165 diabetic patients aged 0–18, 77 males and 88 females, were enrolled in this study. Around 161 patients had type 1 DM (T1DM) receiving insulin therapy; 1 patient had type 2 DM (T2DM) on oral anti-diabetic drugs; and 3 patients had maturity-onset diabetes of the young 2 (MODY2) receiving medical nutrition therapy.
The mean age at DM diagnosis was 8 ± 4 years (range 1–17 years) and the mean follow-up duration was 6 ± 4 years (range: 0–17 years), with no significant differences between genders (Table 1).
Age at diabetes mellitus onset, age and duration of diabetes at last visit of study population.

DM, diabetes mellitus; n, number of patients; SD, standard deviation.
The mean serum HbA1c levels showed Gaussian distribution, ranging from 5.9% to 11.0% (mean: 7.8 ± 0.8%), without significant differences between genders (Table 2).
Average HbA1c levels from the second year after diabetes mellitus diagnosis to the last examination among study group.

HbA1c, serum glycated hemoglobin; n, number of patients; NA, not available; SD, standard deviation.
Among 161 subjects with T1DM, 100 (62.1%) were on multiple daily injections of insulin (MDI) alone and 45 (27.9%) in combination with continuous glucose monitoring (CGM); 7 (4.3%) were on continuous subcutaneous insulin infusion (CSII) alone and 9 (5.6%) in combination with CGM (Table 3)
Average HbA1c levels from the second year after diabetes mellitus diagnosis to the last examination among patients with type 1 diabetes mellitus on MDI/ CSII alone or in combination with CGM.

CGM, continuous glucose monitoring; CSII, continuous subcutaneous insulin infusion; HbA1c, serum glycated hemoglobin; MDI, multiple daily insulin injections; n, number of patients; NA, not available; SD, standard deviation.
Out of 165 patients, 25 (15.1%) had dyslipidemia receiving medical nutrition therapy and 1 (0.6%) had familial hypercholesterolemia on pharmacological therapy (Table 4).
Altered serum TC, LDL, HDL, and TG levels among study population.
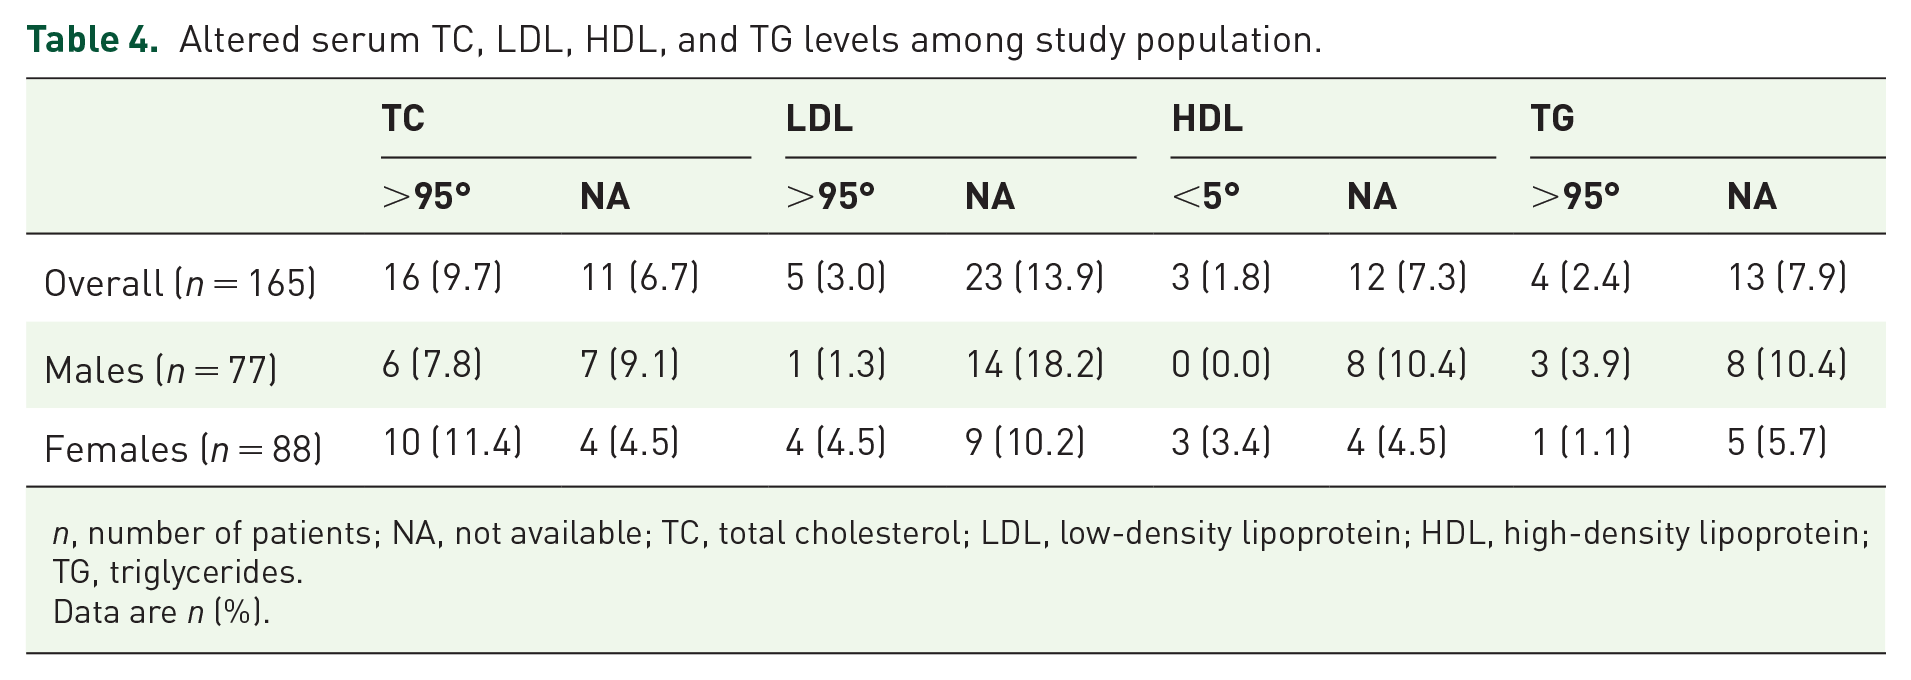
n, number of patients; NA, not available; TC, total cholesterol; LDL, low-density lipoprotein; HDL, high-density lipoprotein; TG, triglycerides.
Data are n (%).
The BMI ranged from underweight (0.6%) to obese (7.3%), as shown in Table 5.
Body mass index among study population.

n, number of patients.
Data are n (%).
Out of 165 patients, 56 (33.9%, 27 males and 29 females) had 1 to 4 co-morbidities beyond DM.
The most frequent co-morbidities were autoimmune thyroiditis (11.5%, 7 males and 12 females) and celiac disease (7.3%, 5 males and 7 females); followed by allergic bronchial asthma (3.0%, 4 males and 1 female), psoriasis or atopic dermatitis (2.4%, 4 males), hypertension (1.8%, 3 males), epilepsy (1.8%, 1 male and 2 females), and sensorineural hearing loss (1.8%, 1 male and 2 females).
The prevalence of systemic complications of DM was 3.0%: 4 patients with T1DM were found to have proteinuria (Table 6).
Prevalence of diabetes-related complication among study population, categorized by potential risk factors.

BMI, body mass index; DM, diabetes mellitus; HbA1c, serum glycated hemoglobin; MODY2, maturity-onset diabetes of the young 2; n, number of patients; NA, not available.
Data are n (%).
No patients were found to have DR, cataract, ocular hypertension or glaucoma, diabetic papillopathy or ocular surface disease during study period. One patient (0.6%) had bilateral congenital cataract, known before DM diagnosis.
Out of 165 patients, 8 (4.8%) were found to have esotropia/micro-esotropia or V-pattern strabismus, and 58 (35.1%) were found to have refractive errors. Table 7 depicts prevalence of refractive errors in study population, by age at examination.
Prevalence of refractive errors among study population, by age (years) at examination.

n, number of eyes.
Data are n (%).
The prevalence of myopia and astigmatism was found to increase with age, while the prevalence of hyperopia increased up to the age of 5, and thereafter decreased (Graph 1).
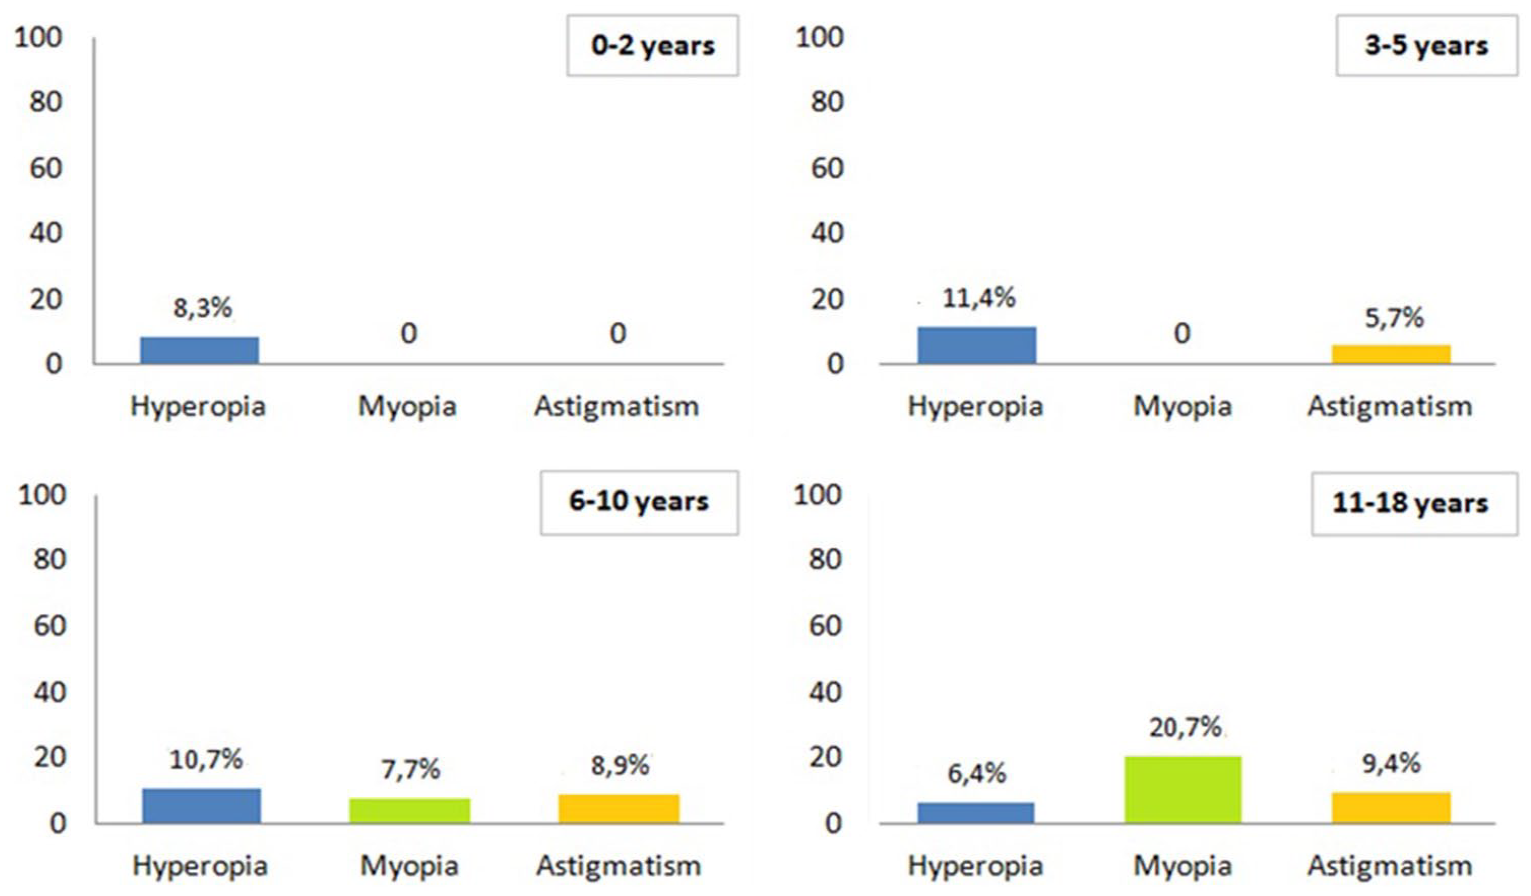
Prevalence (%) of refractive errors among study population, by age (years) at visit.
Overall, 37 patients aged 6 to 18 years in 2018 (74 eyes) underwent imaging of both eyes with OCT and OCTA when the instrument was available. After careful examination, two reports were excluded for partial signal absence (blinks), so 72 OCT and OCTA reports of appropriate quality were taken into analysis.
Among these 37 patients, 19 were males and 18 females, 36 patients had T1DM receiving insulin therapy and 1 had T2DM on oral anti-diabetic drugs. The mean age at DM diagnosis was 8 ± 4 years (range: 1–15 years) and the mean follow-up duration was 5 ± 4 years (range: 0–15 years), with no significant differences between genders. The mean serum HbA1c levels showed Gaussian distribution, ranging from 6.6% to 8.8% (mean: 7.6 ± 0.5%), without significant differences between genders. Out of 36 subjects with T1DM, 10 (27.8%) were on MDI alone and 15 (41.7%) in combination with CGM; 4 (11.1%) were on CSII alone and 7 (19.4%) in combination with CGM.
Overall, 4 (10.8%) subjects had dyslipidemia receiving medical nutrition therapy, and 3 (8.1%) were obese; 9 (24.3%, 5 males and 4 females) had 1 to 4 co-morbidities beyond DM. The most frequent co-morbidities were autoimmune thyroiditis (8.1%, 2 males and 1 female) and celiac disease (8.1%, 2 males and 1 female). The prevalence of systemic complications of DM was 2.7%. No patients were found to have ocular complications of DM during study period. The patient with bilateral congenital cataract, known before DM diagnosis, was not included in the group who underwent OCT and OCTA. A patient (2.7%) was found to have esotropia and 14 (37.8%) were found to have refractive errors.
Among patients who underwent OCT assessment, none showed abnormal macular morphology. Table 8 shows retinal thickness values for each ETDRS sector among study population.
Retinal thickness values for each ETDRS sector among study population.

CMT, central macular thickness; ETDRS, Early Treatment Diabetic Retinopathy Study; IIT, inferior inner thickness; IOT, inferior outer thickness; NIT, nasal inner thickness; NOT, nasal outer thickness; SIT, superior inner thickness; SOT, superior outer thickness; TIT, temporal inner thickness; TOT, temporal outer thickness.
Data available for 72 eyes.
Among patients who underwent OCTA assessment, none showed macular micro-vascular abnormalities neither in the SCP nor in the DCP. Table 9 shows FAZ areas and macular superficial vessel density among study population.
Mean FAZ area in the SCP and DCP and mean macular superficial vessel density among study population.

DCP, deep capillary plexus; FAZ, foveal avascular zone; FSVD, foveal superficial vessel density; IPSVD, inferior PSVD; NPSVD, nasal PSVD; PSVD, parafoveal superficial vessel density; SCP, superficial; SD, standard deviation; SPSVD, superior PSVD; TPSVD, temporal PSVD.
Data available for 72 eyes.
Discussion
Similarly to other diabetic pediatric populations described in the literature, our study group was heterogeneous. All the patients had a diagnosis of T1DM except for one case of T2DM. T2DM was found to be diagnosed in older age and be associated with higher HbA1c variability; as expected significantly positive associations were found between mean HbA1c, HbA1c variability, obesity, and increased serum triglycerides (TG) (p < 0.01). In patients with T1D1 glycemic control was better in patients on CSII than on MDI, especially if combined with CGM. Statistically significant inverse correlations were found between CSII therapy and HbA1c variability (p < 0.05). Patients with dyslipidemia were usually older (p < 0.05), with longer duration of diabetes (p < 0.01). Statistically significant positive correlations were found between increased serum low-density lipoprotein (LDL), reduced serum high-density lipoprotein (HDL), and thyroid disease (p < 0.01), between increased serum TG and mean HbA1c (p < 0.05) and between reduced serum HDL, increased serum TG, HbA1c variability, hypertension, obesity and T2DM (p < 0.01). The number of co-morbidities was positively related to age and duration of DM, HbA1c variability, dyslipidemia, renal and heart disease (p < 0.01). The number of diabetes-related complications was higher in patients with increased HbA1c variability, dyslipidemia, higher number of co-morbidities (p < 0.01), older age and longer duration of DM (p < 0.05).
Proteinuria was the most common complication of DM and was related to number of co-morbidities, hypertension, thyroid disease, male gender, longer duration of DM (p < 0.01) and older age (p < 0.05). Other studies have reported similar results.28–30
The prevalence of strabismus and refractive errors in our cohort were similar to the non-diabetic pediatric populations described in the literature, and no associations were found between ametropia/strabismus and the potential risk factors under consideration.31–33 No cases of DR, cataract, ocular hypertension/glaucoma, diabetic papillopathy, or ocular surface alterations were found among study population. Our results are consistent with recent data in the literature.34,35 Moreover, diabetes-related complications in pediatric patients were reported with various frequencies, depending on age and duration of DM at the time of examination, metabolic control, and pharmacological treatment. As the effect of good metabolic control on prevention and delay of complications of DM has been well established, 36 the relative low prevalence of complications in our study population can be attributed to the relatively good mean glycemic control of our patients. 29 Thus, our data support the role of an improved metabolic control to decrease the incidence of diabetes-related complications.
OCT and OCTA are non-invasive tools enabling reproducible, quantitative assessment of the retinal morphology, thickness, and microcirculation. There are a growing number of studies focusing on OCT and OCTA in diabetic patients. Most of these studies, however, focused on adults and few data are available on diabetic and healthy children.
None of the 72 eyes analyzed were found to have abnormal macular morphology. Central macular thickness (CMT) was positively related with age (p < 0.05) and was found to be thinner in patients with greater HbA1c variability (p < 0.05). The mean thicknesses of inner and outer ETDRS sectors were higher in patients with dyslipidemia, T2DM and related heart disease, lower in obese patients: all ETDRS sectors were positively related to increased serum LDL (p < 0.05) and inversely related to obesity (p < 0.05); only mean temporal outer thickness (TOT) was statistically positively related to T2DM and heart disease (p < 0.01), inversely related to reduced serum HDL and increased serum TG (p < 0.01). No association was found between hypothyroidism and retinal thickness.
Retinal thickness variation among study population was found to correlate to systemic features similarly to other populations described in literature. A review of Subhi et al. 37 found that, in adults, aging is associated with an increase in CMT and a decrease in the overall macular thickness. In literature, there have been conflicting reports on the relationship between retinal thickness, glycemic control and DM. A number of studies showed that increased CMT in diabetic adults without macular edema is positively related to higher HbA1c;38,39 however, Demir et al. 40 found no statistically significant relationship between CMT and HbA1c. CMT was found to be positively related to higher serum LDL in adults 41 and inversely related to obesity in children. 42 Sugimoto et al. 43 reported retinal thickening in adults with T2DM and no clinical signs of retinopathy, on the contrary Bronson-Castain et al. 44 noticed retinal thinning in adolescents with T2DM. Ozturk et al. 45 reported neither hypothyroidism nor its replacement therapy gave rise to any change of retinal thickness in adults.
When comparing our study group values with Ruiz-Ocaña study groups values in both healthy and diabetic children, 46 we found no differences in CMT (p > 0.05), and a statistically significant higher thicknesses in both inner and outer ETDRS sectors in our population (p < 0.01). In the literature, while some studies showed a thickening of the retinal tissues in diabetic adults, others report the opposite, and a number of studies do not appreciate significant differences in one way or another. 46
None of 72 eyes analyzed were found to have any micro-vascular abnormalities neither in the SCP nor in the DCP. FAZ area in both the SCP and DCP were positively related to each other (p < 0.01) and were found to be larger in patients with thinner CMT (p < 0.01) and lower FSVD (p < 0.05) and in younger subjects (p < 0.01).
FAZ area variation among study population was found to correlate to systemic features similarly to other populations described in the literature. Studies in adults suggested that retinal micro-vascular abnormalities in diabetic patients may occur before clinical evident fundus changes,47–50 on the contrary, the only other study in our knowledge who assessed OCTA in children with T1DM and no clinical signs of DR did not confirm these results in the pediatric population. 35 Rommel et al. 51 reported a strong positive correlation between FAZ area in SCP and DCP in adults, and noted that the FAZ area in both plexi was inversely correlated with CMT. Zhang et al. 52 found a significant negative correlation between CMT and superficial FAZ area in children. Mastropasqua et al. 53 showed that in adults, at increasing DR severity, FAZ area increased and parafoveal vessel density decreased in both SCP and DCP. Coscas et al. 54 found that FAZ area was larger in younger patients, while Iafe et al. 55 found that it increased with age in adults.
To the best of our knowledge, this is the first study to describe a positive correlation between FAZ area in the SCP and obesity (p < 0.05).
The FAZ area in the SCP in our study group (199 ± 117 μm2; mean age: 13.1 ± 3.5) was not statistically different from that of 15 eyes from 11 healthy children (260 ± 90 μm2, mean age: 7.6 ± 2.2 years) described by Falavarjani et al. 56 However, it was smaller than that of 15 eyes from 15 healthy children (287 ± 91 μm2; mean age: 8.6 ± 2.2 years) described by Yilmaz et al., 57 that of 75 eyes from 75 healthy children (290 ± 109 μm2; mean age: 11.51 ± 1.91 years) described by Zhang et al. 52 and that of 60 eyes from 36 healthy children (240 ± 78 μm2, mean age: 13.6 ± 1.8 years) described by Gołębiewska et al. 35 The difference might derive from ethnic variation, small sample size, and age variation. 52
According to Zhang and colleagues, FAZ area has a great inter-individual variation in both healthy adults and children. In our study group, FAZ area ranged from 8 to 605 μm2. Similar values have been reported by Zhang et al. 52 (FAZ area range: 1–671 μm2).
Only a few studies in the literature correlate systemic parameters with OCT parameters in diabetic patients, and as far as we know, none in children. Shaw et al. 58 investigated possible correlations between diabetes complications and OCTA parameters in a black adult population and, similarly to how our study, found that only heart disease had statistical correlations to SCP vessel density, while all other parameters, including proteinuria, were not significantly associated with any OCTA measurement in multi-variate analysis. The authors concluded that OCTA measures may serve as valuable biomarkers of systemic vascular functioning in DM and guide the physician to refer patients for closer monitoring of other systemic diseases.
Conclusion
In our study population, which is similar to the diabetic pediatric populations described in literature, the prevalence of systemic complications of DM was low and no patient was found to have any ocular complication of DM nor any macular morphological or micro-vascular impairment, regardless of any potential risk factor.
On the basis of our study results and review of the literature, we propose that screening and follow-up programs for ocular complications of diabetes in children and adolescent may commence later in life and be performed less frequently. Each patient should undergo a complete ophthalmologic examination at the diagnosis of DM and then after 5 years or at puberty whichever comes first, after the onset of puberty, at least every 2 years. Based on clinical judgment, examinations could be more frequent in children with T2DM, as there is a paucity of information in the literature on the incidence of DR in this group.
The prevalence of diabetes ocular complications depends on the metabolic control that is continuously improved by the use of technologies. The use of real-time CGM, and advanced insulin delivery systems, permits to reach goal of HbA1 C < 7% and time spent in range over 70%. These conditions are associated with subsequent reductions in micro- and macro-vascular disease.59,60
The prevalence of strabismus and refractive errors in our study group was found to be similar to the non-diabetic pediatric populations. Therefore, there is no need to screen potentially treatable visual disorders in diabetic children earlier or more frequently than in all other children.
We described the OCT and OCTA patterns in a pediatric population with DM. This exam could be useful in pediatric patients because it is a non-invasive procedure, and it does not need pupilar dilatation. These aspects are fundamental for children because they permit a better tolerance to medical examinations and reduce the time spent in hospital. Larger samples and longitudinal studies are needed to ascertain the role of OCT and OCTA in this population.
Our study has some limitations worth considering. The main limitation of this study is the cross-sectional design, especially for the evaluation of OCT and OCTA characteristics, which may vary consistently even in normal individuals. Other limitations of this study are poor study sample (165 patients enrolled), poor representativeness of the sample (all subjects were Caucasian, and may not reflect the entire cohort of diabetic children in other geographic regions and of different ethnic backgrounds), lack of statistical sample size calculation (all patients meeting the inclusion and exclusion criteria were enrolled in this study) and, not less relevant, lack of control group.