
Abstract
Background:
Sjögren’s syndrome (SjS) is a rare autoimmune disease, and despite our knowledge of SjS, we still lack effective treatments. Chloroquine drugs used to treat autoimmune diseases are still the primary medicine for SjS but increase the risk of chloroquine retinopathy.
Objectives:
The objective of this study is to use Optical Coherence Tomography Angiography (OCTA) images to monitor the microvascular changes in the fundus of SjS patients after hydroxychloroquine (HCQ) treatment and the feasibility of using them as diagnostic indicators.
Design:
This is a retrospective observational cohort study.
Methods:
Twelve healthy controls (HCs group; 24 eyes), 12 SjS patients (SjS group; 24 eyes), and 12 SjS patients treated with HCQ (HCQ group; 24 eyes) were recruited. Three-dimensional OCTA images of the retina were collected, and microvascular density was calculated for each eye. OCTA image segmentation for analysis was conducted using the central wheel division method (C1–C6), hemisphere segmentation method (SR, SL, IL, and IR), and the early treatment of diabetic retinopathy study method (ETDRS) (R, S, L, and I).
Results:
Retinal microvascular density was significantly lower in the SjS patients compared to the HCs group (p < 0.05) and much lower in the HCQ group compared to the SjS patients (p < 0.05). The SjS and HCQ groups differed in the I, R, SR, IL, and IR regions in the superficial and deep retina and the S region in the superficial retina. The ROC curves of the relationship between the HCs and SjS groups and between the SjS and HCQ groups demonstrated good classification accuracy.
Conclusion:
HCQ may contribute significantly to the microvascular alteration in SjS. Microvascular alteration is a potential marker with adjunctive diagnostic value. The MIR and the OCTA images of I, IR, and C1 regions showed high accuracy in minoring the alteration.
Keywords
Introduction
Sjögren’s syndrome (SjS) is a systemic autoimmune disease affecting the exocrine glands (mainly the lacrimal and salivary glands) and has been reported to affect 1–23 persons per 10,000 inhabitants in European countries. 1 The clinical presentation is heterogeneous and may include lesions ranging from cutaneous symptoms to systemic disease. 2 It is most common in middle-aged women but can also be seen in men and children, as well as in the elderly. 3 Dryness is one of the most predominant symptoms of SjS, involving the eyes and mouth. However, the EULAR Sjögren’s Syndrome Patient Reported Index includes only one item related to the eyes. 4 The ocular manifestations usually include a range of symptoms such as dryness, itching, and even bulbar conjunctival congestion, 2 complicated by other ocular pathologies and progressive loss of vision.5–7 Vascular and structural changes in the eye would therefore be necessary for screening and monitoring SjS.
Hydroxychloroquine (HCQ) is the representative drug of the chloroquine class and is now the most commonly used. It is an alkalinized lysosomal drug that differs by only one hydroxyl group from chloroquine but reduces its toxicity while retaining efficacy.8,9 HCQ has been extensively used as an antimalarial drug dating back to the last century, but its potential new uses and benefits are being discovered. It is now used to prevent and treat malaria and autoimmune diseases, such as systemic lupus erythematosus, 9 rheumatoid arthritis, 10 and SjS. 11 HCQ treatment for SjS is long-term and may last for years or even decades. However, the exact duration of drug treatment is not supported by data and needs to be determined on an individual basis. 12 In addition, prolonged use of HCQ can cause adverse reactions, the most serious and worrisome of which is retinopathy, an irreversible condition that may cause permanent loss of vision. 13 The incidence of retinopathy has been reported to be less than 2% in patients treated with HCQ 4.0-5.0 mg/kg for less than 10 years based on actual body weight, while the incidence of retinopathy is higher than 20% in patients treated with doses above this threshold for 20 years or more. 14 Patients taking the drug for 5 years or more should receive regular eye examinations. 14
HCQ was repurposed for SjS treatment. But most recent studies have concluded that HCQ is ineffective in treating SjS, showing little difference compared to placebo in the treatment of ocular or mouth dryness. 15 This may be due to the rating scale based on subjective assessment of the main symptoms such as dryness, fatigue, and pain, symptoms on which HCQ has little effect. Because of these and its retinal toxicity, the EULAR guidelines do not include HCQ as a recommended drug for treating SjS now. 12 Despite these, HCQ remains widely used and may be considered in combination with other medicines for the treatment of SjS. A recent in vitro study showed that HCQ, combined with leflunomide, can inhibit immune activation and treat SjS by blocking its pathological pathway. 16 Hence in this study, we assessed the condition of the patients after about 5 years of treatment with HCQ.
Optical coherence tomography angiography (OCTA) is an emerging non-invasive imaging technique, a functional extension of optical coherence tomography (OCT), which generates angiographic images with high-resolution volumetric blood flow information in a short period of time. 17 OCTA offers significant advantages in blood flow imaging, and its accurate and efficient imaging is widely appreciated, such that it is now being used clinically as a diagnostic tool. Many reports of OCTA being used in various diseases such as thyroid-associated ophthalmology, age-related macular degeneration, and diabetes.17,18
The recognition of SjS retinopathy is still inadequate, and there is still an urgent need for more data and research to support a better understanding and provide effective treatments. And both HCQ 19 and SjS 20 can cause retinopathy, so we speculate that using HCQ for SjS may have more severe consequences. We treated SjS with HCQ and used the OCTA technique to non-invasively examine the patients’ fundus vascular density changes to reveal their effect on SjS retinopathy.
Methods
Study subjects
In this case-control study, 36 subjects were enrolled in this cohort study, all of whom were recruited from the First Affiliated Hospital of Nanchang University between June 2020 to September 2020 (4 months). These 36 subjects were divided equally into three groups of 12 each (24 eyes), including patients with SjS (SjS group), with SjS and taking long-term HCQ treatment (HCQ group), and healthy controls (HCs group). All subjects don’t know the diagnosis details.
Recruitment criteria
All participants were female, and their refractions were less than 3.0 Diopter. The specific recruitment criteria are described in detail below.
HCs were required to be in good health with no physical disease, normal visual acuity (mean monocular visual acuity of both eyes ⩾0.8, log MAR), and no eye disease.
The SjS group inclusion criteria were (1) diagnosis of SjS with a duration of more than 5 years and (2) a positive test for SSA (
Patients with any of the following were excluded from the study: (1) systemic autoimmune diseases; (2) circulatory diseases that affect blood flow to the eye, such as hypertension; (3) history of surgery within the past 6 months; (4) other diseases of the eye, such as glaucoma; (5) patients with contraindications for pupil dilation; and (6) lifestyle habits with severe adverse effects, such as smoking or alcoholism.
Ethical considerations
This research was conducted in accordance with the Declaration of Helsinki and was approved by the Ethics Committee of the First Affiliated Hospital of Nanchang University. Subjects’ right to informed consent was thoroughly respected, and we fully explained this study before participation. All subjects agreed to sign the declaration of informed consent.
Clinical examinations
All subjects in the research underwent a series of clinical evaluations before undergoing OCTA, including autoantibody testing, monocular assessment of visual acuity, ocular staining score (OSS) on a scale of 0–12 points, tear breakup time (tBUT) using fluorescein sodium, tear meniscus height (TMH using the Keratograph 5M corneal topographer), erythrocyte sedimentation rate (ESR), C-reactive protein (CRP), Schirmer test (SIT) (duration: 5 min), intraocular pressure (IOP), and Hospital Anxiety and Depression Scale (HADS).
OCTA
To visualize the retinal cross-section and the microvasculature, OCTA imaging was carried out using the RTVue XR Avanti system (Version 2016.1.0.26 (Optovue, Fremont, CA). And the scanning parameters were set following those reported by Ye et al. 17 This study was set up to operate with A-scans (70,000 per second), and the super light-emitting diodes were 840 nm central wavelength and 45 nm bandwidth. Its axial resolution is 5 µm, and lateral resolution is 22 µm on the plane of the retina. Five repeated B-scans were used for angiography in a pattern of the 216 raster positions (along the y-axis) at each of 216 A-scans (along the x-axis), focused on the foveal center and imaging after 3.9 s of acquisition. Then 1080 B-scans (216 y-positions × 5 positions) were acquired at 270 frames per second. Finally, OCTA images (3 × 3 mm) were acquired by four volumetric scans: two horizontal and two vertical (overall 933 120 A-scans). Three-dimensional 3 × 3 mm en-face OCT angiograms were calculated for each eye. We use the orthogonal scan alignment algorithm described by Lu et al. 21 to correct motion artifacts. Refractive error was measured and corrected for OCTA measurement with the method proposed by Sampson et al. 22
The segmentation of vessels was performed using split-spectrum amplitude-decorrelation angiography (SSADA), which calculates the relationship between the speckle amplitude at the same pixel and position. Using four different frequency bandwidths of OCT, the detection signal-to-noise ratio is improved by reducing the noise of axial motion. Four sets of voxel data are captured at the same resolution (20 × 20 × 20 M rather than 20 × 20 × 5 M in a full-spectrum source). Pixel de-correlation at each frequency bandwidth was handled to compute the average signal.
The full-thickness retinal images were divided into ‘superficial’ and ‘deep’.18,21 Furthermore, the vessels were split into superficial retinal layer (SRL) and deep retinal layer (DRL). The macrovascular (MAR), microvascular (MIR), and total microvascular (TMI) networks were analyzed separately for both SRL and DRL layers.
Vessel density was calculated as described previously. 17 It means the ratio of perfused vessel area to measured area. A threshold algorithm was used to create a binary plate for SRL or DRL en-face images, and each pixel was assigned a 1 (perfusion) or 0 (background). The vascular density was calculated by taking the mean of the skeletonized slab within a region of interest and scaling the result based on the pixel distances (512 pixels per 3 mm). The algorithm scans 3 × 3 mm images and then uses intensity gradient detection from the center to the periphery of the macula to determine the foveal avascular zone center. Bespoke segmentation algorithms were used to create binary images involving inverting, balancing, and removing background noise and non-vascular structures. A single microvascular skeleton image of >25 mm diameter was generated by eliminating minor vessels. Then, the superficial/deep full microvascular image is skeletonized into a 3 × 3 mm macular area.
The following three methods were used to segment the image to analyze the macular area. First, ETDRS segmentation into superior (S), right (R), inferior (I), and left (L) quadrants was used.Second, images were segmented into the superior right (SR), inferior right (IR), superior left (SL), and inferior left (IL) using the hemispheric segmentation method (Figure 2(b)). Finally, the central wheel division method was used to divide the image into six rings with a bandwidth of 0.16 mm (excluding the central depression area, dividing the large ring with a diameter of 2.5 mm and an adjacent band of a width of 0.95 mm).
Statistical analysis
GraphPad Prism (version 9.0.0.0, GraphPad Software) was used for data analysis, and data were expressed as mean ± SD. Data between groups were analyzed using the variance (ANOVA) method with Bonferroni correction for multiple comparisons, and two-sample t-test was used to compare data between groups. P values of <0.05 were considered to be statistically significant. G*Power software version 3.1 was used for post hoc power analysis to evaluate the power. 23 Set parameters default values, then select the VD of the SIL as the index and calculate the actual effect size, and the actual power was finally obtained as 0.99. False discovery rate (FDR) was used to adjust P values as in our previous study. 24 Receiver operating characteristic (ROC) curves were used to compare the micro-vessel density of SRL and DRL between groups.
Results
Baseline data, including age, disease duration, blood pressure, and HCQ duration, are shown in Table 1. No significant between-group differences were found in these data.
Basic info of subjects.

CRP, C-reactive protein; ESR, erythrocyte sedimentation rate; HADS, hospital anxiety and depression scale; HCQ, hydroxychloroquine; HCs, healthy controls; IOP, intraocular pressure; NA, not application; NS, not significant, OSS, ocular staining score; SIT, Schirmer test; SjS, Sjögren’s syndrome; tBUT, tear breakup time; TMH, tear meniscus height.
ANOVA.
t-test.
p = 0.0001 HCs versus SjS group and HCs versus HCQ group.
p < 0.0001 HCs versus SjS and HCs versus HCQ.
p < 0.05 HCs versus SjS and HCs versus HCQ.
After the clinical test results analysis, no significant difference in IOP was found between the three groups. Visual acuity, however, was significantly different between the HCs group (0.89 ± 0.09) and both SjS (0.66 ± 0.18) and HCQ (0.59 ± 0.18) groups (p = 0.0001). Significant differences were also found in tBUT (HCs:13.42 ± 1.22 s, SjS:4.50 ± 1.17 s, HCQ: 4.56 ± 1.25 s), OSS (HCs:0, SjS:3.13 ± 1.30, HCQ:2.96 ± 1.37), SIT (HCs:12.92 ± 0.87 mm, SjS:2.96 ± 1.20 mm, HCQ:3.42 ± 1.28 mm), and TMH (HCs:0.58 ± 0.10 mm, SjS:0.15 ± 0.02 mm, HCQ:0.16 ± 0.03 mm) between both SjS and HCQ groups compared to HCs group (p < 0.0001; decreases in tBUT, SIT, TMH, and increases in OSS in the SjS and HCQ groups compared with HCs). These data suggest that even with HCQ treatment, the ocular surface remains as dry as in the SjS group. Significant differences in ESR (p < 0.0001, HCs versus SjS and HCs versus HCQ) and CRP (p < 0.05 HCs versus SjS) are suggestive of inflammatory responses in the SjS and HCQ groups. The data reported above are shown in Table 1, and OCTA images of the subjects are shown in Figure 1.

Results of OCTA scans of deep and superficial retinal capillary densities in the macula: (a) superficial retinal capillary density was measured in the control group, the SjS group not taking HCQ and the SjS group on long-term HCQ, measuring superficial total microvascular (STMI), superficial macrovascular (SMAR). and superficial microvascular (SMIR) densities respectively. (b) Deep retinal capillary density was measured in the control group, the SjS group without HCQ and the SjS group on HCQ, measuring the density of deep total microvascular (DTMI), deep macrovascular (DMAR) and deep microvascular (DMIR), respectively.
Analysis of SRL and DRL vascular density
We analyzed the TMI, MAR, and MIR density in SRL and DRL (Figures 2(a)–(e) and 3(a)–(e)). Significant differences were found between the HCQ and SjS groups in superficial TMI (STMI; p < 0.0001), superficial MAR (SMAR; p < 0.0001), in deep TMI (DTMI; p < 0.0001), and deep MIR (DMIR; p < 0.05). Significant differences between the SjS and HCQ groups were also found in STMI (p < 0.0001), SMAR (p < 0.0001), superficial MIR (SMIR; p < 0.05), and DTMI (p < 0.0001), DMIR (p < 0.0001).

Comparison of capillary density in the superficial retinal layers of the macula in three groups (a, c–e). Intergroup comparison of capillary density in the superficial retinal macular region in three groups (b).

Comparison of capillary density in the deep retinal layers of the macula among three groups (a, c–e). Intergroup comparison of capillary density in the deep retinal macular region in three groups (b).
On image segmentation (Figure 2(b)), significant differences were found between the HCs and SjS groups in SRL in the following regions: S, I, L (using EDTRS; p < 0.05), and SR (p < 0.05), SL (p < 0.0001), and IL (p < 0.0001) (using the hemispheric segmentation method) and C1, C2, C3 (with central annuli methods; p < 0.05). In addition, significant differences were found between the SjS and HCQ groups in the regions of S, I, R (p < 0.05); SR, IL, IR (p < 0.0001), and C1, C2, C3, C4 (p < 0.0001).
Similarly, significant differences were found between the HCs group and SjS groups in DRL in the regions S, L; SL, IL; C1, C2, C3 (p < 0.05), and between the SjS group and HCQ groups in I, R; SR, IL, IR; C1, C2, C3, C4 (p < 0.0001; Figure 3(b))
The OCTA technique allowed retinal density changes in the HCs, SjS, and HCQ groups to be distinguished with high specificity and sensitivity. ROC analysis results showing the highest AUCs are reported here (Figure 4). Between the group of SjS and HCs, the area under the ROC curve (AUC) for IL in SRL was 1.000 (95% confidence interval [CI] = 1) (Figure 4(a)), and in DRL, DMIR had the highest AUC (0.915, 95% CI = 0.836–0.994; Figure 4(b)). And the results of the SjS and HCQ group in SRL were that the AUC for I, IR, and C1 was 1.000 (95% CI = 1.000; Figure 5(a)), suggesting that these parameters are good indicators of the effects of HCQ use on the retina. In DRL, the R and IR regions both showed the highest positive likelihood ratio, with AUC 0.993 (95% CI = 0.979–1.000[R], 95% CI = 0.978–1.000[IR]; Figure 5(b)).

ROC curves of superficial retinal capillary density in the macula between the HCs group and SjS group (a). AUC: 0.938, 95%CI = 0.869 to 1.000 (STMI); 0.953, 95%CI = 0.891 to 1.000 (SMIR); 0.906, 95%CI = 0.795 to 1.000 (S); 0.904, 95%CI = 0.801 to 1.000 (L); 0.964, 95%CI = 0.921 to 1.000 (I); 0.910, 95%CI = 0.828 to 0.992 (SL); 0.874, 95%CI = 0.772 to 0.976 (SR); 1.000, 95%CI = 1.000 (IL); 0.943, 95%CI = 0.885 to 1.000 (C1); 0.884, 95%CI = 0.786 to 0.981 (C2); 0.799, 95%CI = 0.6613 to 0.9359 (C3). ROC curves of deep retinal capillary density in the macula between the HCs group and SjS group (b). AUC: 0.833, 95%CI = 0.707 to 0.960 (DTMI); 0.915, 95%CI = 0.836 to 0.994 (DMIR); 0.871, 95%CI = 0.763 to 0.978 (S); 0.826, 95%CI = 0.693 to 0.959 (L); 0.846, 95%CI = 0.729 to 0.962 (SL); 0.887, 95%CI = 0.790 to 0.985 (IL); 0.760, 95%CI = 0.612 to 0.907 (C1); 0.863, 95%CI = 0.758 to 0.968 (C2); 0.913, 95%CI = 0.831 to 0.995 (C3).

ROC curves of superficial retinal capillary density in the macula between the SjS and HCQ groups (a). AUC: 0.905, 95%CI = 0.810 to 0.999 (STMI); 0.780, 0.648 to0.911 (SMAR); 0.993, 95%CI = 0.979 to 1.000 (SMIR); 0.658, 95%CI = 0.503 to 0.813 (S); 1.000, 95%CI = 1.000 (I); 0.988, 95%CI = 0.965 to 1.000 (R); 0.859, 95%CI = 0.759 to 0.960 (SR); 0.820, 95%CI = 0.691 to 0.945 (IL); 1.000, 95%CI = 1.000 (IR); 1.000, 95%CI = 1.000 (C1); 0.996, 95%CI = 0.985 to 1.000 (C2); 0.997, 95%CI = 0.987 to 1.000 (C3); 0.943, 95%CI = 0.872 to 1.000 (C4). ROC curves of deep retinal capillary density in the macula between the SjS and HCQ groups (b). AUC: 0.917, 95%CI = 0.838 to 0.995 (DTMI); 0.929, 95%CI = 0.862 to 0.995 (DMIR); 0.658, 95%CI = 0.503 to 0.813 (S); 0.986, 95%CI = 0.963 to 1.000 (I); 0.993, 95%CI = 0.979 to 1.000 (R); 0.884, 95%CI = 0.787 to 0.980 (SR); 0.962, 95%CI = 0.902 to 1.000 (IL); 0.9931, 95%CI = 0.978 to 1.000 (IR); 0.925, 95%CI = 0.855 to 0.994 (C1); 0.950, 95%CI = 0.893 to 1.000 (C2); 0.868, 95%CI = 0.769 to 0.967 (C3); 0.842, 95%CI = 0.728 to 0.956 (C4)
Discussion
In this study, we found that SjS significantly reduces ocular vascular density and that treatment with HCQ exacerbates this phenomenon. In addition, HCQ did little to improve the signs of dry eye caused by SjS.
SjS is a severe systemic disease because its main symptoms (the triad of dryness, fatigue, and pain) severely affect life. Internal organ involvement may lead to additional risks of death. Moreover, SjS is a rare disease in the general population, and patients should visit the relevant clinical institutions for accurate diagnosis and treatment. 12 However, the treatment of SjS has not changed substantially in recent decades, with symptom relief as the treatment goal, and this disease is not yet curable. In order to standardize its diagnosis, the American-European Consensus Group proposed criteria for SjS (Table 2), 25 which are now widely used. The criteria include antibodies to Ro (SSA) or La (SSB) antigens, or both, and a focus score ⩾1.
American–European Consensus Group criteria for Sjögren’s syndrome.
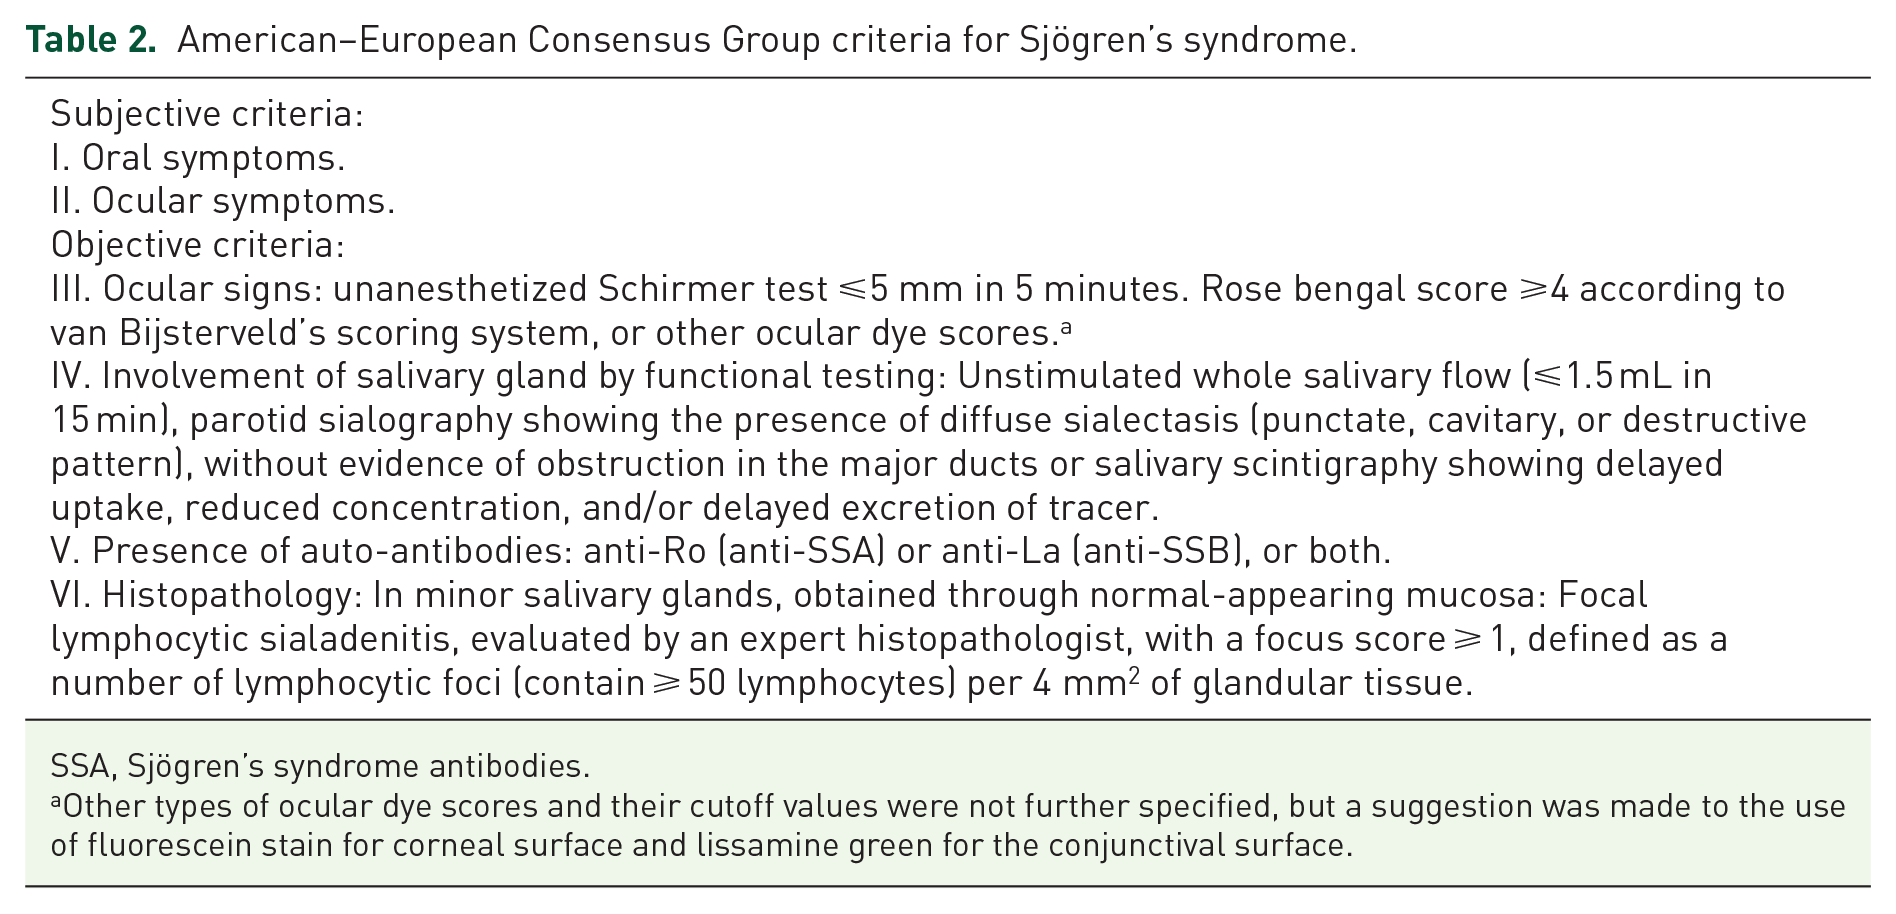
SSA, Sjögren’s syndrome antibodies.
Other types of ocular dye scores and their cutoff values were not further specified, but a suggestion was made to the use of fluorescein stain for corneal surface and lissamine green for the conjunctival surface.
SjS first affects the functional state of the glands, especially the salivary and lacrimal glands. 26 This damage causes one of the main symptoms of SjS – dryness – and dramatically affects the daily life of the patients. Mouse models are widely used in the study of SjS currently. And the lacrimal gland of the diabetic mouse model reportedly exhibits the same characteristics as SjS. 27 It showed that dry eyes are primarily associated with lid gland dysfunction. Decreased density and function of corneal sensory nerve fibers and reduced tear production have also been reported in patients with SjS. 28 In our study, the SjS and HCQ groups showed signs of dry eye symptoms (Table 1) (According to the Dry Eye Workshop (DEWS) II: tBUT < 10 s, SIT < 10 mm/5 min, TMH < 0.15 mm). 29 However, in some cases, patients may have objective signs of ocular dryness. Still, the chief complaint does not include this, perhaps reflecting decreased ocular sensation due to reduced nerve fiber density and function in the advanced stages of the disease.
Goblet cells are important cells that keep the eye moist, and their ability to secrete is closely related to the degree of dryness of the ocular surface, which is an essential indicator of ocular surface health. 30 In SjS, dysregulation of immune mechanisms leads to the development of an inflammatory microenvironment in the body,31,32 which can inhibit the secretory function of the cupped cells and lead to dryness and irregular tear production, affecting the health of the ocular surface. As can be seen from Table 1, CRP and ESR were significantly higher in the SjS group compared to the HCs group, suggesting the presence of inflammation in the organism, while in the HCQ-treated group, they were still substantially higher than the HCs, but decreased compared to the SjS group. SIT scores, tBUT, and TMH all decreased, and OSS increased in the SjS group, reflecting signs of dry eyes in SjS. After treatment, SIT scores, tBUT, and TMH increased in the HCQ group while OSS decreased relatively (compared to SjS), but the improvement was insignificant. These data go some way to validating the above theory.
OCTA is a non-invasive screening technique that provides accurate and reliable retinopathy detection in neurodegenerative diseases and vascular diseases.33,34 We used it to examine retinal vessel density in patients with SjS and those treated with HCQ. The retinal vessel density was significantly reduced in SjS patients compared to controls and lower in patients treated with HCQ. Previous studies have found that reduced vascularity is common in patients with SjS, suggesting that a reduction in fundus vascular density is associated with SjS, which could be a potential marker.35,36 In unilateral retinal vein occlusions, microvascular density is reduced in the ipsilateral eye, and the thickness of the retinal nerve fiber layer and ganglion cell-inner plexiform layer correlates positively with vessel density and perfusion pressure in the capillary plexus. 37 In another report of a systemic disease, diabetes, structural changes in the retina were closely associated with changes in microvascular density, 38 indicating subclinical retinal ischemia with neurodegeneration. 39 It has also been reported that in diabetic retinopathy (DR), ischemic damage to the retina is associated with perfusion pressure, 40 and neuropathy and microvascular changes are highly correlated in early DR. 38
The choroid is one of the most blood-rich parts of the human body and is highly susceptible to inflammation. The activation of immune action causes damage, activating platelets and clotting pathways to form intravascular microthrombi, leading to tissue ischemia and chronic hypoxia. 41 The sensitivity of the choroid to subclinical symptoms can reflect many preclinical symptoms, and similar changes in the retina can be of great clinical value in HCQ for SjS.
Retinal vascular changes provide the basis for early differentiation of neurological disorders. 42 The decrease in vascular density in the HCQ group may be related to the retinal toxicity of HCQ. The inhibition of lysosomal function by HCQ and the endocytosis of retinal pigment epithelium (RPE) cells prevent the degradation of old photoreceptor outer segments. 43 In addition, HCQ entrapment in the RPE causes lipofuscin accumulation, resulting in photoreceptor damage and loss of visual acuity. 43 Despite the above, HCQ accumulates in the RPE and retina, leading to damage to the RPE and choroid. So we hypothesize that HCQ accumulation in the retina leads to retinal ischemia and hypoxia with decreasing vascularity. The exact mechanism is unclear, and further validation is required.
The results of the ROC curves show that the vessel density measured by OCTA is well differentiated. The symptoms of SjS are inherently diverse, and atypical symptoms are challenging to detect early and detrimental to the diagnosis and treatment of the disease. Following treatment with HCQ, patients with SjS experience a degree of variability in their ocular presentation that is difficult to define using standardized tools. Furthermore, at this stage, we lack a standardized tool for ocular indications. In this study, we distinguished the healthy controls and SjS groups and the HCQ-treated SjS group by OCTA, demonstrating that vessel density measured by OCTA is a promising biomarker with potential as a diagnostic of different disease progressions. We are only cautiously exploring the possibility of OCTA as a diagnostic criterion and will later conduct studies using larger samples to determine its diagnostic utility.
This study has its limitations. The low prevalence of SjS disease and the small number of samples that could be obtained may bias the results. The personal habits and environment of subjects also had effects on the results. All data were from the First Affiliated Hospital of Nanchang University. And all subjects were women, as middle-aged women are a high-risk group. For further study, we will strengthen our collaboration with other regional hospitals to reduce bias and collect more data, including men.
Conclusion
Vessel density decreased further after HCQ treatment, demonstrating that HCQ may contribute significantly to the microvascular alteration in SjS. And microvascular alteration is a potential marker with adjunctive diagnostic value. Based on the results, we recommend using the MIR and the OCTA images of I, IR, and C1 regions for monitoring.