
Abstract
Background:
The global burden of hypertension is constantly increasing with adverse cardiovascular and ocular sequelae. The association between elevated blood pressure and choroidal thickness (CT), as assessed via optical coherence tomography (OCT), is poorly understood.
Objectives and Design:
Studies including hypertensive adults and normotensive controls undergoing OCT were evaluated for inclusion in this meta-analysis. The primary endpoint was CT difference between hypertensive and normotensive adults.
Data Sources and Methods:
We conducted a systematic review and after searching 1011 results from MEDLINE, ClinicalTrials.gov, medRxiv and Cochrane Library, six studies were deemed eligible and were pooled according to a random-effect model.
Results:
A statistically significant reduction in choroidal thickness was found in hypertensive adults (n = 454) as compared with normotensive controls (n = 365) [mean difference: −0.77; 95% confidence intervals: (−1.20, −0.34); p = 0.0004]. The main limitations of this meta-analysis are the relatively small population included and the high statistical heterogeneity (I2 = 87%) among the various studies. Of note, after excluding one study the heterogeneity was markedly reduced.
Conclusion:
Choroidal thickness is reduced among hypertensive subjects compared with normotensive controls. This finding mandates further examination in the context of long-term clinical outcomes.
Keywords
Introduction
Systemic arterial hypertension (hereinafter hypertension) is considered the leading culprit of all-cause mortality and morbidity worldwide. 1 Defined as systolic blood pressure (BP) ⩾ 140 mmHg and/or diastolic BP ⩾ 90 mmHg, hypertension affects one in three adults and an increasing trend has been attributed at least partly to ageing of the population and sedentary lifestyle. 2
Besides hypertensive chorioretinopathy, elevated BP is implicated in a variety of ophthalmologic conditions, such as ischemic optic neuropathy, retinal artery or vein occlusion, diabetic retinopathy, glaucoma and age-related macular degeneration.3,4 Hypertensive ocular lesions on fundoscopy reflect a systemic process of vascular damage and have been associated with adverse outcomes, such as stroke, congestive heart failure and renal dysfunction.5,6 Therefore, prompt diagnosis of hypertensive chorioretinopathy is much anticipated to treat patients in an earlier stage. Data from meta-analyses support that intensive BP control halts retinopathy progression in both diabetic and normoglycemic adults.7,8
Optical coherence tomography (OCT) provides a noninvasive, relatively inexpensive, readily available and accurate means of choroid imaging. 9 Choroidal thickness (CT) has been examined across varying cardiovascular risk factors; 10 of note, coronary artery disease,11,12 heart failure 13 diabetes mellitus without diabetic retinopathy 14 and metabolic syndrome 15 have been associated with reduced subfoveal CT. On the contrary, dyslipidaemia has been suggested to increase CT, 16 while pre-eclampsia might reduce it. 17
Based on the above, we aimed to conduct a meta-analysis on the effect of hypertension on CT values compared with normotensive adults.
Methods
Data sources and search strategy
Studies including hypertensive adults and normotensive controls undergoing OCT were evaluated for inclusion in this meta-analysis. Search strategy, study selection, data extraction and data analysis were performed according to the Preferred Reporting Items for Systematic Reviews and Meta-Analyses 2009 guidelines. 18 Two reviewers (K.P. and D.K.) independently identified the relevant studies by an electronic search of the MEDLINE database, ClinicalTrials.gov, medRxiv and Cochrane Library from inception to 13 October 2021. The following search query was used: (‘choroidal thickness’ OR ‘chorioretinopathy’ OR ‘OCT choroid’) AND (‘essential hypertension’ OR ‘systemic hypertension’ OR ‘arterial hypertension’ OR ‘hypertension’ OR ‘elevated blood pressure’ OR ‘blood pressure’). Articles and book chapters cited in the reference lists of initially identified articles by this query were reviewed in order to identify any supplemental studies (‘snowball procedure’). The final list of eligible articles was filtered manually to exclude duplicates.
Inclusion and exclusion criteria
For a study to be eligible, it had to fulfil the following inclusion criteria: (1) evaluated a hypertensive population and a normotensive control population, (2) employed a clearly stated definition of hypertension and (3) reported CT values based on an adequately described OCT methodology. Studies were excluded if they were (1) not reporting data on CT, (2) not including a comparative arm of normotensive controls, (3) case reports, (4) animal studies, (5) secondary forms of hypertension and (6) including ocular pathologies that might have impacted on CT, such as glaucoma, uveitis, prior ocular intervention or surgery, and age-related macular degeneration.
Data extraction
Data were independently extracted and reviewed from each study by two reviewers (K.P. and D.K.). Any discrepancy between data extractions was resolved by discussion or a third reviewer (S.G.). The following data were extracted: first author, year of publication, country, study design, number of patients and controls, population demographics, matching criteria, and descriptive statistics of CT between hypertensive and normotensive adults.
Quality assessment
Quality of the included studies was conducted via the Newcastle-Ottawa Scale (NOS), 19 in which a study was judged on three categories: selection, comparability and exposure/outcome. A nine-point scale of the NOS (range = 0–9 points) was eventually used for the evaluation. Two authors (K.P. and D.K.) discussed the implementation of this quality assessment tool and independently assessed the studies. Studies were defined as high quality if they had more than seven points, as medium quality if they had between four and six points, and as poor quality if they had fewer than four points.
Outcomes of interest
The prespecified primary endpoint was CT difference between hypertensive and normotensive adults.
Statistical analysis
Continuous variables are reported as the mean standard deviation and categorical variables are expressed as percentages. Statistical pooling was performed according to a random-effect model with generic inverse-variance weighting of standardized mean differences with 95% confidence intervals. The presence of heterogeneity among studies was evaluated with the Cochran Q chi-square test with p ⩽ 0.1 considered to be of statistical significance, estimating the between-studies variance tau-square and using the I 2 test to evaluate inconsistency. I 2 values of 25%, 50% and 75% have been assigned adjectives of low, moderate and high heterogeneity. A leave-one-out sensitivity analysis was performed by iteratively removing one study at a time to confirm that our results were not driven by any single one study. Publication biases were assessed by visual inspection of funnel plots. All analyses were performed with Review Manager, version 5.3 (Copenhagen: The Nordic Cochrane Centre, The Cochrane Collaboration, 2014). The guidelines summarized in the MOOSE statements were followed. 20
Results
Search results
Figure 1 shows the PRISMA study search and selection process. The electronic database search identified 1011 studies. After screening, a total of six studies21–26 met the inclusion criteria. Individual study characteristics are presented in Table 1.
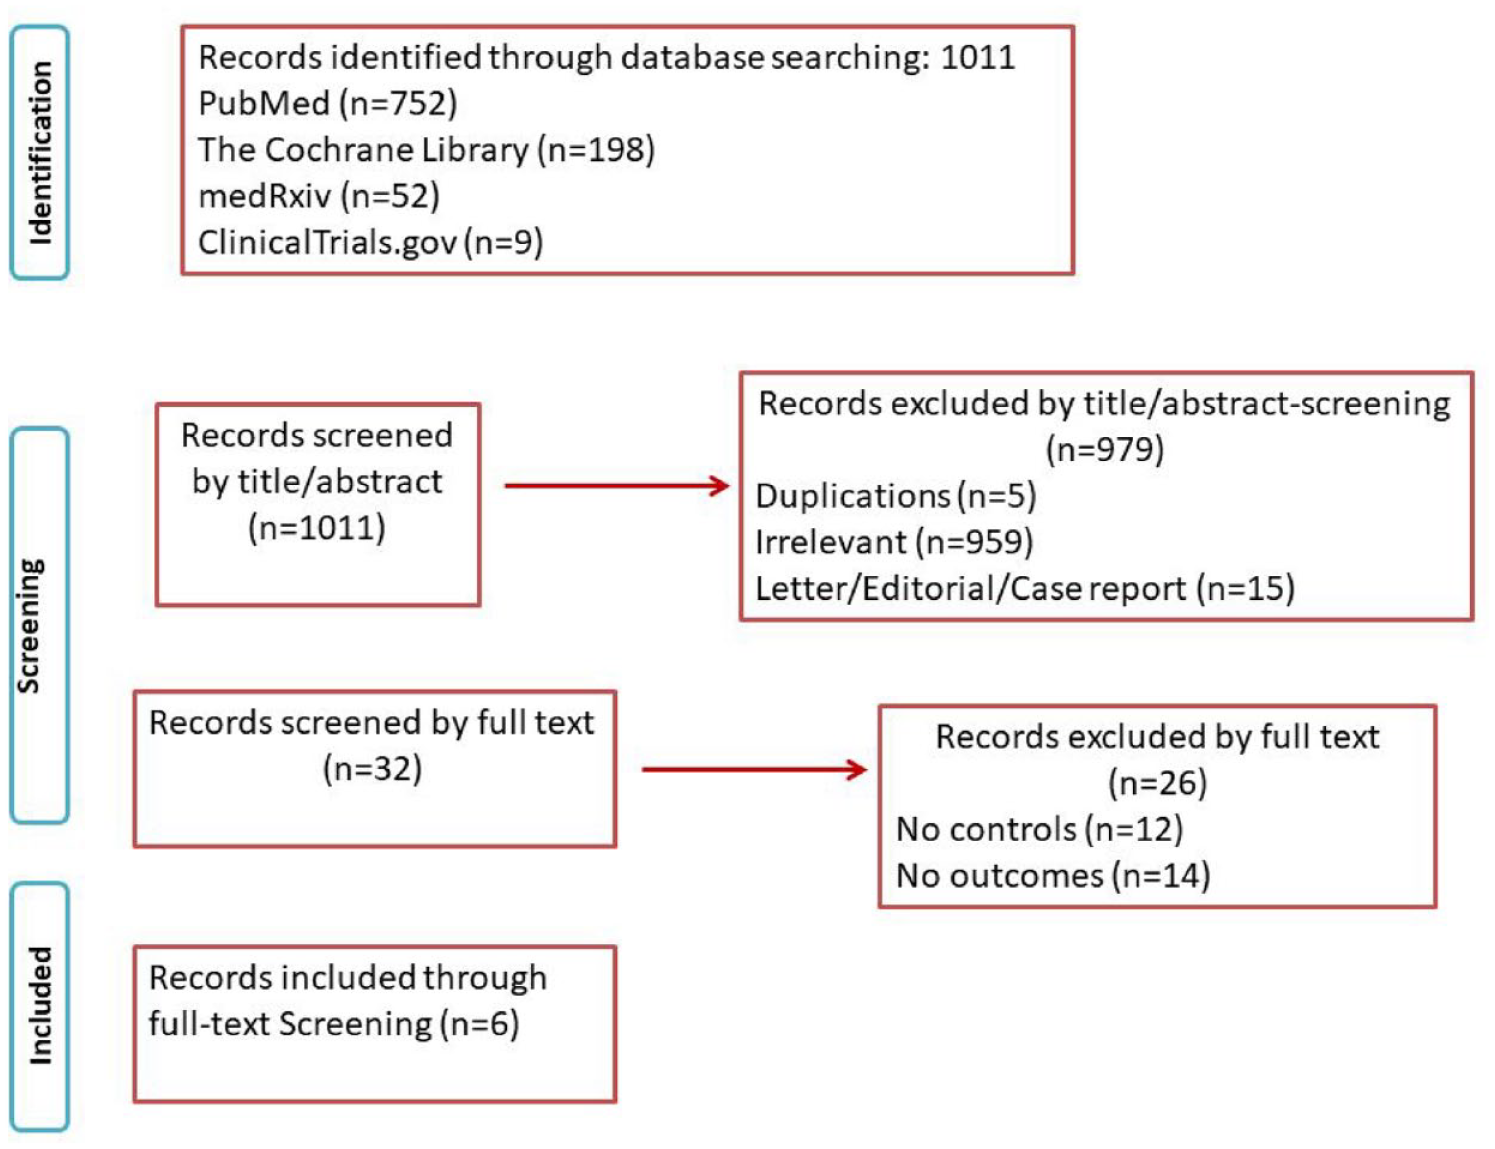
PRISMA flow chart.
Studies characteristics.

ACC/AHA, American College of Cardiology/American Heart Association; CC, case-control; CS, cross-sectional; DM Hx, diabetes mellitus history; ESC, European Society of Cardiology; HTN, hypertension; N, study population; NA, not available; NOS, Newcastle Ottawa Scale; OCT, optical coherence tomography; OCT-A, optical coherence tomography angiography;♁, female; SBP/DBP, systolic blood pressure/ diastolic blood pressure; SD-OCT, spectral domain optical coherence tomography; Tx status, treatment status; y, years.
Clinical data
After combining the eligible studies, it was found that the subfoveal CT was thinner in patients with hypertension [SMD = −0.77; 95% CI: (−1.20, −0.34); p = 0.0004; I 2 = 87%] (Figure 2). A sensitivity analysis was conducted, and it was determined that the study of Gök et al. 21 was a source of heterogeneity. When it was excluded from the analysis heterogeneity was decreased and the results were not altered [SMD = −0.95; 95% CI: (−1.17, −0.73); p < 0.00001; I 2 = 28%]. Of note 63 out of 82 hypertensive patients in the study of Gök et al. featured a nondipping pattern of hypertension, 21 a finding that might reflect underlying comorbidities and poor treatment compliance. 27 Unfortunately, no additional data are provided from the 24-h ambulatory blood pressure monitoring in this study.

Mean difference in choroidal thickness between hypertensive adults and normotensive controls.
We conducted subgroup analysis based on the OCT-equipment that was used for the CT measurements. We were able to pool studies that used spectral domain OCT (SD-OCT) with enhanced depth imaging technique. The results of the subgroup analysis using the SD-OCT equipment were similar to the results of the main analysis as patients with hypertension were found to have thinner subfoveal CT than controls [SMD = −0.93; 95% CI: (−1.18, −0.68); p < 0.00001; I 2 = 44%) (Figure 2).
Since in Donati et al’.s 24 study there are two groups of hypertensive patients, naive and on pharmacological treatment, respectively, a subanalysis was carried out and the results remained the same when we included patients with treated hypertension from Donati et al. [SMD = −0.78; 95% CI: −1.21, −0.35); p = 0.004; I 2 = 87%).
A further subgroup analysis based on the treatment status of patients with hypertension was conducted (Figure 3). Treatment -naïve patients had thinner CT compared with healthy controls [SMD = –0.69 ; 95% CI: (−1.04, −0.33); I 2 = 0%, p = 0.0002, two studies]. There was no significant difference between hypertensive patients on treatment and healthy controls [SMD = −0.73; 95% CI: (−1.55, 0.08); I 2 = 90%, p = 0.08, three studies].

Subgroup analysis based on the treatment status of patients with hypertension and mean differences in choroidal thickness between hypertensive adults on treatment, hypertensive treatment naïve adults and normotensive controls.
Risk of bias assessment
The quality assessment scores of the NOS are shown in Table 1. Three studies23–25 included in the analyses were of high quality, featuring a score equal or higher of seven and the remaining three21,22,26 were of medium quality.
Assessment of publication bias
Funnel-plot distribution of the prespecified outcome indicated absence of publication bias and small study effect (Figure 4).

Assessment of publication bias (funnel plot).
Discussion
In our meta-analysis, we evaluated published studies involving 454 hypertensive patients and 365 normotensive adults and found that subfoveal CT is significantly reduced in the former group. To the best of our knowledge, this is the first meta-analysis to evaluate the effect of hypertension on CT, shedding more light on the under-examined association between elevated BP and CT.
Data from two cross-sectional studies, Singapore Malay Eye Study-2 (n = 540) and The Beijing Eye Study (n = 3060), discuss the association between hypertension and CT.28,29 The first one found an association between hypertension and a thinner choroid in the univariate analysis, but this association was diminished in the multivariate analysis. 28 The latter examined peripapillary CT (PPCT) measurements, which are technically different from subfoveal CT, investigated in our study, and reported no significant association with BP. 29 Furthermore, The Beijing Eye Study found that among patients with hypertension, those with hypertensive retinopathy, especially advanced stages, were associated with increased CT compared with hypertensive patients without ocular findings, which possibly implies the complex effects of different stages of hypertension on choroid. 30 On the contrary, Akay et al. 31 have previously found that hypertensive patients with milder grades of hypertensive retinopathy (maximum grade 2) have thinner choroid that normotensive controls.
Moreover, hypertensive chorioretinopathy has been proven to affect CT in previous studies. Ahn et al. 32 studied 42 eyes with severe hypertension (SBP/DBP ⩾ 180/110) and hypertensive chorioretinopathy, which were found to have increased CT. Interestingly, CT was decreased 1 month after control of BP. 32 Saito et al. 33 studied 10 eyes with acute hypertensive chorioretinopathy, which demonstrated increased subfoveal CT and found that initiation of BP controlling therapy reduced CT, thus indicating that CT is increased in the acute phase of hypertensive chorioretinopathy due to increased choroidal permeability and then decreases as the blood pressure is controlled. The above-mentioned studies imply that advanced hypertensive retinopathy and hypertensive urgencies have different effects on CT measurements compared with essential hypertension with relatively minimal ocular involvement studied in our analysis.
Although it is known that CT demonstrates diurnal variation in normal eyes 34 whether accompanying circadian changes in BP are associated with this variation or not, remains unsettled, since small observational studies report contradictory results.35–39 Taking into account the timing of CT measurement would have been of interest in our analysis, yet only two studies21,26 report the time of the day at which the patients underwent OCT evaluation.
Long-standing hypertension and nondipping pattern (systolic BP decreases less that 10% at nighttime) are associated with lower CT values. 31 The study of Gök et al. 21 found no correlation between nondipping hypertension and CT, and as previously discussed inflated statistical heterogeneity in our analysis. Furthermore, impaired renal hemodynamics, as expressed via renal resistive index ⩾ 75%, are strongly associated with choroidal thinning among hypertensive patients. 40 Interestingly, aortic stiffness, as assessed via 24-h aortic pulse pressure, demonstrates negative association with CT. 39 The above-mentioned data underscore that distinct hemodynamic hypertension phenotypes might drive choroidal changes.
From a clinical perspective, a cross-sectional study of 203 patients showed that subfoveal CT enhances ischemic stroke prediction. 41 A finding of paramount importance among hypertensive patients, since elevated blood pressure accounts for more than half of the population attributable risk of stroke. 42 In addition, Simsek et al. 23 found that CT is an independent predictor of hypertension related target organ damage (namely, left ventricular hypertrophy, hypertensive retinopathy and microalbuminuria).
A small case-control study of 61 patients demonstrated that CT increases after a 6-month course of perindopril arginine 5 mg once daily, while administration of amlodipine 5 mg once daily had no significant effect. 43 Indirect evidence of the effect of BP control on CT also emerges from a small cohort of type 2 diabetes mellitus (T2DM) patients undergoing intensive diabetic control. Intensification of antihypertensive drugs in order to achieve BP below 130/80 mmHg was part of the protocol. Of note, only after 2 weeks of treatment, patients suffering from T2DM achieved higher levels of CT, an effect that was independently associated with diastolic BP reduction. 44 Whether specific antihypertensive medications, such as angiotensin converting enzyme inhibitors, or lower BP targets do eventually revert CT values or prevent stroke among hypertensive adults dictate further testing.
The present meta-analysis has some limitations. First, a relatively small number of case-control studies were included to this analysis, yet given the wide applicability of OCT and the devastating burden of hypertension we believe that our findings support further investigation of BP effects on CT. Second, increased statistical heterogeneity was observed, a finding that was reduced after excluding the study of Gök et al., 21 which could have included a hemodynamic distinct group of hypertensive patients. Of note, relatively large (⩾300 μm) CT values are reported in the control arms of the included studies, yet no study reports a mean CT value above 350 μm, which might have impacted on the observed heterogeneity. Third, we were not able to pool data from other macular quadrants other than subfoveal CT, as those were not provided in the majority of the included studies. Fourth, CT measurement introduces bias when not assessed automatically by the internal software of the OCT device. Finally, the inclusion of studies of moderate quality might have contributed to the increased statistical heterogeneity as well as the fact that treatment naïve and on treatment patients were included in the pooled analysis (see Table 1).
Conclusion
Hypertension is associated with reduced CT as assessed via OCT measurement, a finding that necessitates further testing regarding long-term cardiovascular and ocular outcomes.