
Abstract
The aim of this review article is to describe the specific features of Stargardt disease and ABCA4 retinopathies (ABCA4R) using multimodal imaging and functional testing and to highlight their relevance to potential therapeutic interventions. Standardised measures of tissue loss, tissue function and rate of change over time using formal structured deep phenotyping in Stargardt disease and ABCA4R are key in diagnosis, and prognosis as well as when selecting cohorts for therapeutic intervention. In addition, a meticulous documentation of natural history will be invaluable in the future to compare treated with untreated retinas. Despite the familiarity with the term Stargardt disease, this eponymous classification alone is unhelpful when evaluating ABCA4R, as the ABCA4 gene is associated with a number of phenotypes, and a range of severity. Multimodal imaging, psychophysical and electrophysiologic measurements are necessary in diagnosing and characterising these differing retinopathies. A wide range of retinal dystrophy phenotypes are seen in association with ABCA4 mutations. In this article, these will be referred to as ABCA4R. These different phenotypes and the existence of phenocopies present a significant challenge to the clinician. Careful phenotypic characterisation coupled with the genotype enables the clinician to provide an accurate diagnosis, associated inheritance pattern and information regarding prognosis and management. This is particularly relevant now for recruiting to therapeutic trials, and in the future when therapies become available. The importance of accurate genotype-phenotype correlation studies cannot be overemphasised. This approach together with segregation studies can be vital in the identification of causal mutations when variants in more than one gene are being considered as possible. In this article, we give an overview of the current imaging, psychophysical and electrophysiological investigations, as well as current therapeutic research trials for retinopathies associated with the ABCA4 gene.
Keywords
Introduction
Background
Stargardt disease (STGD1) was first described in 1909 by Karl Stargardt, who reported a macular dystrophy surrounded by yellow-white pisciform flecks in seven patients from two families. 1 In 1965, Franceschetti used the term fundus flavimaculatus to describe the widespread presence of flecks (see Figure 1).2,3 Initially, it was not clear whether STGD1 and fundus flavimaculatus were part of the same disease spectrum or different diseases 3 but genetic linkage in the early 1990s localised STGD1 and fundus flavimaculatus to the same locus on the short arm of chromosome 1. Thus, it was confirmed that they were both part of the same disease spectrum.4,5 In 1997, Allikmets et al. 6 identified mutations in the ABCA4 gene in association with STGD1. Initially, the ABCA4 transcript was only detected in rod photoreceptors,6–8 but later studies detected its presence in cones 9 and more recently within the retinal pigment epithelium (RPE). 10 The ABCA4 gene encodes a protein located in the outer segment disc membranes of rod and cone photoreceptors. ABCA4 has been shown to translocate N-retinylidene-phosphatidylethanolamine and phosphatidylethanolamine from the lumen to the cytoplasmic leaflet of the photoreceptor cell membrane. 11 This action removes waste retinoid compounds from photoreceptors. Mutations in ABCA4 lead to a decrease in transport activity. 11

Colour fundus photograph (a), autofluorescence (b) and optical coherence tomography (OCT) imaging (c) of the same patient showing the typical features of STGD1. (a, b) Flecks are indicated by the green arrows, atrophic macula by the red arrows and the spared peripapillary region by the blue arrow. (c) The extent of the atrophy is shown between the red arrows on the OCT image and the blue arrow demonstrates the spared retinal layers in the peripapillary region.
Epidemiology
STGD1 (OMIM# 248200), also called Stargardt macular dystrophy, juvenile macular degeneration or fundus flavimaculatus, is the most common childhood onset inherited retinal disease (IRD). 12 Spiteri Cornish et al. 13 carried out a British Ophthalmological Surveillance Unit (BOSU) study regarding the incidence of STGD1 in the United Kingdom and found an annual incidence between 0.110 and 0.127 per 100,000 individuals per year. In the United States, Blacharski estimated that the incidence of STGD1 was between 1/8000 and 1/10,000. 12 This figure is commonly quoted in the literature,14–17 but it should be noted that this was derived from an assumption that STGD1 was more common than retinoblastoma but less common than retinitis pigmentosa (RP), which respectively have an incidence of 1/15,000 and 1/5000. 12 Recently, Hanany et al. 18 calculated that the worldwide general prevalence of STGD1 and ABCA4R is 1/6578 and that approximately 1.4 million individuals have an ABCA4R based on parsing data from six worldwide populations.
Natural history
The age of onset in STGD1 is variable and patients with early onset disease typically have more severe symptoms and faster disease progression.16,19–21 A later age of onset (>45 years) is associated with milder symptoms,22,23 better visual acuity (VA),19,20 foveal sparing disease22–25 and slower disease progression.
Inheritance in STGD1
STGD1/ABCA4R are inherited in an autosomal recessive pattern. The phenotypes are variable but with some key distinguishing features. To date, more than 2000 ABCA4 variants have been reported in the literature (www.lovd.nl/ABCA4).
The estimated carrier frequency for ABCA4 disease-causing variants has been reported to range between 4.5% and 10%; these studies included individuals of mainly European descent.26–29 Moreover, Hanany et al. 18 recently proposed that European subpopulations had the highest carrier frequency of 2.5% based on genotype data from six worldwide populations.
Presentation and natural history
Patients typically present due to a reduction in their central vision, because of either blurring of vision typically characterised by increasing difficulty in carrying out tasks requiring detailed vision4,30 or the presence of a central scotoma.31,32 Other symptoms include delayed dark adaptation,33–35 photosensitivity, photopsia and abnormal colour vision.32,36 The typical phenotype in STGD1 is characterised by three features: flecks, macular atrophy and sparing of the peripapillary region.37–39
ABCA4R
ABCA4R include a range of different clinical appearances, or phenotypes, namely STGD1, bull’s eye maculopathy (BEM)40,41 and chorioretinal atrophy. 42 These clinical phenotypes can be further characterised regarding which cells of the retina are affected. Thus, an ABCA4R may be also called a macular dystrophy, or a cone-rod dystrophy depending on which cells in the retina are affected combined with the clinical appearance. In the former, only the macula is affected, and in the latter, there is cone and rod dysfunction as defined by electrophysiological testing.
Specific features of ABCA4R
Flecks
Flecks are usually present at some point in the disease course. They typically develop centrifugally from within the macular region. In some patients, they progress beyond the vascular arcades. Flecks may appear later in patients with a BEM phenotype, (Figure 2) but may be an early feature in patients presenting with chorioretinal atrophy.

Fundus autofluorescence imaging showing a mild ring of ↑ AF signal shown by the yellow arrow (a) 4-year follow-up image shows ↓ foveal AF (increased atrophy) surrounded by flecks developed since the first image (see red arrow) and a ring of ↑ AF signal indicated by the yellow arrow (b).
Macular atrophy
The macular region is typically affected in STGD1 and the atrophic changes are usually progressive. The severity of the macular atrophy can be variable. Some only have a small region of atrophy within the central macular region, while those with more severe disease can develop atrophic regions beyond the arcades or widespread scalloped pattern of atrophy.43,44 The atrophy initially occurs in the RPE and the ellipsoid zone (EZ) layer, but this can progress to involve the choriocapillaris (CC) 43 and the choroidal layers 45 with eventual exposure of the sclera in some cases. 42
Peripapillary sparing
Sparing of the peripapillary retina is considered a diagnostic feature in STGD1.37–39 In ABCA4R, the peripapillary region typically has a normal autofluorescence (AF) signal 39 with a preserved EZ on optical coherence tomography (OCT). 46 However, peripapillary involvement in ABCA4R has been reported.46,47 Burke et al. 46 found that peripapillary involvement was typically seen in patients with cone and rod dysfunction on electrodiagnostic testing (EDT), signifying more severe disease and Hwang et al. 48 proposed that certain combinations of ABCA4 variants might lead to peripapillary involvement. Figure 3 shows loss of peripapillary sparing.

Fundus autofluorescence image showing widespread scalloped pattern atrophy of the RPE and disease involving the peripapillary region.
BEM
BEM may be seen in STGD1 as shown in Figure 4. This particular phenotype has also been reported in other macular dystrophies and in hydroxychloroquine (HCQ) toxic retinopathy.40,41 Flecks may appear later in the disease course in patients with ABCA4 mutations who present with a BEM (Figure 4). Some patients with STGD1 presenting with a BEM have been reported to be asymptomatic or to have milder disease. 41

FAF image showing bull’s eye maculopathy (a) baseline imaging showing ↓ foveal AF signal (yellow arrow) surrounded by a ring of ↑ AF (orange arrow). (b) Follow-up imaging showing area of atrophy ↓ AF signal (yellow arrow) surrounded by new flecks (red arrow).
Foveal sparing disease
Foveal sparing in STGD1 has been reported to occur in between 21% and 59% of patients (Figure 5).23,49–54 It is usually associated with a later age of disease onset (in adulthood and in some cases >45 years of age)49,50 and a milder phenotype. 49 In patients with foveal sparing disease, the fovea usually becomes involved later in the disease course.

FAF image showing a spared fovea, highlighted by yellow arrow.
Chorioretinal degeneration
The most severe ABCA4 phenotype is characterised by chorioretinal degeneration and CC atrophy16,42,55 (Figure 6). In severe cases, the sclera may be visible. Widespread nummular and sparse bone spicule pigmentary deposits may also be observed. 42 Severe early onset disease may be associated with vascular attenuation, peripapillary disease involvement and pigment deposition, sometimes leading to a diagnosis of RP. 56 However, in ABCA4R, there is usually retinal sparing beyond the mid periphery with a clear edge at the nummular areas of atrophy, both features differing from typical RP. 57 Tanaka et al. proposed the term ‘rapid-onset chorioretinopathy’ to describe a distinct ABCA4 phenotype, caused by deleterious bilallelic null mutations. This group is usually characterised by abnormal cone and/or rod function on electrophysiology testing, symptomatic onset before 10 years of age and significant choroidal thinning within the first 20 years of life.29,56,58,59

Retinal imaging showing a severe chorioretinal atrophy phenotype in a Stargardt patient. (a) The colour fundus image shows widespread macular atrophy extensive mid perihpeary involvement with pigmentary deposition. (b) The autofluoresence image shows the extent of the RPE atrophy with scalloped edges with some sparing of the peripapillary region and a heterogenous background AF signal in nonatrophic areas.
Subretinal fibrosis
Subretinal fibrosis can occur following minor ocular trauma in patients with STGD1.60–65 Initially, an orange pigmented region (thought to be lipofuscin) is observed, which gives way to subretinal fibrosis and RPE hypertrophy. 64 Grandinetti et al. 65 suggest that ocular trauma causes a release of excess lipofuscin which disrupts the RPE and leads to subretinal fibrosis and RPE hypertrophy. Similarly, Gass et al. 63 suggest that stored lipofuscin leads to engorgement and hypertrophy of the RPE and that trauma causes RPE disruption. Del Buey et al. 62 have linked subretinal fibrosis to the release of growth factors from the RPE in response to injury. However, subretinal fibrosis has also been reported in patients without a history of ocular trauma.60,64 Rossi et al. 60 found that patients without a history of ocular trauma played competitive sports and inferred that microtrauma could potentially lead to subretinal fibrosis. Patients with STGD1 should be given lifestyle advice regarding use of eye protection when playing competitive sports to avoid even minor ocular trauma which can potentially lead to RPE damage.60,65
Other rarer phenotypic features
Rare phenotypic features previously described in STGD1 include small parafoveal white dots, 49 hypopigmentary macular changes, 66 bone spicules 67 and peripheral pigmentary deposition. 68 Very rarely, choroidal neovascularisation (CNV) can occur in association with STGD1. A CNV, identified in one eye in a patient with two ABCA4 variants, was reported by Van-Westeneng et al. 23 However, in the majority of the cases, only one variant or no ABCA4 variants have been identified so they may not be true ABCA4-related phenotypes.69–71
Genotype-phenotype correlation in ABCA4R
It was initially thought that disease severity was inversely proportional to the amount of functional ABCA4 protein. For example, cone-rod dystrophy, 72 RP,59,73 CC dystrophy 43 and rapid-onset chorioretinopathy 57 have all been associated with severe variants, such as nonsense mutations, while missense variants that produce some functioning protein are noted to be associated with a milder phenotype.27,74,75 However, the relationship is more complex than this. Certain variants, such as deep intronic variants originally thought to not affect splicing of the protein, have now been identified to have a significant effect on protein function and have been linked to severe disease.76–78 Genotype-phenotype correlation is beyond the scope of this review and is investigated in further detail by our group in a genotype review. Genetic modifiers and gene-to-gene interactions are expected to have a significant role in phenotype variation. 79
Phenocopies
A number of IRDs share similar features to STGD1 which makes distinguishing them difficult. This phenomenon is known as phenocopies. They differ in their genotype and often some aspect of their phenotype. Phenocopies relevant to ABCA4R include STGD 3 and 4. STGD3 is associated with variants in elongation of very long chain fatty acids protein 4 (ELOVL4) and is inherited in an autosomal dominant manner.80,81 STGD4 is associated with variants in Prominin 1 (PROM1),82,83 as well as HCQ retinopathy, but this can be excluded by a history of HCQ ingestion and negative ABCA4 testing. Natural history studies to investigate these phenocopies will be important in identifying features that may distinguish them from ABCA4R. Currently, the natural history of PROM1-related retinopathy is being investigated in the ProgStar-4 study. 84
Peripherin 2 (PRPH2) is associated with both pattern and pseudofundus-flavimaculatus type phenotypes, and in this context is the most commonly encountered ABCA4 phenocopy. PRPH2 is inherited as autosomal dominant and shows reduced penetrance with variable expressivity. Other phenocopies are seen associated with variants in CDHR1, CERKL, CRX and RPE65. 82 Differing features aid in distinguishing these conditions: the inheritance pattern, and certain specific features, for example, lack of AF signal in RPE65, 85 bone spicule pigmentation extending to the far periphery (not usually seen in ABCA4R) among others. The presence of flecks in a family with an autosomal dominant inheritance makes an ABCA4R unlikely, unless there is consanguinity with pseudo-autosomal dominant inheritance.
Imaging relevant to STGD1
Multimodal imaging is instrumental in diagnosing ABCA4R, and typically includes colour fundus photographs, fundus autofluorescence (FAF) imaging and spectral domain OCT (SD-OCT). The role of OCT angiography (OCTA) is yet to be determined. Since the introduction of FAF, fundus fluorescein angiography (FA) is very rarely used now in the diagnosis of IRD. Indocyanine green angiography (ICGA) has not been found to be particularly helpful in characterising ABCA4 phenotypes. High-resolution retinal imaging with adaptive optics scanning laser ophthalmoscopy (AOSLO) has been recently introduced and is at present primarily a research tool. However, it can provide a highly sensitive assessment of photoreceptor structure and has been used to identify areas of increased photoreceptor spacing, which suggests photoreceptor loss, in retinal areas appearing normal on OCT and FAF. 86
Colour fundus photography
The first fundus camera was made commercially available following its development by Carl Zeiss in 1926. Fundus cameras traditionally use a white flash, provide images with realistic colour and capture a 30° or 45° field of view. 87 Widefield retinal cameras became commercially available in 1997 and used a contact lens with fibreoptic illumination to capture up to 130° of the retina. 88 The most recent advance in fundus photography includes the development of ultra-widefield (UWF) imaging systems. These systems can image the far peripheral retina as they have a field of view of up to 200°. Widefield imaging systems typically use a confocal scanning laser ophthalmoscope with combinations of green, red and blue laser light. 89 The benefits of these imaging systems are that they do not rely on pupillary dilation or a contact lens to take the image. 89 Some disadvantages of different types available include inaccuracy in retinal colour reproduction, image clarity, apparent vignetting and difficulty in obtaining accurate measurements due to a lack of image standardisation with respect to a specific axis of the eye. 89 A comprehensive review of the types of cameras available is beyond the scope of this review, but Chen’s comparison of four UWF viewing systems is very informative. 90
Colour fundus photography provides documentation of the type of retinal changes observed and extent of the disease. The Fishman classification is most frequently used and is based on the presence of the flecks and macular atrophy 91 (Table 1 and Figure 7).

Colour photographs illustrating the Fishman classification. (a) Fishman class 1 with foveal atrophy and flecks within the parafoveal area. (b) Fishman class 2 showing central macular atrophy and widespread flecks that extend beyond the vascular arcades. (c) Fishman class 3 showing macular atrophy with widespread flecks that extend beyond the vascular arcades and resorption of the central flecks. (d) Fishman class 4 showing extensive macular atrophy, resorption of the flecks and pigmentary deposition. 91
The Fishman classification for colour fundus photographs. 91

FAF imaging
The two main methods used to capture FAF images are confocal scanning laser ophthalmoscopy (cSLO) and fundus photography using a standard fundus camera with modification of the excitation and barrier filters. 92 cSLO is the more frequently used method and acquires images using a low power laser beam, which is swept across the retina in a raster pattern. 93 By contrast, the fundus camera takes one photograph and summates the AF signal simultaneously emitted from the retina and RPE. 92 However, a phenomenon of pseudo-AF caused by scattered light from outside the retina can be achieved when using a fundus camera. 94
Light is used to excite fluorophores and different wavelengths of light can be used depending on the object of interest. FAF with short wavelength light [short-wavelength fundus autofluorescence (SW-FAF); 488-nm excitation, 500-nm cut-off filter] is the most commonly used, and is thought to be derived primarily from lipofuscin, a by-product of the visual cycle. FAF with near-infrared light [near infrared-wavelength fundus autofluorescence (NIR-FAF); 787-nm excitation, 830-nm cut-off filter] appears to arise mainly from the melanin in the RPE and choroid. 95
UWF imaging systems provide FAF imaging of up to 200° using green light rather than the blue light used in SW-FAF images. 96 UWF images are affected by distortion (horizontal image stretching) and regional variations in the contrast level (limited contrast superiorly and inferiorly). 97 Care needs to be taken when comparing UWF-FAF images with SW-FAF images due to these differences and the different wavelengths of light used for FAF. For example, green light is better at imaging the fovea compared with blue light 98 because green light is less absorbed by the macular pigment 99
On SW-AF images, regions with increased AF signal have higher levels of lipofuscin, while areas with reduced AF signal signify atrophy or degeneration of the RPE. 100 FAF imaging is increasingly being used in the diagnosis of IRD as it is noninvasive and has almost completely replaced angiography for this indication.101,102 FAF imaging is a valuable tool to assess and characterise IRDs. The specific features of AF aid in diagnosis and help to guide genetic testing. FAF imaging is especially valuable in assessing STGD1 patients because it can detect retinal changes manifested by an increase in AF signal in the retina before the onset of symptoms, and before changes on fundoscopy and colour fundus imaging become visible. 103 Detecting the presence of flecks before they become apparent on fundoscopy or colour imaging 104 enables patients to receive an early diagnosis. AF can also be used as a sensitive tool to record change over time.105,106
Flecks typically have an increased AF signal on SW-FAF. Later in the disease process, they can undergo reabsorption, which is then associated with a decreased AF signal. FAF highlights disease features that are not always apparent on colour imaging or fundoscopy, such as the true extent and distribution of flecks and areas of RPE degeneration and atrophy. One of the classic features of STGD1 is peripapillary sparing; FAF imaging is the best imaging modality to demonstrate this (Figure 8(a)).37–39 Care needs to be taken when interpreting FAF images, for example, decreased AF signal can arise due to masking of the retina or RPE as seen with a retinal bleed, fibrosis or increased pigmentation. An increased AF signal may be associated with intraretinal and subretinal fluid or drusen.96,100

FAF images in patients with ABCA4R. (a) Atrophic macula surrounded by a region of heterogenous background AF with flecks with relatively normal AF signal in peripapillary area. (b) Extensive macular atrophy involving the peripapillary region with flecks in the peripheral retina. Despite the severe phenotype, there is a remnant of preserved peripapillary tissue nasally. The spared peripapillary area is marked by the yellow arrow.
Both SW-FAF and NIR-FAF (Figure 9) are useful in monitoring for disease progression in ABCA4R. This is because the AF signal is emitted from different parts of the retina. On SW-FAF imaging, flecks usually have an increased AF signal and areas of RPE degeneration or atrophy have reduced or absent AF signal, respectively.105–111 Using NIR-FAF imaging, flecks are associated with a decreased AF signal and are occasionally surrounded by a halo of reduced AF signal. On NIR-FAF imaging compared with SW-FAF imaging (Table 2), flecks appear larger, 112 can be more visible in the periphery and appear earlier.53,99,112–114 Sparrow et al. 114 detected an earlier reduction in AF signal from resorbing central flecks using NIR-FAF when compared with SW-FAF. The area of RPE atrophy has also been observed to be larger on NIR-FAF compared with SW-FAF.99,115

(a) Short wavelength-AF image showing flecks associated with a ↑ AF signal pertaining to the flecks (see red arrows), which extend beyond the vascular arcades and a central region of macular atrophy (absent AF signal) with a small foveal remnant. The foveal remnant is indicated by the yellow arrow, atrophic regions are highlighted by blue arrows, a fleck with a ↑ AF signal is shown by red arrows (b) Near infrared AF image of the same patient showing flecks with predominantly ↓ AF (see orange arrow) that are more eccentric. The areas with ↓ and abnormal AF signal are also larger compared with the SW-AF image. The spared fovea can be seen in both images. The spared fovea is shown by the yellow arrow, atrophic regions by blue arrows and fleck with ↑ signal (red arrow). (c and d) Comparison between the areas of abnormal AF on (c) SW-AF imaging and (d) NIR-AF in the same eye of a different patient. The area of abnormal AF is larger and more eccentric on the NIR-AF image compared with the SW-AF image.
Summary of retinal appearance comparing SW-AF and NIR-AF in patients with STGD1.
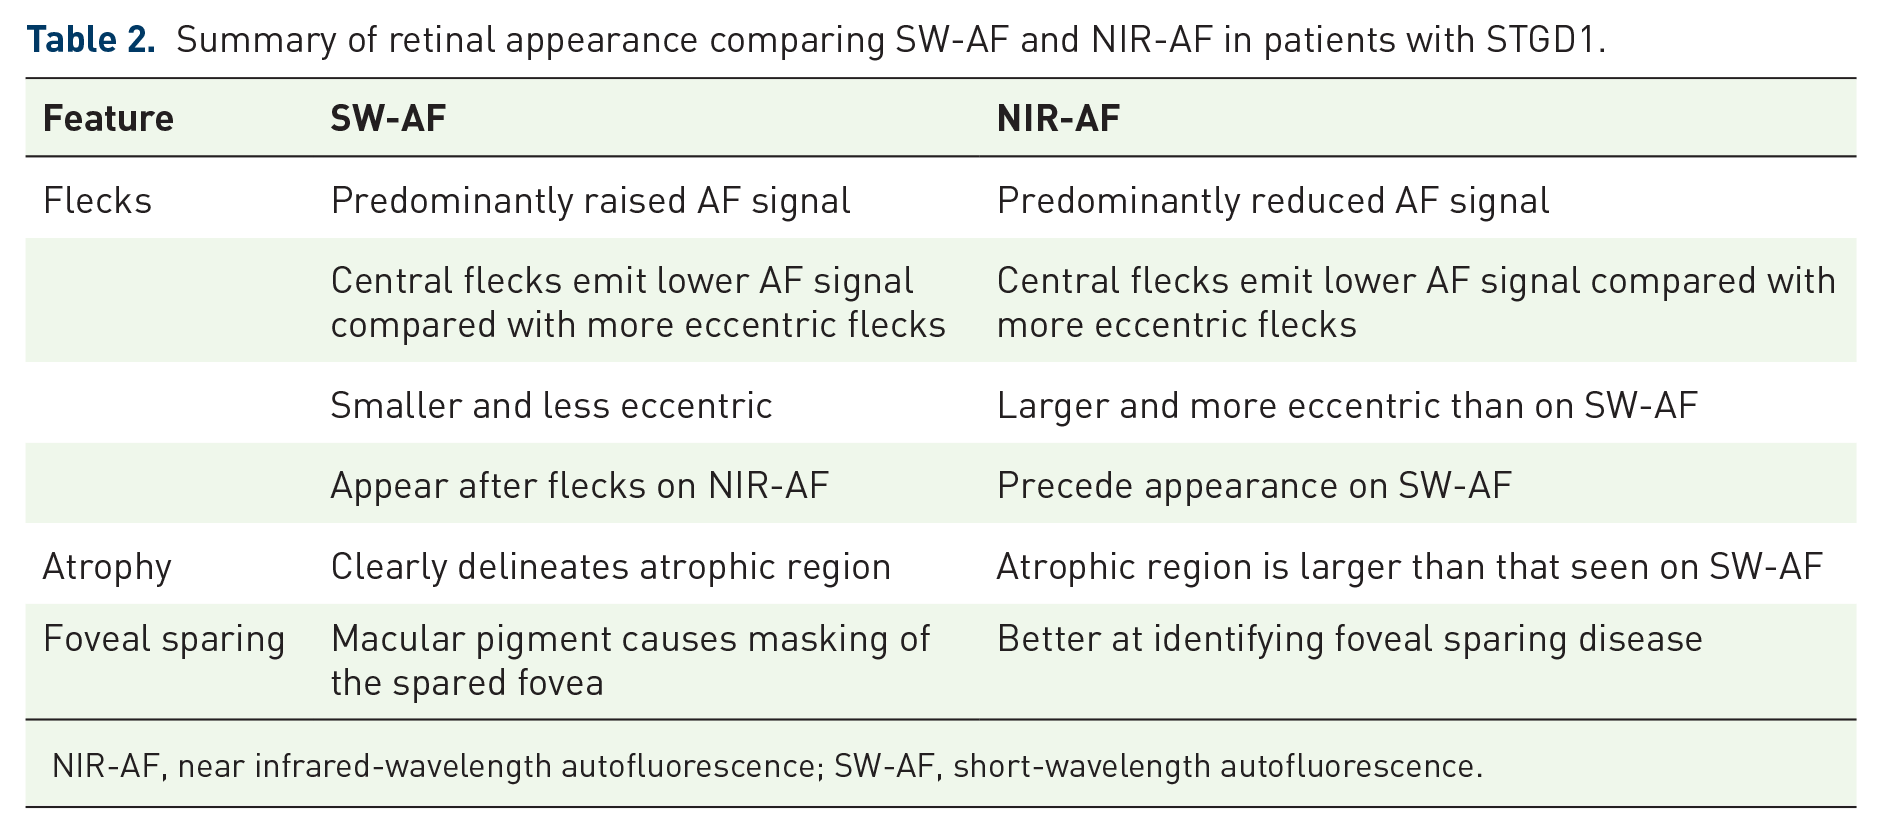
NIR-AF, near infrared-wavelength autofluorescence; SW-AF, short-wavelength autofluorescence.
A demarcation line in the inferonasal area that separates a region of reduced nasal AF and increased temporal AF can be seen on both NIR-FAF and SW-FAF imaging in patients with STGD1,99,116 and this demarcation line is respected by both the flecks and areas of mottled AF. 117 Duncker et al. 118 proposed that this demarcation line represents the closed optic fissure. Comparison of AF imaging in RP patients similarly showed this demarcation line in both modalities, while in normal healthy individuals, the demarcation line was only identifiable on SW-AF imaging which led the Duncker et al. 117 to suggest that this sign could be used as a marker for disease. UWF-FAF imaging has enabled visualisation of peripheral retinal changes in STGD1 not visible on standard imaging.116,119 NIR-FAF and UWF-FAF imaging are better than SW-FAF at identifying foveal sparing disease and it is thought to be the case that the 787-nm wavelength of light is absorbed less by the macular pigment thus causing less masking.53,99
There are a number of AF-based STGD1 phenotype classifications,99,120,121 the most widely used is from Fujinami et al. who describe the AF appearance on SW-AF images of the posterior pole. Their classification comprises three different groups according to specific AF features (Table 3 and Figure 10).107,122 This classification is helpful in categorising the severity of STGD1 on its clinical appearance and can be mapped to retinal function. 107 A phenotypic classification for UWF-FAF images has been described by Klufas et al., 123 which classifies disease severity into three groups based on specific retinal features (Table 4). Kuehlewein et al. have also used the terms definitely decreased AF (DDAF) and questionably decreased AF (QDAF) to describe the AF level compared with the darkness level of the optic nerve head. DDAF describes an area with greater than or equal to 90% of the darkness of the optic nerve head and QDAF to describe areas with a darkness level between 50% and 90% of the optic nerve head darkness. These areas can be semi-automatically measured using RegionFinder module of Heidelberg Eye Explorer software 124 and is now an established way of grading the AF appearance in STGD1 and is being used in the ProgStar study. 17 This grading has been used to determine suitable patients for Emixustat treatment in the Safety and Efficacy of Emixustat in STGD1 (SeaSTAR) trial. 125

Images from our cohort using the Fujinami AF classification. (a) Type 1 showing ↓ foveal AF signal with a small number of flecks and a homogeneous background AF. (b) Type 2 showing ↓ macular AF signal surrounded by a heterogenous background AF and widespread flecks extending beyond the vascular arcades. (c) Type 3 showing multiple areas of ↓ AF surrounded by a heterogenous background AF and widespread flecks extending beyond the vascular arcades. 122
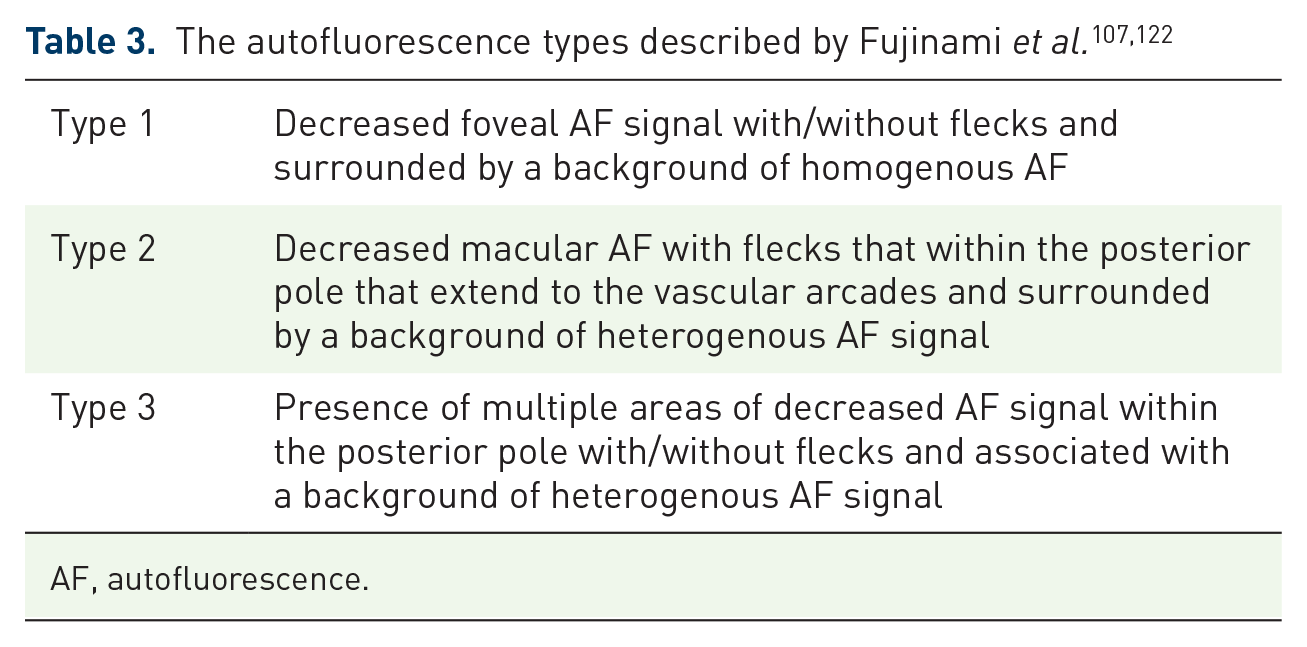
AF, autofluorescence.
The autofluorescence types in UWF-AF described by Klufas et al. 123

UWF-AF, ultra-widefield autofluorescence.
Several studies have looked at the progression of atrophy in macular disease. This is a useful way of assessing the rate of disease progression and severity. This is likely to form part of the routine assessment of response to treatment and is an ideal modality to capture this information. An area of macular atrophy can be measured over time to monitor the progression of disease.24,105,109,126–129 Measuring the growth of the atrophic lesions on FAF imaging is the primary outcome measure of the largest natural history study in STGD1 to date, the ProgStar study. 17 Faster progression has been observed with the following features: early onset disease,105,126 larger area of RPE atrophy at baseline imaging,105,109 presence of a heterogenous background AF signal,105,109 presence of flecks beyond the vascular arcades,105,109,121 a worse VA 116 and larger scotomas. 130 In the majority of cases, longer disease duration is associated with larger areas of RPE atrophy.105,131 However, the main finding in the ProgStar study was that the progression rate corresponded to the area of decreased AF and that the differences described earlier were not observed when analysis was corrected for the baseline size of the lesion.105,109 The area of RPE atrophy is usually symmetrical126–128,132 meaning that one eye can be used as a control in therapeutic trials. Lambertus et al. 132 found that there was better correlation in the area of atrophy in patients with early onset disease and suggested that patients with early onset disease would be more suitable for assessing treatment efficacy in therapeutic trials.
Cideciyan et al. 133 were the first to describe the use of reduced illuminance SW-FAF and NIR-FAF imaging in STGD1 patients due to concerns that frequent SW-FAF imaging could theoretically lead to an increased rate of lipofuscin accumulation and/or increase its toxicity. They observed that reduced illuminance FAF imaging provided similar information on the disease profile compared with the conventional FAF imaging. 133 Strauss et al. 134 observed that reduced illuminance FAF was similar to conventional FAF imaging when assessing the area of DDAF but that there was a difference between the two modalities when assessing areas with poorly demarcated QDAF.
Both SW-FAF and NIR-FAF imaging modalities have a role in assessing patients in the clinic setting. Both imaging modalities will be highly relevant to therapeutic trials as SW-AF enables clear delineation of retinal changes and NIR-AF can be used to identify earlier disease. Predicting future disease progression could help identify diseased areas earlier in patients recruited for therapeutic trials.
An early phenotype that the authors have noticed in some STGD1 patients is the presence of increased foveal AF signal in patients with very mild symptoms (see Figure 11). This could either represent an early phenotype in STGD1 that will progress to the more typical features associated with the disease, or a mild phenotype detected in patients now because of sophisticated imaging. How it progresses and its rate of progression needs to be evaluated.

Fundus autofluorescence image showing discrete focal parafoveal area of ↑ AF signal.
Quantitative AF imaging
Quantitative AF (qAF) was described by Delori et al. 135 in 2011 and introduced a standardised approach to assessing lipofuscin levels in the retina. qAF requires bleaching of the photoreceptors (20 s for rods and 30 s for cones) to reduce the absorption of photopigment, followed by the acquisition of SW-FAF images from which the AF signal intensity is calculated. 135 In normal patients, qAF levels increase with age, 136 are highest in the superotemporal quadrant 136 and are lowest in the inferonasal quadrant.137,138 Greenberg et al. 136 found that White patients had a higher qAF compared with Black and Asian patients, and that females have a significantly higher qAF level compared with males. The distribution of qAF level in different regions of the retina has been shown to be similar between STGD1 patients and normal patients meaning that these changes seen in ABCA4R can be compared with normal controls.137,138
In ABCA4R, the qAF levels are typically raised even when the fundus appears normal. 137 qAF imaging may be useful in diagnosing ABCA4R when there is uncertainty regarding the diagnosis. It could be useful in patient with BEM or cone dystrophy where an ABCA4R is suspected but only one ABCA4 variant has been identified. 40 This is because a higher qAF signal may be seen in early disease ABCA4R compared with other genetic causes of these phenotypes. Sparrow’s group investigated the levels of qAF and found ABCA4 patients had higher qAF values than those seen in PRPH2 patients. 139 However, Gliem et al. 140 noted that elevated qAF is present in different IRDs in particular those caused by variants in ABCA4, PRPH2, PROM1, CRX and CDHR1, but that it depended on the stage of disease. It is clear that qAF levels are highest in the initial stages of disease40,137,141 and decrease in later stages of disease as atrophic changes predominate. 142 Therefore, in severe ABCA4R, qAF levels do not increase with age as seen in healthy controls.40,137,141 However Müller et al. 142 observed that patients carrying two null variants had substantially elevated qAF levels and that milder ABCA4 variants were linked to a mild elevation in qAF. Patients carrying the p.(Gly1961Glu) and p.(Asn1868IIle) variants can have qAF levels that fall within the upper end of the normal range; therefore, this imaging modality is not completely reliable in confirming ABCA4R.44,142
However, qAF could be a useful biomarker for assessing lipofuscin levels following therapeutic interventions to aid assessment of efficacy of therapies. It is important to note though that qAF imaging using the 488-nm wavelength bleaches the photoreceptors and may thus be potentially retinotoxic. 133 NIR-AF may be a potential safer alternative. Another limitation is variability in test–retest results which was found to be ±9.4% in normal eyes under standardised conditions. 136
Fluorescence lifetime imaging ophthalmoscopy
Fluorescence lifetime imaging ophthalmoscopy (FLIO) enables measurement of the lifetime of fluorophores by measuring the average time taken between absorption of light that excites the fluorophores, causing them to emit light at a longer wavelength, and the time for the fluorophores to return to their normal energy level. A 473-nm laser is used to excite fluorophores and two emission spectra can be detected, the short wavelength between 498 and 560 nm and the long wavelength between 560 and 720 nm. 143 A shorter lifetime AF is shown as red AF signal and longer lifetime AF is shown as a green AF signal. 143 In healthy eyes, the lifetime AF is shortest within the foveal region, higher in the peripheral retina and increases with age. 144
In STGD1, flecks initially emit red AF signal and gain lifetime AF with time. Older flecks within the central retina typically have a longer lifetime AF, while peripheral flecks have a shorter lifetime AF. Resorbing flecks have a central longer lifetime AF surrounded by shorter lifetime AF. 145 The atrophic regions emit both short and long lifetime AF signals. Dysli et al. 145 suggested that the long lifetime AF arose from underlying structures such as the choroid and the short lifetime AF was emitted from macular pigment. Again, the usefulness of this modality may be limited by the wavelength and its potential effects on the retina.
Angiography
FA is a method of imaging the retinal and choroidal circulation by injecting fluorescein dye into the venous circulation. Fluorescein absorbs blue light (465–490 nm) and emits green light (520–530 nm). 146 The high molecular weight of the dye means that it is too large to escape from the retinal circulation and is unable to diffuse through the RPE, 147 thus enabling clear imaging of the vasculature.
ICGA is primarily used to image the choroidal circulation. 146 Indocyanine green dye is injected into the venous circulation. The dye is excited using an infrared excitation light of 800 nm and emits light with an 835-nm wavelength. This wavelength can penetrate the RPE and ocular pigments and enables good visualisation of the choroidal circulation because 98% of indocyanine green is bound to protein meaning that there is minimal diffusion through the CC. 148
Fundus FA in STGD1 and ABCA4R
Historically, the appearance of a dark choroid (Figure 12) on FFA was considered a diagnostic feature of STGD1. It occurs due to the raised lipofuscin levels which block the fluorescence from the choroid.47,149,150 However, the dark choroid sign is not always present; it is has been reported to be absent in 35% of paediatric patients 104 and 33.3–80%52,23 of adult patients. It is also less frequently seen in patients with the p.(Gly1961Glu) variant. 151
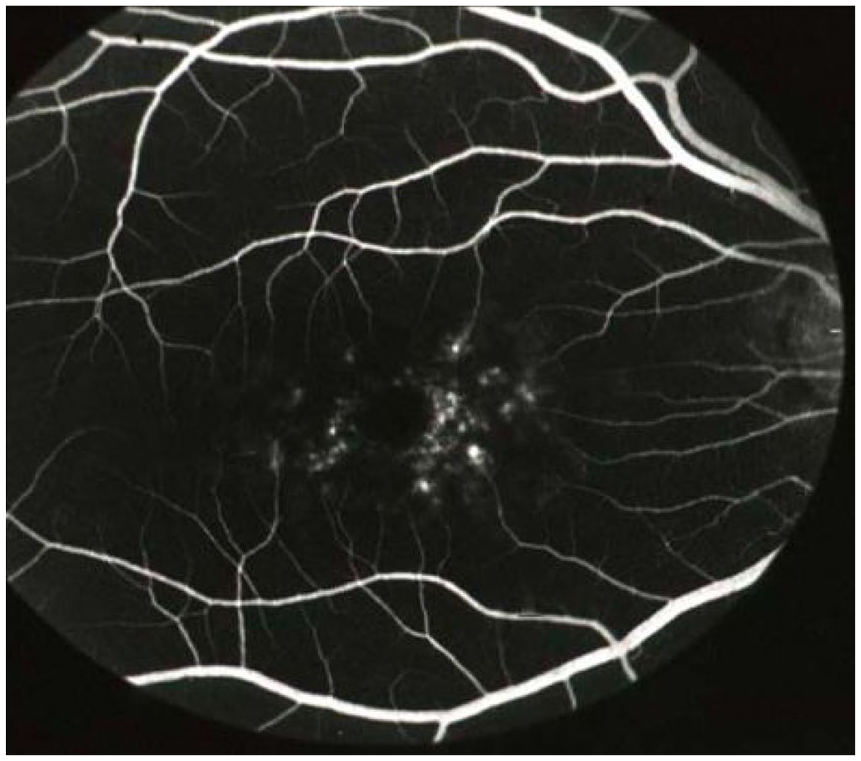
Fluorescein angiogram illustrating the dark (silent) choroid (absence of any choroidal vessel filling in the background). Image courtesy of Professor Alan Bird, Moorfields.
On FFA, flecks may be seen as hypofluorescent regions blocking the transmission of the fluorescein signal, 152 or hyperfluorescent 4 or appear as window defects. 52 The flecks can be seen on FFA before their appearance on fundoscopy and colour imaging, which is why FFA is used to diagnose STGD1/ABCA4R in children with symptoms but no obvious fundus features. 153 Regions of RPE atrophy are hyperfluorescent 39 with clearly demarcated borders. 39 FFA has since been replaced by noninvasive FAF imaging.
ICGA in STGD1
ICGA is now very rarely, if ever, used to assess patients with STGD1. In the fundus flavimaculatus phenotype, Schwoerer et al. 39 observed areas of decreased signal that progressed and resulted in reticular patterns with small areas of normal choroid surrounded by a clearly demarcated network of curvilinear lesions with low signal. The reticular pattern of decreased fluorescence was observed to have a polygonal shape similar to watershed zones between terminal choroidal arterioles supplying the CC. Flecks were present in all eyes but did not always correspond to yellow flecks seen on fundus examination. Regions of atrophic RPE appear as dark regions154,155 on ICGA.
OCT
OCT measures the back-reflected light from the retina to produce two-dimensional cross-sectional images (B-scan) that can be stacked to produce a three-dimensional (3D) volume. Representations of tissue structure within OCT images are based on interference and the interference fringes detected by a Michaelson interferometer. 156 The back-reflected light is combined with a reference beam: if the distance travelled by light in both paths is the same, this leads to positive interference; if the distance differs by half of the wavelength, this leads to destructive interference. As the interference pattern is sensitive to small changes in the distance travelled by light, it provides superior axial (depth) resolution. This enables high-resolution imaging of the retinal layers.
OCT imaging technology has developed enormously over the last 25 years. Time domain OCT has largely been superseded by frequency domain OCT. Frequency domain OCT includes SD-OCT and swept source OCT (SS-OCT). Currently in the clinical setting, SD-OCT is the most frequently used. It provides an axial resolution of 5–7 microns.157,158 The choroid can also be imaged with SD-OCT using enhanced depth imaging (EDI) protocols. 159 SS-OCT uses a longer wavelength of light that enables imaging of the choroidoscleral regions and optic nerve head, and has better imaging ability through cataracts and ocular opacities. 160
OCTA enables visualisation of the blood flow within the retinal and choroidal circulation by analysing successive B-scans, which capture different light reflection and scattering due to blood flow. Segmentation of the 3D volumes derived from OCTA imaging allows the creation of an en-face image that enables assessment of blood flow within specific layers. 161
Although a number of observations have been made regarding the appearance of specific disease features of STGD1 on OCT, there is currently no widely accepted classification for STGD1/ABCAR using OCT imaging.
Retinal layers
OCT enables the structural assessment of individual retinal layers (Figure 13). In ABCA4R, thinning mostly occurs within the outer retinal layers.162,163 Disruption or loss of the EZ or RPE can be observed and flecks are observed as hyperreflective deposits.14,164

OCT images in patients with STGD1. (a) A region of macular atrophy where the outer retinal thickness is ↓ and the EZ is absent. The yellow arrows show where the EZ is absent. (b) Preservation of the EZ layer within the peripapillary region. The outer retina is lost in the region of macular atrophy. The accompanying infrared scanning laser ophthalmoscopy image also shows a hyperreflective region of macular atrophy and normal reflectance within the spared peripapillary region. (c) The spared fovea with is shown between the two yellow arrows and the spared EZ layer is shown by the two red arrows.
The hypothesis of RPE apoptosis and consequent photoreceptor degeneration is widely thought to be the mechanism of vision loss in STGD1. 165 However, disruption and loss of the EZ on OCT can occur in areas with normal AF signal on SW-FAF images which suggests that photoreceptor degeneration may precede RPE degeneration in STGD1.16,110,111,129,166 It is also possible as proposed by Ritter et al. 167 that photoreceptor and RPE degeneration occur simultaneously in STGD1; they noticed regions of irregular AF corresponding to areas with abnormal RPE that had skip lesions and were associated with an absence or disruption of photoreceptor cells. Progressive loss in the width of the EZ is also seen in RP168,169,170,171 and its optical intensity has also been suggested as an early biomarker for disease in RP. 172 Similarly, Romano et al. 173 found that in Best disease, an increased baseline reflectivity was also associated with a lower VA and faster progression. In choroideremia, it appears that the RPE loss precedes photoreceptor degeneration and is more extensive.174,175 Careful evaluation at various disease stages using high-resolution imaging is helping to resolve these questions.
Preservation of the EZ has also been shown to correlate with the VA in STGD1110,120 and other IRDs, thus highlighting the importance of the EZ towards predicting the visual function in patients and potentially means its health could be used to monitor efficacy of therapeutic treatments.
Flecks correspond to hyperreflective deposits on OCT imaging.112,114,152,176 In an early study using OCT, Querques et al. described two types of flecks. Type 1 flecks comprise dome shaped deposits in the inner part of the RPE and type 2 flecks are small linear deposits in the outer nuclear layer (ONL) not involving the RPE. 152 More recently, Voigt et al. 176 devised an OCT classification for flecks comprising five subtypes (Table 5) and suggested that the differences between the flecks could reflect different disease stages of disease. Flecks with the highest AF signal were also observed to penetrate the ONL on OCT. 176 The EZ and external limiting membrane (ELM) are less reflective in areas adjacent to the flecks 114 and the ONL is thinner in areas with longer flecks.112,114 Resorbing flecks are hyporeflective and progressively interrupt rather than displace the interdigitation zone (IZ), EZ, ELM 114 and ONL 112 which led Sparrow et al. 114 to suggest that flecks expanded from the outer to the inner retinal layers.
The Voigt classification for flecks on OCT imaging. 176

BM, Bruch membrane; IS, inner segments; ELM, external limiting membrane; OCT, optical coherence tomography; ONL, outer nuclear layer; OS, outer segments; RPE, retinal pigment epithelium.
Huang et al. 177 found that progressive thinning of the ONL was associated with thickening of the inner nuclear layer but could not assess the effect of this retinal remodelling on the visual function due to the absence of photoreceptors. Inner retinal thickening in association with thinning of the ONL has similarly been reported in other IRDs which include X-linked RP,178,179 RP caused by variants in RHO 180 and CERKL, 181 Usher syndrome 1B (USH1B) with variants in MYO7A 182 and Leber congenital amaurosis with variants in AIPL1. 183 This highlights that measuring the retinal thickness in IRD is complicated and the focus should be on measuring individual layers rather than the overall retinal thickness due to retinal modelling linked to the disease process. Careful segmentation and evaluation are important when doing this. Indeed, volumetric measurements of the macular layers using OCT-based imaging could potentially be used to monitor STGD1 and assess the efficacy of therapeutic interventions as Strauss et al. 184 identified a significant decrease in total macular volume (TMV) over time. However, measuring TMV is limited by its need for significant manual correction for the software algorithms 184 and changes to the preferred retinal locus (PRL) which means that a different location could be imaged; thus, the follow-up function of the software cannot be used in these patients. 185 Moreover, Kong et al. 186 reported difficulties in measuring the individual retinal layers in STGD1 eyes due to factors such as the heterogenous and sporadic EZ disruption and outer retinal disorganisation. Velaga et al. 187 proposed that using an adaptive method to select a subset of B-scan images in STGD1 can help facilitate measuring the area and volume using manual segmentation.
Thinning of the peripapillary retinal nerve fibre layer has also been reported in ABCA4R.188,189
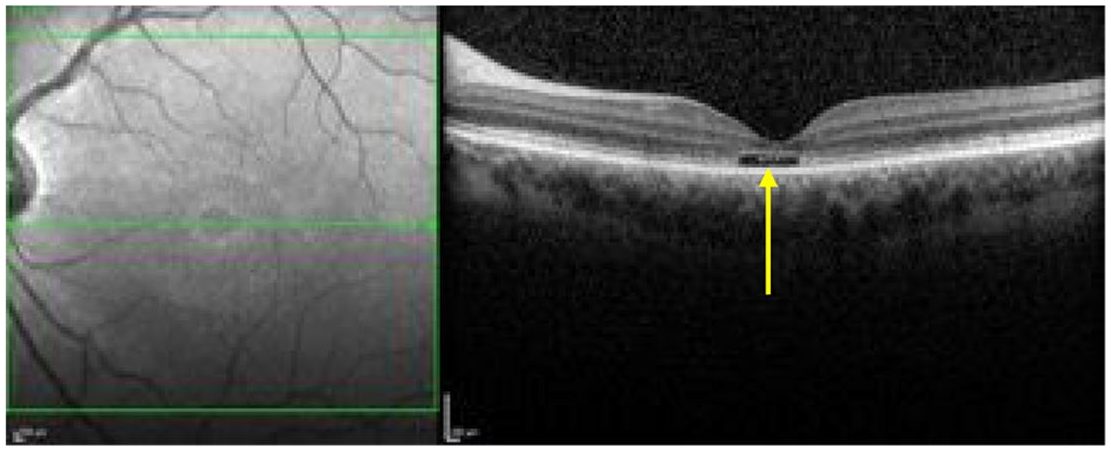
Thickening of the ELM (Figure 14) is thought to be an early sign of STGD1 in paediatric patients.16,103,104,190–193 It is most pronounced in younger patients, 192 occurs in asymptomatic patients103,104 and precedes changes on both fundus examination16,104 and FAF imaging. 16 Interestingly, the only adult to have this sign was a male in his 40s with a BEM phenotype on FAF imaging but this sign was not present in his older brother carrying the same variants who was also in his 40s. 86 Burke et al. 190 suggested that the thickened ELM could represent a Muller cell response to structural changes occurring within the photoreceptors. However, Pang et al. proposed that it could signify ‘migration and retraction of the inner segment ellipsoid back to the ELM during degeneration of photoreceptors’ and, that the thickened hyperreflective appearance could be arising from ‘densely packed mitochondria within the inner segment ellipsoid’. They suggest that this sign does not last as it precedes photoreceptor loss but disappears after progressive outer retinal degeneration. 191 At the time of writing this review, thickened ELM has only been reported in patients with ELOVL4 by Palejwala et al. 194 and in patients with USH1B due to MYO7A variant. 182

The OCT images in (a), (b) and (c) show areas of thickened ELM particularly within the perifoveal region, examples indicated by the yellow arrow, associated with a normal EZ in (c) and disruptions/vitelliform lesions in (a) and (b), corresponding to the flecks on the IR image, arising from the RPE and either disrupting or elevating the EZ and ELM indicated by the red arrows.
The optical gap appearance (Figure 15) is also thought to represent an early sign in ABCA4R 111 and has also been linked to the BEM phenotype and milder ABCA4 variants (such as p.(Gly1961Glu). 195 This feature was first described in achromatopsia196,197 and Leng et al. 198 reported it in patients with cone dysfunction and reduced multifocal electroretinogram (mfERG) amplitudes. The optical gap is also reported in cone dystrophies,199,200 occult macular dystrophy,201–203 tamoxifen-induced retinopathy,204,205 ‘poppers maculopathy’,206,207 laser pointer retinopathy208,209 and solar retinopathy. 210 This suggests that it should not be considered a specific feature. Of note, Oh et al. found that the optical gap width increased the most per year in STGD1 patients but the gap height decreased in STGD1 patients. By contrast, the height increased in patients with occult macular dystrophy and achromatopsia. 200 The optical gap is characterised by a disruption of the EZ, thinning of its proximal ONL followed by cavitation in areas with preserved RPE. Noupuu et al. described the progression of the optical gap over three stages that are summarised in Table 6.
The OCT shows an optical gap (see yellow arrow) in the foveal region containing photoreceptor debris.
Summary of the three stages of the optical gap appearance described by Noupuu et al. 195
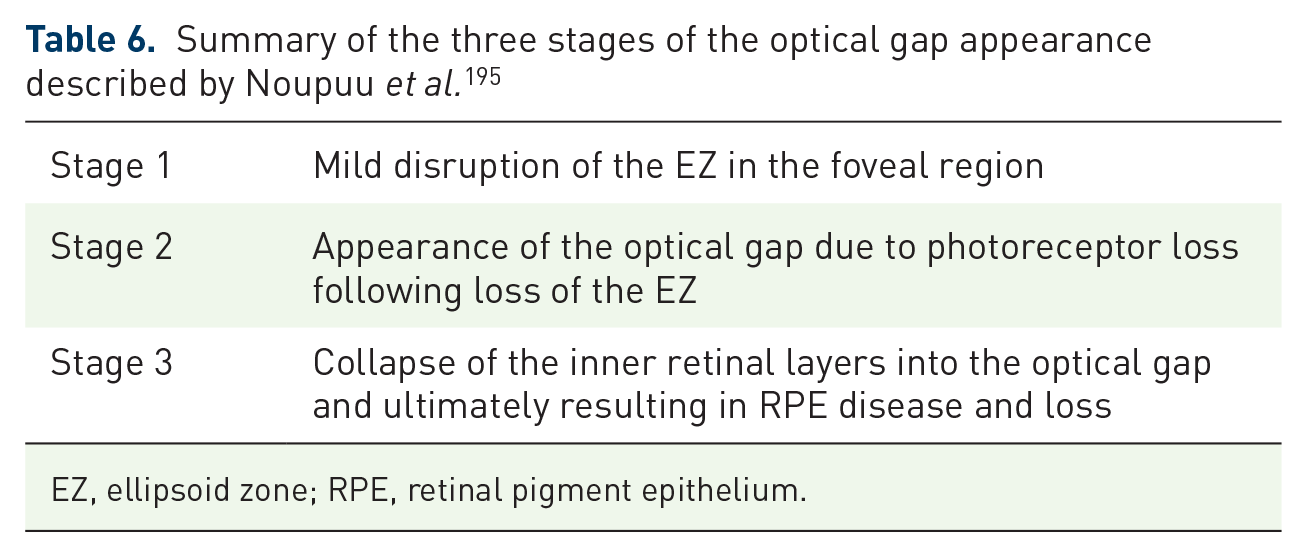
EZ, ellipsoid zone; RPE, retinal pigment epithelium.
En-face OCT imaging
En-face OCT imaging illustrates the different retinal layers as OCT slabs. The atrophic RPE appears as hyperreflective areas211,212 and the EZ loss appears as abnormal hyporeflective areas.211,212 The area of RPE atrophy tends to be smaller than the area of EZ loss in STGD1.211–214 Indeed, Alabduljalil et al. 213 found that the area of EZ loss was on average 1.6 times larger than the area of RPE atrophy and Sodi et al. found that the area of EZ loss exceeded the RPE atrophy in 96% of STGD1 eyes they assessed 211 and this has similarly been observed in patients with atrophic age-related macular degeneration (AMD). 215
En-face OCT can also be used to measure the area of preserved EZ in RP, thus allowing for monitoring of the disease over time. 216
The choroid
SD-OCT can be used to image the choroid and its related structures. This can be improved by using an EDI OCT protocol. This enables accurate measurements of choroidal thickness. However, blood flow through the choroidal layers is best imaged using OCTA.
The choroidal thickness is reduced in STGD145,121,217–219 and this is most pronounced within the subfoveal region121,217 and the areas temporal and superior to the fovea. 121 Adhi et al. 217 also found that 64% of their STGD1 patients had an irregularly shaped choroidoscleral interface characterised by a concave-convex-concave appearance rather than the bowl-shaped contour in healthy controls. Arrigo et al. 220 used OCTA to describe the progression of choroidal disease based on four patterns which are summarised in Table 7. Choroidal thinning has also been reported in RP221,222 and cone dystrophy. 223 Sabbaghi et al. recently reported that the choroidal thinning pattern was different when comparing patients with STGD1, RP, Usher syndrome and cone dystrophy. They found that patients with RP and Usher syndrome had a significantly thinner choroid than patients with STGD1 and cone dystrophy which led the authors to suggest that IRDs might have different alterations to blood flow 224 or it may be that there is secondary reduction to flow in more severe diseases. The appearance of choroidal caverns is also previously described as a rare finding in AMD patients with geographic atrophy and was suggested by Querques et al. 225 to represent nonperfused vessels and the remnant stromal pillars.
The choroidal patterns described by Arrigo et al. 220 .
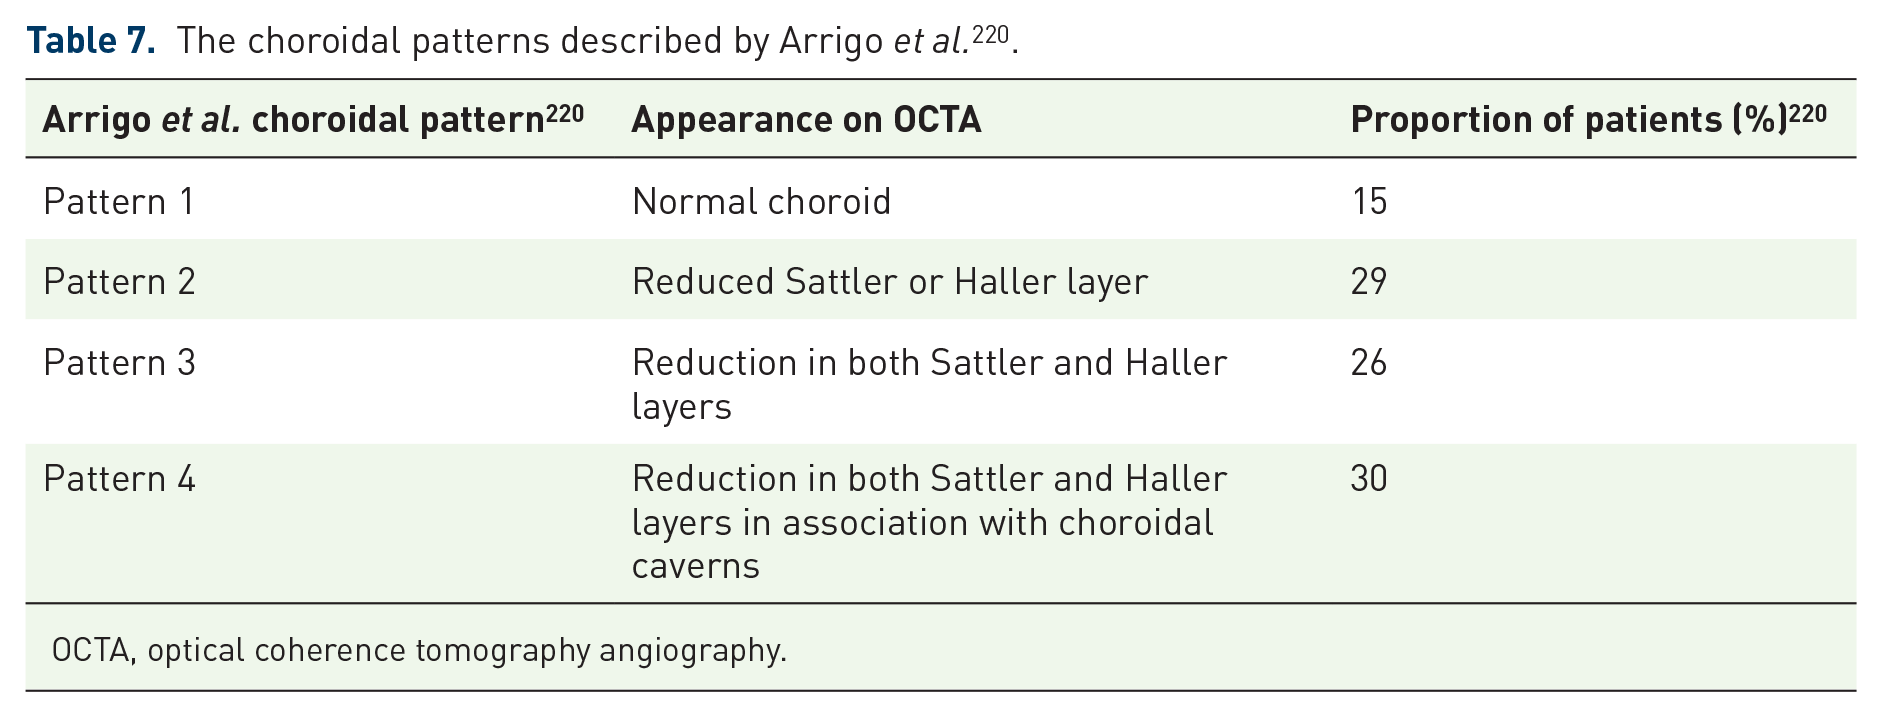
OCTA, optical coherence tomography angiography.
The CC is observed to be atrophic within areas of RPE atrophy.226–228 The area of atrophic RPE seen on FAF images is larger than the area of CC atrophy seen on OCT which suggests that RPE loss precedes CC involvement. 108 There is some controversy as to whether RPE and neuronal loss occurs before CC loss45,108,155,226 or whether the choroid is affected before RPE loss. 213 Of note, Xue et al. 175 have proposed that the choroid is thinned in choroideremia in the early stages of the disease and that loss of the RPE precedes and results in the degeneration of the photoreceptors.
The large choroidal vessels (LCV) tend to be preserved121,217 and Ratra et al. 121 found that they were thickened in 40% of STGD1 eyes and suggested that this could be compensatory dilation to preserve the blood supply following the degeneration of the CC. By contrast, the small choroidal vessels tend to be significantly thinner in all STGD1 eyes. 121 Reich et al. 226 found that the foveal avascular zone is enlarged in both the superficial capillary plexus and deep capillary plexus, but the area on the superior capillary plexus is larger than the deep capillary plexus, in contrast to healthy controls. However, Battaglia et al. 227 found that only the foveal avascular zone on the superior capillary plexus was significantly larger compared with controls, while the larger foveal avascular zone on the deep capillary plexus was no different from controls.
AO
High-resolution retinal imaging with AO enables in vivo visualisation of individual cells in the living eye.229,230 AO retinal imaging systems are based on technology initially used for astronomical imaging and typically consist of a wavefront sensor and a wavefront corrector (commonly a deformable mirror) coupled together by a control system. The naturally occurring optical aberrations of the eye are measured by the wavefront sensor and corrected by the wavefront corrector, enabling AO retinal imaging systems to improve transverse optical resolutions to approximately 2 microns. 231 AO imaging enables visualisation of cone photoreceptors. Rods are smaller, so not easily visualised, but recent improvements have enabled better imaging of rod photoreceptors229,232 and the RPE. 230
The addition of AO to a scanning laser ophthalmoscope (AOSLO) has enabled the capture of high-resolution retinal images with increased contrast. The standard confocal imaging geometry of the AOSLO allows for optical sectioning. The standard, confocal, imaging geometry of the AOSLO provides high contrast en-face images of the highly reflective elements in the photoreceptor outer segments. 233 More recently, novel imaging geometries have been developed (split-detector AOSLO), which allow simultaneous imaging of other retinal structures, such as photoreceptor inner segments by using nonconfocal back-scattered light. 234 Nonconfocal imaging can also be used to assess the RPE. 235 AO imaging has been shown to detect retinal changes before FAF and OCT. 103 This is important to understand early disease stages and for the development of cell-based biomarkers of retinal disease for use as sensitive outcomes in therapeutic trials.
Investigations of early STGD1 with in vivo AOSLO imaging by Song et al. 86 have demonstrated evidence of centrifugal disease progression from the fovea. They observed areas of increased rod and cone photoreceptor spacing in areas of normal conventional clinical imaging, suggesting that photoreceptor loss precedes clinically detectable RPE disease. 86 Longitudinal studies of AOSLO imaging in patients with STGD1 have shown that the earliest cone photoreceptor spacing abnormalities occur in areas of homogeneous SW-FAF. This indicates an absence of RPE disease and these early features can be seen in the context of normal vision and normal outer retinal structures on SD-OCT. 236 These early abnormalities may support the hypothesis that photoreceptor degeneration is a primary event and does not occur secondarily to RPE cell death. These changes are followed by a heterogeneous increase in SW-FAF signal with cone loss, and then by a reduction of SW-FAF signal with cone and RPE cell death. 236 In vivo AF AOSLO imaging in patients with STGD1 has revealed patterns of AF that appear to colocalise with photoreceptors. 237 These observations support histologic reports of photoreceptor bisretinoid accumulation 238 and may be useful as an early biomarker in patients with STGD1. New methods to facilitate the interpretation of complex multimodal imaging datasets from patients with STGD1 with comparison of structural and functional information have also been described. 239
Correlation of multimodal imaging findings and retinal function with electrophysiology and psychophysical evaluation
EDT
EDT is a key tool in diagnosis, prognosis and for counselling in inherited retinal dystrophies and particularly so for ABCA4R as there may be early photoreceptor involvement in asymptomatic patients. It is also the case that repeat evaluation may be necessary. A full assessment of retinal function in ABCA4R is essential as changes in the electrophysiological responses can precede symptoms and changes on both colour and FAF imaging. 103
Electrophysiology testing in a clinical environment when investigating IRD typically includes International Society for Clinical Electrophysiology of Vision (ISCEV) standard pattern electroretinogram (PERG), mfERG, full field electroretinogram (ffERG) (scotopic, photopic as well as a 30-Hz flicker) and electro-oculogram (EOG).240,241 The PERG is used to obtain information regarding the macular and retinal ganglion cell function, represented by the P50 and N95 responses, respectively. The mfERG similarly assesses the central retinal function. The ffERG investigates the general function of the rod and cone photoreceptor cells and can be performed under scotopic conditions to test rod photoreceptors and under photopic conditions for cone photoreceptors. On ffERG, the negative a wave signifies the photoreceptor response, the next positive b wave signifies the bipolar cell and horizontal cell response and the positive c wave signifies the RPE cell response. The EOG assesses the function of the RPE by measuring the difference between the electrically negative retina and the electrically positive cornea.240–243
Different components of retinal function are tested using specific methods; the mfERG for central retinal function, ffERG for general retinal function of the rod and cone photoreceptor cells which can be performed under scotopic conditions to investigate rod photoreceptors and photopic conditions to assess cone photoreceptors
A detailed overview of electrophysiology is not within the scope of this review, but Robson et al. 244 cover this in their publication entitled ‘an ISCEV guide to visual electrodiagnostic procedures’.
In STGD1, the PERG is typically abnormal or absent.37,245 Regarding the more general assessment of the retinal function, Lois et al.’s classification is widely used for STGD1/ABCA4R. This classifies the general retinal function in STGD1 patients into three groups (Table 8); group 1 have an abnormal PERG but a normal ffERG, group 2 have isolated cone dysfunction and group 3 have cone and rod dysfunction. 246 Patients who are more likely to progress more quickly or have more severe disease are in the more severe ERG group.15,126,247 Patients with early onset disease are more likely to be in group 3; late onset disease is more likely to be allocated to group 1. 247 However, a small number of cases can progress in severity, necessitating reallocation to a different group. 15
Groups 1–3 mild to severe based on electrophysiology findings, described by Lois et al. 246

ffERG, full field electroretinogram; PERG, pattern electroretinogram.
Those in Lois group 3 and particularly those with more severe abnormalities of their ffERG are noted to have larger areas of RPE atrophy, 46 a faster RPE atrophy progression rate, 126 peripapillary involvement 46 and are usually in Fishman class 3 and 4167,248 (Table 2). Müller et al. 142 found that patients with a group 1 and 2 ERG had raised qAF levels in all age groups, while the qAF levels were only raised in young patients with group 3 ERG.
Correlation to OCT images shows that loss of the EZ only within the macular region is associated with a group 1 ERG, while widespread EZ loss is seen in group 2 and 3 ERGs.130,214 Moreover, macular thinning and loss of the EZ is associated with abnormalities in the PERG 245 and assessment of a larger field testing of the PERG is thought to be useful for monitoring disease progression despite its lower diagnostic sensitivity and specificity compared with the standard field.
The optical gap phenotype is associated with a normal ffERG but the mfERG shows photoreceptor dysfunction beyond the regions with retinal changes seen on both OCT and FAF111,195 meaning that the functional changes precede structural changes 195 and that abnormalities on mfERG are an early marker of disease. 111 The ERG is completely extinguished in patients with chorioretinal degeneration. 42 It can be seen from this overview that electrophysiology is extremely important in determining the severity of disease, and key in providing useful prognostic advice.
Psychophysical testing (VA and visual field assessment)
Psychophysical evaluation can be very informative when assessing an individual’s visual function and in assessing the functional impact of disease. Electrophysiology can indicate the severity of retinal disease but is not always a good guide to a patient’s visual performance. Psychophysics including VA and visual field testing enables evaluation of visual performance. Visual acuities are usually carried out by assessing a patient’s ability to see a chart at a prerequisite distance wearing their appropriate refractive correction. It is also possible to carry out this type of VA testing using digital optotypes that test VA using a screen where single letters appear and are framed by a crowding bar. 249 There is a wide range of testing equipment, and it is of key importance to ensure testing conditions are kept as uniform as possible for follow-up measurements. LogMAR vision charts are now preferred over Snellen charts as the testing is more reproducible and avoids the issue of ‘crowding’ and enables equal weighting per letter.250,251 Visual field testing can include central and peripheral visual fields. 252 There are a number of standard protocols for this type of testing. In addition, more refined specific types of testing such as fine matrix mapping, microperimetry, mesopic and scotopic perimetry testing may be undertaken on a research basis. 253 It is very important to assess the visual fields for any peripheral or central loss, or scotomata in key regions. This enables us to infer visual function together with the VA. 253 More specific functional visual testing in different environments with obstacles to navigate around in varying lighting conditions have been tailored to test different types of visual loss in different lighting conditions. These are being developed as part of research trials, particularly for severe visual impairment, as standard testing may not deliver any useful information.
VA
VA gives an objective measure of visual function. However, a VA measurement early in disease may not be a good indicator of the potential severity of disease, and speed of progression. In addition, it does not always give an accurate ‘picture’ of how well an individual is functioning in their daily life as this test is generally performed in optimal conditions.
A reduced VA and presence of central scotomas are typically seen in STGD1.31,254 The VA is lower in patients with a more severe Fishman class (Table 1),255,256 and more severe AF type. 24 A better best corrected visual acuity (BCVA) is associated with preservation of the EZ layer,110,120 while a lower BCVA is associated with a wider transverse loss of the photoreceptor layer, reduced foveal thickness110,164 and reduced macular volume. 256 BCVA is relatively preserved in patients with foveal sparing disease22,23,49,51,120,162,176 who can sometimes be asymptomatic. 49 A poorer VA on presentation is generally associated with a more severe disease course. However, the ProgStar study showed that the VA does not correlate with the area of decreased AF signal. 24 Also as the VA may not significantly change over a 2-year period, 257 it is thus not sensitive enough to be used as a primary outcome measure in clinical trials. 20
Visual fields
Testing of both central and peripheral visual fields is important when assessing patients with ABCA4R. STGD1 typically have a progressive central scotoma.31,153 Loss of mid and peripheral visual fields is usually associated with a more severe Fishman class (Table 1), more severe disease with peripheral involvement seen on UWF-AF, and Lois group 3 (Table 8).31,119,254 Schroeder et al. 130 classified the visual field severity into three groups with VF group 1 patients having a central scotoma within 10°, VF group 2 patients having central scotomas of 10°–35° and VF group 3 patients only having ‘temporal residues’ and correlation to colour fundus photographs in these groups typically showed that group 1 patients had isolated pigmentary changes within the macula, group 2 patients had extensive atrophy within the posterior pole that was associated with pigmentary changes in approximately half the patients and group 3 patients had large regions of atrophy that in some patients were associated with ‘bone corpuscle pigmentations’, vascular attenuation and optic nerve head pallor. 130
Microperimetry
More recently, fine mapping of the central retina using microperimetry has been found to be very useful in assessing central visual function. Microperimetry tests retinal sensitivity, which is very useful for assessing patients with macular disease and also allows for assessment of the fixation location and stability258,259 which can be reviewed over time to investigate disease progression.260,261 STGD1 patients with disease confined to the macula (Lois group 1) show varying degrees of reduced sensitivity depending on the stage of disease, but the retinal sensitivity in the peripheral retina is normal.262,263 Microperimetry testing in both scotopic and photopic conditions can be helpful in determining rod and cone involvement, respectively. Microperimetry under different lighting conditions and with different colour stimuli are useful potential outcome measures for therapeutic trials.264,265
Superimposing the macular sensitivities onto the FAF images can be correlated with areas of abnormal or atrophic retina. Retinal sensitivity is undetectable in areas with an absent AF signal, 66 and areas with decreased AF signal have reduced retinal sensitivity compared with regions with homogeneous AF. 53 The sensitivity is also reduced in areas with flecks 266 with the most pronounced difference in retinal sensitivity being between the hyperfluorescent flecks and their adjacent area.53,266 The mean sensitivity is higher in the more eccentric flecks on NIR-AF. 53 It is preserved in the spared fovea 52 and higher in nasal region in patients with extramacular disease, and higher in spared peripapillary area. 166 Changes in retinal sensitivity compared with healthy controls were also found to have a higher correlation with the thickness of the OS compared with the ONL and outer plexiform layer (OPL) thickness. 166 Reduction of the mean sensitivity in patients with a normal RPE and EZ layer led Salvatore et al. 35 to propose that microperimetry can help identify which regions to treat as functional changes affecting the photoreceptors detected by microperimetry might precede structural changes. The ProgStar study found that the mean yearly change in mean sensitivity was −0.68 dB/year. 263 The mean sensitivity at the border of a dense scotoma, termed edge mean sensitivity, is lower than the mean sensitivity (yearly progression rate of mean sensitivity was 1.5 dB/year compared with 2.9 dB/year for the edge mean sensitivity), which led Schönbach et al. 265 to propose that the edge mean sensitivity could potentially be used as a sensitive outcome measure over shorter periods of time in clinical trials. The ProgStar study also recently used software algorithms to create a 3D model of the volume of hill of vision from the microperimetry results which can identify changes in visual function and potentially be used as end points in clinical trials. 267 Josan et al. have similarly found that microperimetry measurements of the volumetric hill of vision were useful in STGD1, RPGR-related RP and choroideremia as it avoided averaging floor effects observed in standard microperimetry. They observed that volume measures might be able to detect sensitivity changes that would be missed by the standard mean sensitivity microperimetry approach. 268
The role of fixation stability in monitoring disease progression remains unknown as the recent results from the ProgStar study have suggested that the fixation stability might not be a sensitive outcome measure for therapeutic trials but can give useful information on visual function. 261
Discussion
Retinal imaging and functional testing are key to diagnosing and characterising severity of STGD1 and ABCA4R. ABCA4R comprise quite distinct phenotypes, but with variation in presentation and progression. Multimodal imaging and functional testing can detect and highlight progressive changes, which can be used to describe the natural history of the disease. Information derived from imaging and functional testing is invaluable in counselling patients regarding diagnosis and prognosis. Some of which are already employed as outcome measures in therapeutic trials. FAF is particularly important for diagnosing STGD1 as it is better at detecting the characteristic flecks and macular atrophy than colour photography or fundoscopy, and in some cases can even detect changes in asymptomatic patients who show no retinal changes on colour photographs or fundoscopy. AF imaging can thus highlight early onset severe disease and together with vision function testing and genotyping can enable informed counselling regarding prognosis. In addition, it will help define cohorts of patients for intervention. AF is an important tool, which can be used with automated software to track progression in patients by measuring atrophy progression. NIR-AF imaging can detect flecks and a larger area of RPE atrophy not detected by SW-AF imaging; thus, it is a useful tool to predict earlier changes and future progression in patients. In addition, it confers the benefit of less light toxicity during examination. qAF imaging could prove very useful in aiding diagnosis in suspected ABCA4R, particularly in those in whom only a single ABCA4 variant has been identified, supporting further genetic testing to identify a second variant. However, the short wavelength of light used in qAF is potentially toxic to the photoreceptors, which limits this modality’s use. In addition, abnormalities of qAF are observed in other types of IRD. OCT imaging provides complementary information, allowing a detailed view of the retinal layers. OCT is also informative regarding the behaviour of disease; a preserved EZ layer is typically associated with a better VA and retinal sensitivity. This observation is useful as a marker for prognosis, or to identify regions for gene therapy treatment, and to inform response to intervention. Early signs of disease such as a thickened ELM can be used to diagnose asymptomatic patients, for example, early onset in children. The changes seen in retinal imaging also correlate to EDT which can be used to predict the progression in patients. Patients with rod and cone-rod involvement typically have more severe progressive RPE atrophy and changes to the EZ layer. More recently, AO has demonstrated that in STGD1, there is an increase in cone spacing, a decrease in cone density and enlargement of rod photoreceptors compared with healthy control eyes. These findings correlate with the changes seen on OCT and AF imaging.236,237 Meticulous characterisation of the phenotype with multimodal imaging and functional testing in STGD1 will be important towards assessing the efficacy of ongoing therapeutic approaches and help towards identifying suitable patients for inclusion in therapeutic trials which include methods such as modification of visual cycle modulators, gene therapy, complement system inhibition and cell replacement-based therapy.
There are at least 10 visual cycle modulator compounds currently undergoing evaluation: deuterated vitamin A,269–271 retinal binding protein antagonists (fenretinide and A1120),272,273 isotretinoin,274,275 amine-based drugs, 276 soraprazan, 277 ticagrelor, 278 VX-809, 279 saffron, 280 docosahexaenoic acid (DHA) supplementation 281 and omega 3 fatty acid supplementation. 282
It is expected that treatments that lower the lipofuscin levels will be best monitored using FAF and qAF imaging. OCT imaging is likely to be useful as well as it can provide information on the preservation of the retinal architecture with markers such as the preservation of the EZ layer and thickness of the retinal layers. Deuterated vitamin A is predicted to slow the production and accumulation of the toxic A2E269,270 and response to this treatment could be monitored by measuring qAF. 271 Fenretinide and A1120 limit the entry of vitamin A into retinal cells by competitively binding to the retinal binding protein,272,283 thus limiting the amount of all-trans-retinol reaching the RPE. 273 Both have been shown to reduce A2E/lipofuscin levels in Abca4 KO mice, and mice treated with fenretinide had a reduction in AF levels.272,283 Isotretinoin has also been demonstrated to reduce A2E levels in Abca4 KO mice on electron microscopy 275 and also protect photoreceptors from light-induced damage. 274 Amine-based drugs can also be used to prevent the formation of A2E, and the retinal architecture was found to be more preserved in treated Abca4 KO mice compared with untreated mice. 276 Soraprazan is a treatment for gastroeosophageal reflux disease, 284 which has been observed to reduce the lipofuscin levels in treated monkeys 277 and mice. 285
Ticagrelor is a P2Y12 receptor inhibitor that has been found to decrease the lysosomal pH in Abca4 KO mice. OCT imaging, FAF imaging and electrophysiology will be useful in monitoring the response to ticagrelor as treated Abca4 KO mice had a thicker ONL on both OCT imaging and histological assessment, 286 had lower AF signal 278 and an improvement in a- and b-wave responses on electrophysiology testing. 286
Saffron treatment has not been shown to significantly improve the focal ERG or the VA. 280 DHA supplementation has not been found to improve retinal function in STGD1 281 and omega 3 fatty acid supplementation is currently under evaluation 282 (NCT03297515). VX-809 treatment used for cystic fibrosis has been shown to increase levels of ABCA4 expression in HEK293 cells. 279
Gene therapy approach whereby a vector is used to introduce a functioning gene to the diseased cells is a promising approach. RPE65 retinal degeneration was the first licenced gene therapy treatment for an IRD. This is delivered using an adeno-associated virus (AAV) vector. Other gene therapy or gene targeted approaches currently under investigation include a dual vector approach,287,288 using nanoparticles as a vector, 289 complement modulation290–292 and antisense oligonucleotides.293,294
Gene therapy trials to treat AMD to increase expression of complement receptor 1-like protein y (CRRY) 290 and the C5 complement inhibition 291 by Zimura 292 are underway with the aim of modifying complement activation. OCT imaging will play an important role in assessing these patients; the Zimura trial is assessing the mean rate of change of the EZ over an 18-month period.292,295 FAF is important to image change over time. Mice treated with the vector containing CRRY were noted to have a reduction in bisretinoid levels, in addition to a slower degeneration of photoreceptor cells. 290 Antisense oligonucleotides are short sequences of RNA that can modulate splicing defects 296 and have been shown to correct splicing defects caused by deep intronic variants in the ABCA4 gene.297,298
For these gene therapy approaches, OCT imaging can provide information on the extent of preservation of the retinal layers. The extent of disruption of the EZ and ELM layer has been shown to correlate with the BCVA, retinal sensitivity on microperimetry and responses on ERG and mfERG111,120,164 which suggests that assessment of these layers will be important in assessing retinal function in gene therapy trials. Recently, the ONL thickness was also shown to have a higher correlation with the BCVA when compared with the area of photoreceptor loss, and area of RPE atrophy measured on en-face OCT. This suggests that measuring the ONL may also be important in assessing clinical trial results. 299 The Zimura trial will specifically assess the rate of degeneration of the EZ. At the time of writing this review, the results of this trial were not yet available.292,295 Measurement of the retinal layers is performed using segmentation software. Automatic segmentation software is available, but errors may occur when measurements are affected by outer retinal disruptions, 300 and the presence of poorly defined hyperreflective lesions such as flecks. 187 Currently manual segmentation is required to correct these errors.186,301 Improvements in segmentation software will be vital in enabling objective assessment of the retinal layers in gene therapy trials. 187 FAF and qAF imaging are ideal techniques to assess changes to lipofuscin accumulation. AO imaging will be important in assessing the structural changes to photoreceptors and counting cones. Microperimetry will enable tracking of retinal sensitivity and temporal changes in sensitivity, as well as an accurate assessment of the central visual field.
Stem cell-based therapies in ABCA4R are aimed at replacing diseased RPE cells with RPE derived either from human embryonic stem cells (hESCs) or from induced pluripotent stem cells (iPSCs). The value of hESCs intervention for patients with ABCA4R and AMD is being evaluated in a trial.302–304 Colour photographs are useful in assessing treatment outcomes as hyperpigmentation in the treated region is thought to indicate survival of transplanted cells.302,305 These hyperpigmented regions correspond to hyperreflective areas between the photoreceptor cells and Bruch’s membrane. The role of FAF is yet to be determined for this therapeutic approach, as AF was shown to be absent up to 12 months following treatment in the trial by Mehat et al. 305 Oner et al. 306 transplanted adipose tissue derived from mesenchymal stem cells into the suprachoroidal space in STGD1 and AMD patients with some improvements in their VA, visual field and mfERG.
The number of potential interventions for ABCA4R is burgeoning with a range of different approaches. The role of imaging and functional testing will also evolve in response to this, with a drive to employ more sophisticated methods of assessing early signs of disease. The use of AOSLO, and microperimetry under different lighting conditions with different stimuli, and digital methods of assessing reading speed and acuity are examples of recent innovations. The advent of automated reading of imaging on a large scale with the introduction of artificial intelligence (AI) to this field will enable accurate evaluation of large datasets. These innovations will be key in revolutionising our ability to assess multiple images in large cohorts over time enabling an objective assessment of response to disease.
Conclusion
A comprehensive understanding of multimodal imaging (Table 9) and functional testing with access to these investigations remains key in diagnosis, prognosis and genetic counselling, as well as in assisting the complex tasks of distinguishing phenocopies, evaluating the role of genetic modifiers, identifying cohorts for therapies and assessing response to interventions.
Summary of the typical findings identified on multimodal imaging in Stargardt disease.

AF, autofluorescence; ELM, external limiting membrane; EZ, ellipsoid zone; ICGA, indocyanine green angiography; NIR-AF, near infrared-wavelength autofluorescence; RPE, retinal pigment epithelium; SW-AF, short-wavelength autofluorescence; UWF, ultra-widefield.
Footnotes
Acknowledgements
The authors would like to thank the Eye Research Group Oxford (ERGO) for their support of this study, in particular Alexina Fantato, Clare Arnison-Newgass, Sophie Marlowe and Lidia Milla, as well as the patients who agreed to participate in this study.
Author contributions
Conceptualization, SH and SMD; investigation, SA-K, SB, SH and SMD; writing–original draft preparation, SA-K, SB, MS, SH and SMD; writing–review and editing, SA-K, SB, CRF, MS, JY, SH and SMD; supervision, SH and SMD. All authors have read and agreed to the published version of the manuscript.
Conflict of interest statement
The authors declared no potential conflicts of interest with respect to the research, authorship and/or publication of this article.
Funding
The authors disclosed receipt of the following financial support for the research, authorship and/or publication of this article: The Thames Valley and South Midlands Clinical Research Network provided funding support for the clinical aspects of this study. Saoud Al-Khuzaei is supported by a scholarship from the Qatar National Research Fund (GSRA6-1-0329-19010). Jing Yu is supported by funding from the UK inherited Retinal Disease Consortium Project (UKIRDC) (RetinaUK) (HMR03950) and Winstanley Family Donation for Inherited Macular Diseases (HMD00280).
Ethics and declarations
This study was conducted in accordance with the Declaration of Helsinki with ethics approval obtained from the local research ethics committee (reference 08/H0302/96).
Consent for publication
Informed written consent was obtained from all patients