
Abstract
Purpose:
To evaluate the correlation of the visual acuity and diabetic retinopathy stage using optical coherence tomography and optical coherence tomography angiography metrics.
Methods:
In this prospective study, optical coherence tomography and optical coherence tomography angiography images of patients with different stages of diabetic retinopathy were obtained. In optical coherence tomography angiography images, the size of foveal avascular zone, central macular thickness, and vessel density at superficial and deep capillary layers of the macula were measured. In optical coherence tomography images, the presence of intraretinal cyst, disorganization of retinal inner layer, and ellipsoid zone and external limiting membrane disruption were evaluated. The associations between the variables with visual acuity and diabetic retinopathy stage were analyzed.
Results:
In total, 68 eyes of 38 patients with a mean age of 58.96 ± 10.59 years were included. In total, 34 eyes were categorized as non-proliferative diabetic retinopathy, 14 as active, and 20 as regressed proliferative diabetic retinopathy. Univariate analysis showed deep parafoveal vessel density, central macular thickness, ellipsoid zone disruption, disorganization of retinal inner layer, and external limiting membrane disruption had a significant relationship with visual acuity. However, in multivariate analysis, only central macular thickness and ellipsoid zone disruption had significant association with visual acuity (p = 0.02 and p = 0.01, respectively). There was a significant difference in deep parafoveal vessel density (p = 0.04), but not in foveal avascular zone area, between different stages of diabetic retinopathy.
Conclusion:
In this study, the foveal avascular zone area did not correlate with visual acuity and different stages of diabetic retinopathy. Structural abnormalities on optical coherence tomography images with especial focus on outer retinal disruption provided more reliable predictors for visual acuity outcomes in patients with diabetic retinopathy.
Keywords
Introduction
Diabetic retinopathy (DR) is a leading cause of visual impairment in working age population. 1 Visual impairment has a great impact on quality of life in patients with DR.2,3 Visual function is influenced by several mechanisms during the natural course of the disease. Of them, diabetic macular ischemia has been proposed to cause visual impairment from earliest stage of DR. 4 The relationship between macular ischemia and visual function has been documented.5–9 However, the effect of macular ischemia on visual acuity (VA) varies among different reports. Furthermore, there is a paucity of evidences regarding how macular ischemia could predict central VA and if other clinical and macular structural changes could impact on the association.
Diagnostic modalities, most commonly fluorescein angiography (FA), have been utilized to evaluate macular ischemia including foveal avascular zone (FAZ) size and areas of capillary nonperfusion.5,10 The FAZ is an area comprised of central region of the macula surrounded by interconnected capillary networks nourished by the choroidal circulation. Using FA, studies have shown that the size of the FAZ correlates to the loss of visual function even at earlier stage of retinopathy.5,6 However, the procedure needs intravenous dye injection which consequently becomes time consuming and is prone to adverse allergic effects. The advent of optical coherence tomography angiography (OCTA) allowed rapid and noninvasive flow–based imaging for the assessment of FAZ and vessel density (VD) at different macular capillary layers and choroidal vasculature. 11 The studies describing the correlations and determinants of the visual outcomes using OCTA in DR are limited. 12 Recently, Balaratnasingam and colleagues 13 revealed the correlation of FAZ area with VA in DR and retinal vein occlusion, suggested FAZ as a biomarker of visual function using OCTA.
The purpose of this study is to evaluate the relationship of FAZ area and VD with VA in patients with DR at different stages of retinopathy using OCTA. In addition, we investigated the association of FAZ area with different parameters measured in this study.
Methods
This cross-sectional study was conducted on patients with type 2 diabetes mellitus, who have different stages of DR. The study was conducted at Rasoul Akram Hospital, Tehran, Iran, between April 2017 and January 2018. Patients with signs of significant media opacity including cataract that might affect central VA, or additional macular disease including age-related macular degeneration, retinal arterial or venous occlusion, vitreomacular traction, significant epiretinal membrane, presence of pseudohole or macular hole, moderate or advanced glaucoma were excluded. Patients with history of pars plana vitrectomy were excluded. The study conformed to the tenets of the Declaration of Helsinki and was approved by Eye Research Center Ethics Committee (No. IR.IUMS.REC 1395.95-04-124-30160) and informed consent was obtained from participants. Demographic data including age and sex were obtained. Best corrected VA of both eyes was assessed using Snellen eye chart. All participants underwent standard ophthalmic examination. Funduscopic examination including retinal periphery was done with pharmacologically dilated pupil and the severity of retinopathy was graded based on Early Treatment of Diabetic Retinopathy Study (ETDRS) classification. 14 The eyes were categorized as non-proliferative diabetic retinopathy (NPDR), active proliferative diabetic retinopathy (PDR), and regressed PDR. Regressed PDR was defined as the presence of panretinal photocoagulation (PRP) scars in the absence of any retinal or iris neovascularization.
The OCTA images (RTVue XR Avanti; Optovue, Fremont, CA, USA; Version 2016.1.0.26) were acquired as a 3 × 3 mm image centered on the central fovea from all patients in the same day of comprehensive eye examination. The procedure was repeated if the quality of the images was influenced by motion or segmentation artifacts. The images with a quality score less than five were excluded. The segmentation of the superficial capillary plexus (SCP) en face image was confined to an inner boundary set at 3 μm beneath the internal limiting membrane and an outer boundary set at 16 μm beneath the inner plexiform layer. The segmentation of the deep capillary plexus (DCP) en face image was confined to an inner boundary set at 16 μm beneath inner plexiform layer and an outer boundary set at 72 μm beneath the inner plexiform layer. Quantitative measurement of FAZ in the SCP was performed in square millimeters (mm2) by two expert graders (H.S. and P.A.) masked to the visual acuities and DR staging. The FAZ area was manually determined as a central macular region surrounded by the capillary network. VD of foveal and parafoveal regions were automatically calculated as the proportion of pixels with flow signal of the total pixel. Parafoveal region was determined as a ring-shaped area between 1- and 3-mm diameter centered on the fovea.
The OCT B scan images were graded by the two independent blinded graders to reveal the presence of foveal structural changes including intraretinal cyst, disorganization of retinal inner layer (DRIL), and ellipsoid zone (EZ) and external limiting membrane (ELM) disruption. 12 Central macular thickness (CMT) was recorded from automated measurement of the OCTA software.
Statistical analysis was done using SPSS version 17 (SPSS Inc., Chicago, IL, USA). The intraclass correlation coefficient (ICC) was calculated to evaluate for inter-observer reliability. There was an excellent agreement between two graders in measuring FAZ area at SCP (ICC = 0.98). Therefore, the mean of two observations was used for subsequent analysis. Generalized estimating equations (GEE) analysis was performed to correct the inter-eye correlation. Multivariate analysis was performed to investigate the role of FAZ on VA considering other probable influential factor. A p-value of ⩽0.05 was considered statistically significant.
Results
A total of 68 eyes from 38 diabetic patients (10 males and 28 females) with a mean age of 58.96 ± 10.59 years (range: 39–80 years) were included in the study. In total, 42 eyes (62%) had previous history of intravitreal bavacizumab injection. The median interval from injection to examination was 3 months (range: 1–24 months). The mean best corrected visual acuity (BCVA) was 0.40 ± 0.37 LogMAR with mean spherical equivalent of −1.24 ± 1.02. The mean intraocular pressure (IOP) of participants was 15.2 ± 2.1 mm Hg. The severity of DR was graded as NPDR in 34 (50.0%), active PDR in 14 (20.6%), and regressed PDR in 20 (29.4%) eyes.
The frequency and percentage of foveal structural indices in OCT images including intraretinal cyst, EZ disruption, DRIL, and ELM disruption were shown in Table 1. The mean foveal and parafoveal vessel densities in the superficial capillary layer were 26.55 ± 6.01 and 44.50 ± 5.04, respectively. The mean foveal and parafoveal vessel densities in the deep capillary layer were 24.22 ± 6.80 and 50.49 ± 5.16, respectively. The mean FAZ area was 0.47 ± 0.20 mm2. Comparison between OCTA parameters at different stages of DR is summarized in Table 1. Significant difference was found in deep parafoveal VD at different stages of DR (p = 0.04). However, there were no significant differences in FAZ area (Figure 1), foveal superficial and deep VD, and superficial parafoveal density between different stages of DR.
Comparison between OCTA parameters at different stages of diabetic retinopathy.
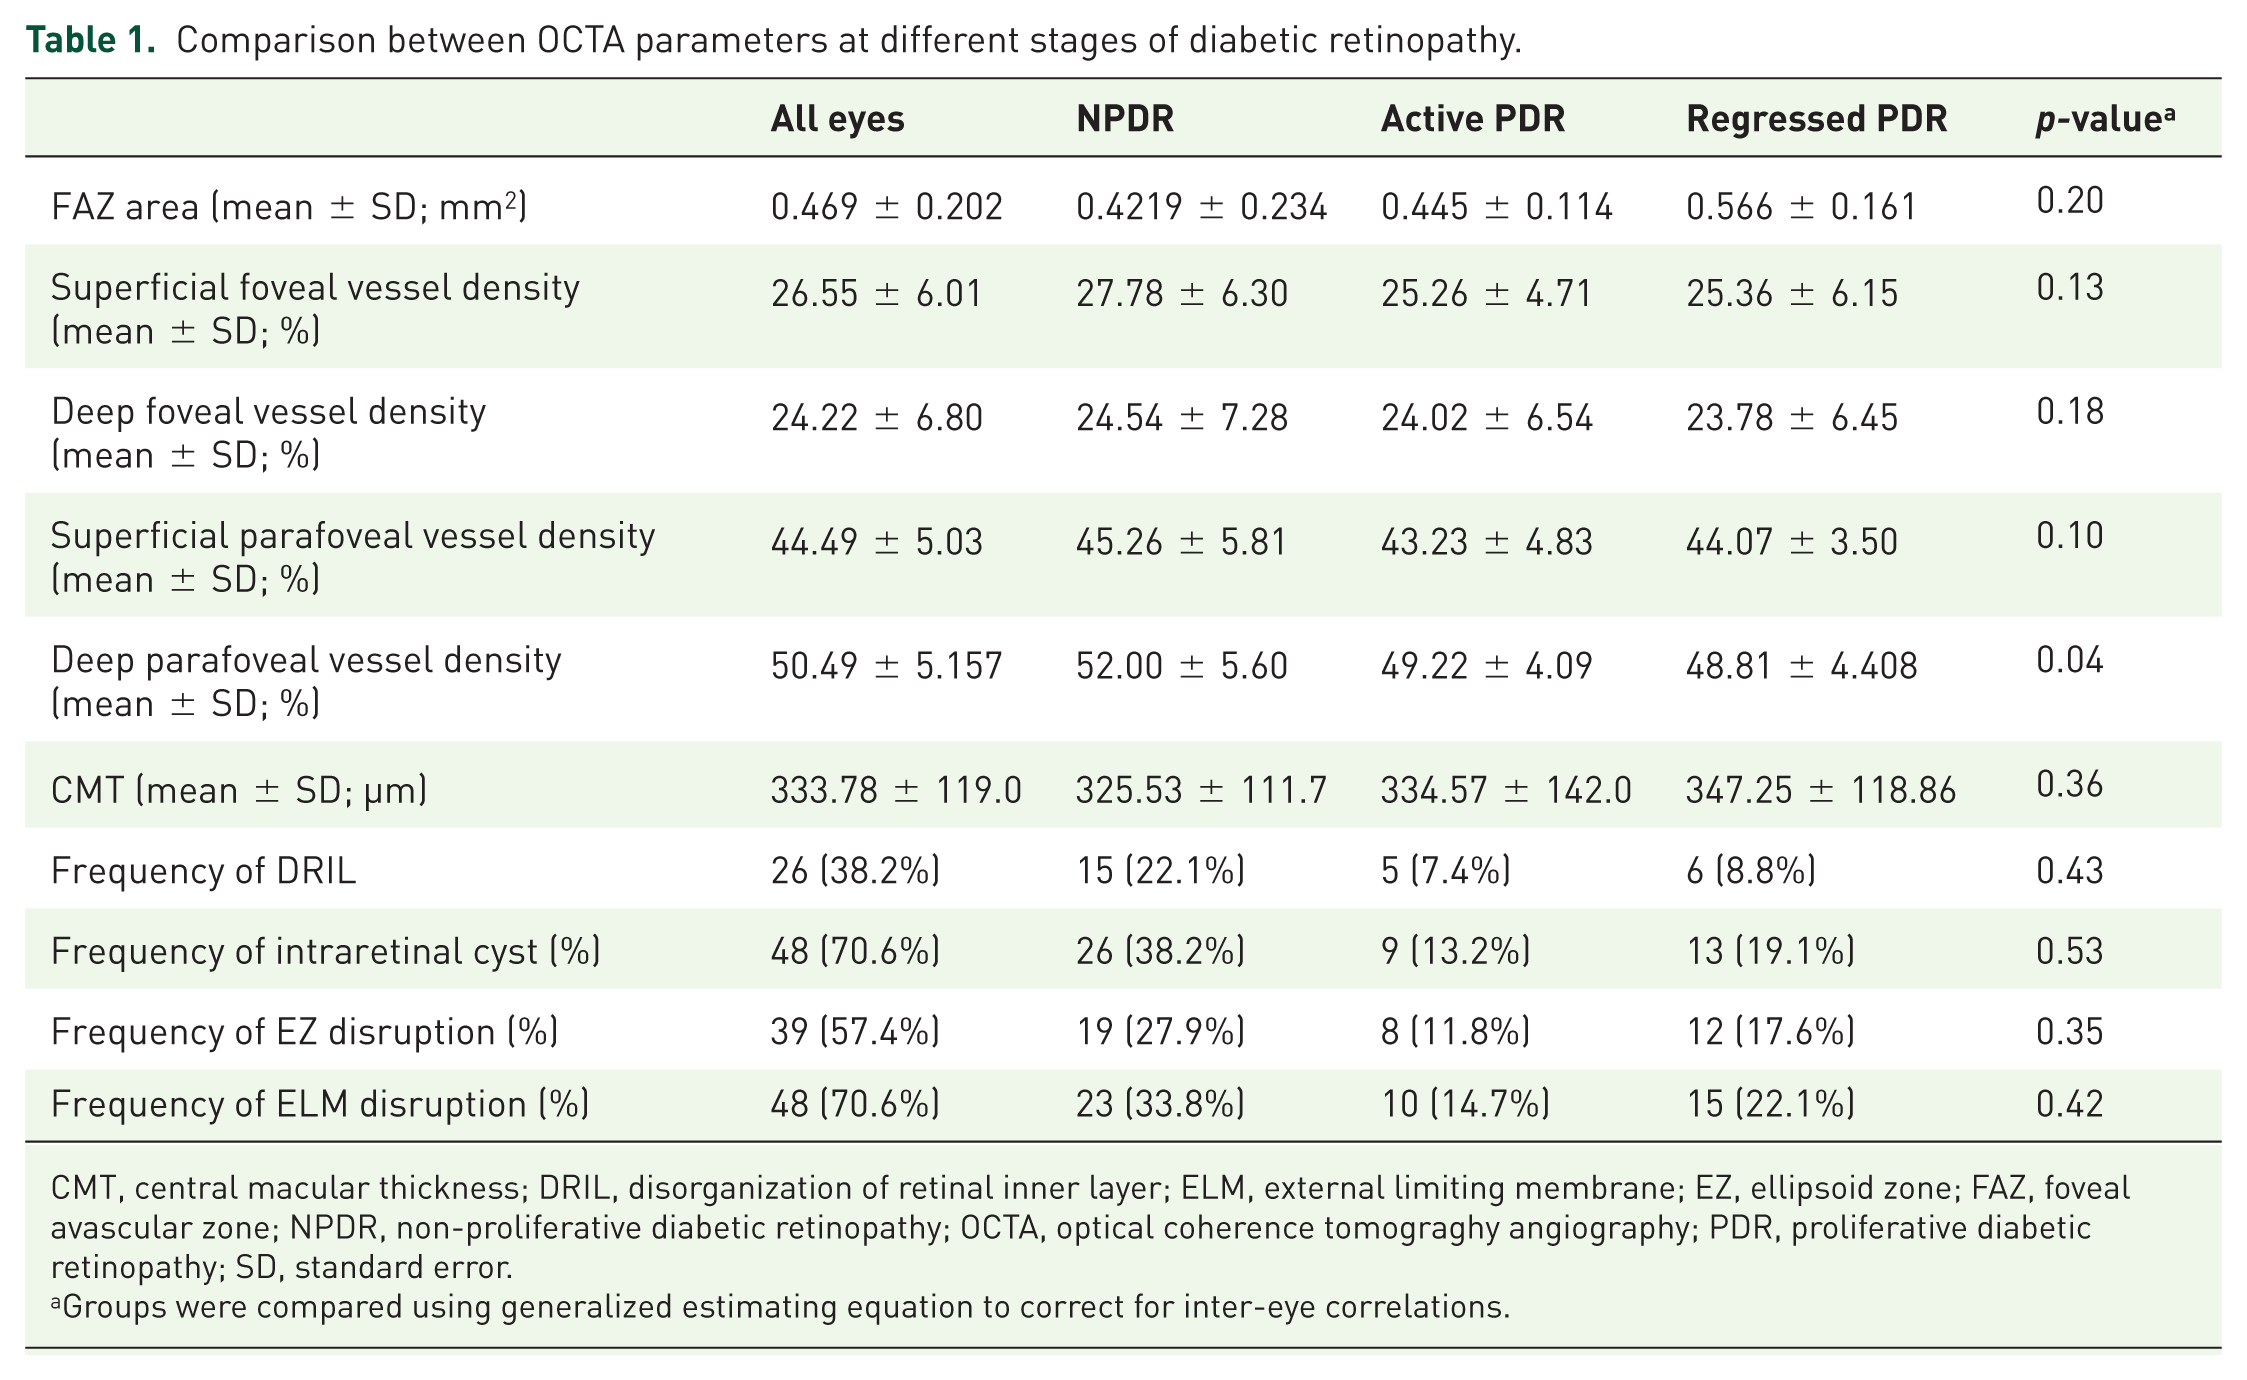
CMT, central macular thickness; DRIL, disorganization of retinal inner layer; ELM, external limiting membrane; EZ, ellipsoid zone; FAZ, foveal avascular zone; NPDR, non-proliferative diabetic retinopathy; OCTA, optical coherence tomograghy angiography; PDR, proliferative diabetic retinopathy; SD, standard error.
Groups were compared using generalized estimating equation to correct for inter-eye correlations.
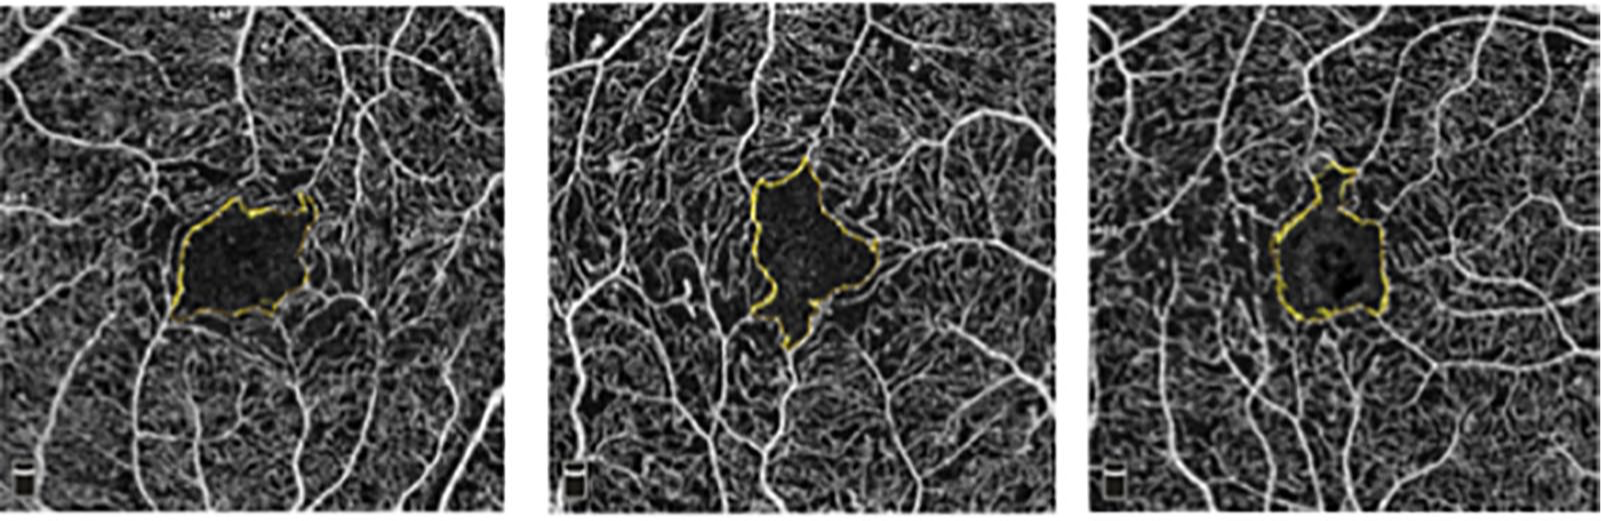
En face optical coherence tomography angiography of an eye with NPDR (left image), an eye with active PDR (middle image), and another eye with regressed PDR (right image) showing similar foveal avascular zone area (all 0.44 mm2) and superficial foveal vessel density (24.7%, 24.8%, and 25.6%, respectively). Superficial parafoveal vessel density was 52.6%, 48.8%, and 49.9%, respectively.
Univariate analysis was separately done on age, sex, FAZ area, superficial foveal VD, deep foveal VD, superficial parafoveal VD, deep parafoveal VD, CMT, intraretinal cyst, EZ disruption, DRIL, ELM disruption, and DR stage to reveal the relationship with VA. Significant association was found in CMT, EZ disruption, DRIL, and ELM disruption (Table 2). Marginally significant association was found in deep parafoveal VD (p = 0.06). To assess the effect of different factors on VA, multivariate analysis was generated based on indices with significant relationship in univariate analysis. Significant association was found in CMT and EZ disruption. Multivariate analysis revealed no significant association between FAZ area and VA (r = 0.088, p = 0.58; Table 3). Similarly, there was no significant correlation between FAZ and VA when considering all NPDR eyes in a single group and all PDR and regressed PDR eyes in another group (β = 0.187, p = 0.10).
Summary of univariate regression model using VA as the major outcome.

CI, confidence interval; CMT, central macular thickness; DR, diabetic retinopathy; DRIL, disorganization of retinal inner layer; ELM, external limiting membrane; EZ, ellipsoid zone; FAZ, foveal avascular zone.
Regression model was calculated using generalized estimating equation to correct for inter-eye correlations.
Summary of multivariate regression model using VA as the major outcome.

CI, confidence interval; CMT, central macular thickness; DR, diabetic retinopathy stage; DRIL, disorganization of retinal inner layer; ELM, external limiting membrane; EZ, ellipsoid zone; FAZ, foveal avascular zone.
Regression model was calculated using generalized estimating equation to correct for inter-eye associations.
Univariate analysis revealed FAZ size had a significant relationship with superficial foveal VD, deep foveal VD, superficial parafoveal VD, and deep parafoveal VD. Multivariate analysis revealed FAZ area had a significant association with superficial foveal VD (p-value = 0.005).
Discussion
This study evaluated various factors to predict VA of patients with DR. Based on multivariate analysis, CMT and EZ disruption were independently associated with VA. We observed no significant relationship of OCTA parameters including FAZ area and VD with VA. In addition, FAZ area was not significantly different between various stages of DR. Deep parafoveal VD was the only variable varied significantly between patients with NPDR, PDR, and regressed PDR. We also found FAZ area was correlated with VD at foveal SCP in patients with DR.
The use of OCTA metrics has been previously reported to identify whether FAZ or VD is related to VA in patients with DR. Freiberg and colleagues 15 reported that maximum FAZ dimension was correlated with VA in DR. Later, Samara and colleagues 7 showed that FAZ area and VD at superficial and deep capillary layer had a significant relationship with VA. Balaratnasingam and colleagues 13 investigated the relationship of FAZ area with VA considering the effect of macular structural abnormalities. They suggested FAZ area as an independent predictor of VA in DR. However, we did not find the same outcome despite having a reasonable sample size at least higher than the previous reports. Part of this discrepancy might be explained by different techniques to measure FAZ resulted in fewer motion and projection artifacts of newer software.16,17 Inter-individual differences and wide range of normal FAZ in healthy eyes and morphologic features have already been documented.18,19
In contrast to FAZ and VD, macular structural changes had a significant relationship with VA in univariate analysis. Previously, DRIL has been suggested as a predictor of VA in patients with current or resolved diabetic macular edema (DME). 20 We found EZ disruption was an independent predictor of VA from multivariate analysis. Similarly, Balaratnasingam and colleagues found the association of EZ disruption with VA as well as FAZ and VD that were related to macular ischemia. Overall, we believe macular structural abnormalities on OCT B scan still more strongly predict VA of patients with DR than OCTA parameters which represent macular ischemia. Macular ischemia causes different degrees of retinal cell dysfunction based on cell ischemic susceptibility and intrinsic ischemia resistance. 21 Therefore, ischemia-induced retinal cell dysfunction might not always resulted severe visual loss. 22 Moreover, OCTA may not detect macular capillary blood flow below the threshold of device recognition. Therefore, it may partially be reasonable to observe capillary nonperfusion on OCTA image without substantial VA deterioration. However, structural macular damages on OCT can reflect irreversible photoreceptor or inner retinal cells destruction with negative visual impact.
We categorized participants into three groups based on DR stage (NPDR, PDR, and regressed PDR). The results showed no significant FAZ enlargement with DR progression in favor of previous reports,7,16,23 although it is not confirmed by all studies.24–26 Bhanushali and colleagues and Samara and colleagues found significant enlargement of FAZ and decline of VD in patients with DR compared with diabetic patients without retinopathy and controls. However, there was no significant difference in the size of FAZ area and VD between various stages of DR.7,23 We found even progression into proliferative stage was not associated with FAZ enlargement. Although the size of FAZ and VD are different between diabetic patients and normal subjects, it seems they lack the ability to differentiate severity stages of DR.
Compared with previous reports, our study provided a comparable sample size performed solely on patients with DR at various stages, having two expert independent graders for FAZ assessment. Nevertheless, there are several limitations in our study. First, patients with DR were enrolled in the study regardless of DME occurrence. Second, the study did not contain two groups of participants: control healthy subjects and diabetic patient with no DR. Abnormal features on OCTA and OCT could already be detected at preclinical stage of DR. 27 Hence, their exclusion would be affecting the results. Third, ocular axial length was not directly evaluated in our study. Although we excluded patients with high refractive error, axial length has been proposed as a significant source of error for FAZ measurement. 28 Finally, we did not include measures of metabolic control (e.g. HbA1c) in our study.
In conclusion, our study indicates OCTA-derived indices including FAZ and VD had no significant relationship with VA at various stages of DR. Furthermore, their ability to discriminate various stage of DR was poor. In contrast, disease-derived structural abnormalities on OCT image with especial focus on outer retinal disruption provided more reliable tools to predict VA outcome in patients with DR. Future studies with larger sample size is needed to verify our findings.
Footnotes
Author contributions
H.S. and P.A. were involved in writing the article, collecting data, literature search, analysis and interpretation, critical revision of the article, and final approval of the article; D.N., H.S., P.K., P.F., S.J., and A.S. were involved in data collection, critical revision of the article, and final approval of the article; M.Y. contributed to analysis and interpretation, critical revision of the article, and final approval of the article; K.G.F. was involved in writing the article, conceptualization and design, data collection, analysis and interpretation, critical revision of the article, final approval of the article, provision of materials, patients or resources, and literature search.
Funding
The authors declared the following potential conflicts of interest with respect to the research, authorship, and/or publication of this article: This study was supported by the grant (no. 95-04-124-30160) from Eye Research Center, The Five Senses Institute, Iran University of Medical Sciences.
Conflict of interest statements
The authors declared no potential conflicts of interest with respect to the research, authorship, and/or publication of this article.