
Abstract
The present study was designed to investigate the antioxidant property of
Diabetes mellitus is one of the most common endocrine disorders resulting from defects in insulin secretion or insulin action. 1 Diabetes can lead to complications in various organs, especially the male reproductive system. Various mechanisms may explain the reproductive system damage observed in patients with diabetes mellitus. These include the deficiency in sexual hormones, the higher production of free radicals, and increased oxidative stress. Though various factors are involved in the generation of such complications, today more research is focused on the role of free radicals and oxidative stress. 2 Several studies have shown that diabetes results oxidative stress and decreases antioxidants enzyme. 3–5 Figueroa et al. 4 in a study on diabetic patients concluded that diabetes increase ROS and decrease antioxidants. Function of the testes depends on sexual hormones such as follicle-stimulating hormone (FSH), luteinizing hormone (LH), and testosterone (TH). Several studies have shown that diabetes reduces sexual hormones level. 5,6 Ballester et al 6 investigated the effect of diabetes on testis function and indicated that the serum levels of FHS, LH, and TH hormones significantly decreased.
In recent years, the trend toward new drugs that have fewer side effects is increasing. The carnitine antioxidant (3-hydroxy-4-N-trimethylaminobutyric acid) is obtained from the diet rich in meat and dairy products.
LC is a water-soluble molecule and a vitamin-like molecule structurally. In the body, 75% of LC is taken up by diet and 25% is synthesized endogenously from 2 essential amino acids lysine and methionine, and they are stored in skeletal muscles, heart, brain, and testes. 9 The highest level of LC is found in epididymis and sperm, in which its concentration is about 2000 times higher than that in plasma. 10 In addition, LC transports long-chain fatty acids from the cytosol into mitochondria and facilitates β-oxidation of long-chain fatty acids in mitochondria and it is necessary for energy production. 11,12 LC serves as a substantial nonenzymatic antioxidant and protects the cell, mitochondrial membrane, and DNA against damage induced by oxygen free radicals. 13 Several studies have been performed to evaluate the antioxidant effect of carnitine, the results of which indicate improvement of antioxidant enzymes, and the reduction of oxidative stress in various tissues. Kanter et al 14 and Virmani and Diedenhofen 15 showed that applying LC following radiotherapy significantly reduced MDA level and increased the level of the antioxidants such as superoxide dismutase (SOD) and glutathione (GSH) and catalase (CAT).
In the literature, effects of LC on testis oxidative stress, antioxidant levels, and serum sex hormones levels when induced by diabetes, are not clear. Therefore, the present study was designed to investigate the effects of LC on the FSH, LH, and TH levels and testis tissue oxidative stress in streptozotocin-induced diabetic adult Wistar rats.
Materials and Methods
Chemicals
All chemicals were purchased from Sigma-Aldrich Chemical (St Louis, MO, USA). Sex hormones kits were purchased from East Bio Pharm Company (USA).
Animals
Thirty-six adult male Wistar rats (8-10 weeks, 220 ± 30 g) were purchased from the laboratory animal center of Mazandaran University of Medical Sciences. The rats were housed under the standard conditions (the temperature 22° to 24°C and 12-hour dark/12-hour light) and were fed standard rat chow and water throughout the experiment. The animals were looked after in line with the guidance of the National Institutes of Health. For a week before starting the experiment, they were adapted with the laboratory conditions. The rats were weighed and then their blood samples were taken from the tail vein with the glucometer (Bionime model, Taiwan). All animal experimentation protocols were carried out under supervision of the Ethics Committee of Mazandaran University of Medical Sciences. This experiment was performed under the approval of the state committee on animal ethics, Mazandaran University, Mazandaran, Iran. Also, the recommendations of European Council Directive (86/609/EC) of November 24, 1986, regarding the standards in the protection of animals used for experimental purposes were followed.
Induction of Diabetes
To induce diabetes, after fasting overnight (access to water only), a single-dose intraperitoneal injection of freshly prepared streptozotocin (STZ) was given (60 mg/kg of body weight dissolved in 0.1 M sodium citrate buffer, pH 4.6) (STZ, S0130-500 MG, Sigma-Aldrich Co, USA). After STZ injection, the animals were allowed to drink glucose solution 5% (w/v) overnight to avoid hypoglycemia, which may be induced by STZ. Diabetes was confirmed 72 hours after injection of STZ. For this aim (after an overnight fasting) the blood of fasting animals was collected from tail vein by using of 24-gauge needle and glucose levels were determined with a glucometer. Rats with fasting blood glucose levels ≥300 mg/dL were considered diabetic. 16 To investigate the long-term effects of diabetes on the testicular tissue, rats were kept in their own cages at the standard condition for 2 weeks to chronic diabetes after confirmation of diabetes. It has been reported that acute phase of diabetes develops over 2 weeks and chronic phase of diabetes occurs after this time of induction of diabetes. 17 In the control group, a single dose of 0.5 mL 0.1 M sodium citrate buffer (as vehicle) was injected. 18
Study Design
The rats were randomly divided into 6 experimental groups (n = 6) as follows: group I, control (Ctl): first received a single dose of 0.5 mL 0.1 M sodium citrate buffer and after 2 weeks was injected 0.5 mL/d of distilled water intraperitoneally; group II or sham, received 100 mg/kg of body weight per day intraperitoneally of LC (Sigma, C0283-5G, USA, was dissolved in distilled water); group III diabetic (D) rats were injected with a single dose of STZ 60 mg/kg of body weight per day intraperitoneally, after chronic diabetes was injected 0.5 mL/d distilled water intraperitoneally; group IV (D + LC50) rats received LC 50 mg/kg of body weight per day intraperitoneally; group V (D + LC100) rats received LC 100 mg/kg of body weight per day intraperitoneally; and group VI (D + LC200) rats were injected with LC 200 mg/kg of body weight per day, intraperitoneally. 19 The rats in groups IV to VI, were treated with doses 50, 100, and 200 mg/kg of LC intraperitoneally from 2 weeks after the induction of diabetes until end of study. The rats in groups I and III received normal saline (intraperitoneally) daily equal to treated groups from 2 weeks after induction of diabetes until end of study. All the treatments were continued for 7 weeks after acute phase of diabetes (according to the spermatogenesis period in rat). 20
At the end of each experimental period, the rats were weighed and fasting blood sugar (FBS) was measured. The animals of all groups were sacrificed under ether anesthesia, the blood samples were collected and were centrifuged at 3000 rpm for 15 minutes to separate serum. The prepared serum was stored at −20°C to analyze the sex hormones and total antioxidant capacity (TAC).
Testis Homogenization Process
The rats were sacrificed under ether anesthesia, the right testis was rapidly removed, and was washed with cold mannitol buffer (pH 7.4) (contain sucrose 6.4 g, mannitol 11.64 g, ethylenediamine tetraacetic acid [EDTA] 0.009 g, 250 mL distilled water [DW]), after fragmentation, homogenized manually in the mannitol buffer. Then, it was poured into the micro tubes. The homogenized tissue was first centrifuged at 2000 rpm for 10 minutes at 4°C, then with a sampler the supernatant was transferred gently to a new micro tube and the pellet was discarded. The supernatant was centrifuged at 8000 rpm for 15 minutes, then supernatant was removed. The final pellet containing mitochondria was homogenized and aliquot into 2 Falcon tubes, were suspended in Tris-HCl buffer (containing sucrose 8.5 g, Tris-HCl 0.079 g, MgCl2 0.019 g, KCl 0.149 g, and Na2HPO4 0.268 g, DW 100 mL; pH 7.4) or respiration buffer (containing sucrose 10.944 g, Tris-HCl 0.157 g, MgCl2 0.0476 g, KCl 0.149 g, and K2HPO4 0.0013 g, succinate 0.135 g, EDTA 0.007 g, MOPS 0.418 g, HEPES 0.297 g, DW 100 mL, pH of 7.4) for assessment oxidative stress biomarkers. 21,22
Determination of Protein Concentration
Protein concentration were measured using the Coomassie blue protein-binding method as explained by Bradford. 23 Briefly, for preparation stock Coomassie solution, 0.05 g Coomassie blue, 25 mL methanol, and 5 mL phosphoric acid was dissolved in 200 mL DW and kept in refrigerator. For use, Coomassie solution was diluted with DW (1:4). All processes were carried out on ice to reduce degradation. For preparation standard solutions, we first prepared albumin standard solution with 2000 concentration by dissolving 0.02 g albumin in 20 mL DW. Then, according to albumin 2000 standard, the other albumin standard solutions were prepared as follows: standard 250 (0.5 mL standard 2000 + 3.5 mL DW), standard 500 (1 mL standard 2000 + 3 ml DW), standard 1000 (1 mL standard 2000 + 1 ml DW), standard 1500 (3 mL standard 2000 + 1 mL DW), standard 2000 (10 mL standard 2000 + 0 mL DW). In Falcon tubes first to fifth were poured 100 μL each of prepared standard solutions 250 to 2000, respectively, and in Falcon tube 6 was poured 100 μL sample. Then to each of the 6 tubes, 5 μL of working Coomassie solution was poured and mixed well. After 10 minutes, these 6 tubes were read at 595 nm wavelength by a spectrophotometer. After reading the wavelengths, the wavelength of the sample with the standard solutions was checked with that of the sample. Based on this, the sample concentration was adjusted to 1000 standard concentration. If the concentration of the sample was close to 2000, the sample was diluted twice with the Tris-HCL buffer, and if it was close to 1500, the sample was diluted with one-third of the Tris-HCL buffer to reach at a standard concentration of 1000. The sample, which reached a standard concentration of 1000, was then used to measure oxidative stress biomarkers.
Biochemical Analysis
Determination of Total Antioxidant Capacity (TAC)
TAC was measured by ferric reducing ability of plasma (FRAP) by Benzie and Strain. 24 In brief, the ability of plasma to reduce Fe3+ ions to Fe2+ ions was measured. Working FRAP reagent was prepared as required by mixing acetate buffer (300 mmol/L, pH 3.6) with 1 mL tripyridil-s-triazine (TPTZ) (0.0312 g TPTZ in 10 mL 40 mM HCl) in 40 mmol/L HCl and 20 mmol/L FeCl3. 1.5 mL of FRAP reagent was added to a test tube and kept at 37°C for 5 minutes. Then 50 μL of rat serum was added to it. The complex between Fe2+ and TPTZ demonstrated the blue color which measured at 593 nm compared with blank tube (containing 1.5 mL FRAP in 50 μL DW) by a spectrophotometer. 25 Also, 50 μL of each of standard solutions were added to this tube and the optical density was measured, which was then put on the standard diagram to determine the concentration. 26
Determination of Lipid Peroxidation (LPO)
Malondialdehyde (MDA) is an end product of the oxidation of polyunsaturated fatty acids. 200 μL of phosphoric acid 85% and 25 μL of thiobarbituric acid (TBA) were added to the 2 micro tubes containing 0.2 mL mitochondrial fractions (0.5 mg protein/mL) and then placed in a boiling water bath for 30 minutes. The tubes were shifted to an ice-bath to decrease temperature for 3 minutes. The solution was centrifuged at 6000 rpm for 6 minutes. Fatty acids reacted with TBA to produce a purple complex that can be determined by the spectrophotometer. Finally, the supernatant absorption was measured at 535 nm with ELISA (enzyme-linked immunosorbent assay) reader. The level of tissue MDA was expressed as nmol/mg of protein. The method was calibrated with tetramethoxypropane and ethanol 40% standard solutions. 27
Determination of Catalase (CAT) Activity
The CAT enzyme activity was evaluated based on the disappearance of H2O2 in a reaction medium containing sodium phosphate buffer (50 mM, pH 7.0) and H2O2 (10 mM) according to the method described by Aebi. 28 The decrease in absorbance of H2O2 was determined with a spectrophotometer at 240 nm. One unit of the enzyme is defined as 1 mol H2O2 as substrate consumed per minute and the activity was reported as unit/mg protein. 29
Glutathione (GSH) Assay
The GSH level was determined by the method of Beutler et al. 30 The homogenized tissue was mixed with 1.5 mL EDTA reagent and then the 1.5 mL trichloroacetic acid (TCA) solution (TAC 10%: first, 3.722 g EDTA dissolved in 500 ml DW, then, 5 g TCA dissolved in 50 mL first solution) was added. The tube was centrifuged at 3500 rpm for 15 minutes. Then 1 mL of supernatant was mixed with 2.5 mL Tris buffer (pH 8.9) and 500 μL TNB reagent (0.245 g TNB dissolved in 250 mL phosphate buffer). The yellow color solutions so developed was read at 412 nm on a spectrophotometer. GSH content was expressed as µmoL/mg protein. 31 The GSH standards were prepared by dissolving 0.0115 g GSH in 100 mL DW.
Determination of Protein Carbonyl
PC was measured by spectrophotometric method. Briefly, in 2 micro tubes (control and treatment) containing 200 μL of homogenized tissue was added Tris-HCl buffer to make a volume of 1000 μL. Then 500 μL of 20% (w/v) TCA and EDTA was added. The samples were placed at 4°C for 15 minutes. The micro tubes were centrifuged at 6500 rpm for 10 minutes, and the supernatant were discarded. The pellets were suspended in 500 μL 0.1 NaOH, and then were added 500 μL DNPH (dinitrophenylhydrazine) (10 mM in 2 M HCl) for treated micro tube and only 500 μL 2 M HCl for the control micro tube. The micro tubes were wrapped in foil and placed at room temperature for 30 minutes with vortexing at 5-minute intervals. Next, 500 μL EDTA + TCA(20%) were added to each micro tube, which were then centrifuged at 6500 rpm for 10 minutes. The supernatants were removed, and the pellets were suspended with 1000 μL of the ethanol–ethyl acetate (1:1, v/v) mixture. The micro tubes were centrifuged at 6500 rpm for 10 minutes. The supernatant was removed, and the pellets suspended in 200 μL of 6 M guanidine hydrochloride. The carbonyl content was determined by reading the absorbance at 365 nm wavelength on a spectrophotometer. 32,33
Evaluation of Mitochondrial Toxicity (MTT)
Mitochondrial toxicity was assessed by measuring the reduction of MTT (3-[4,5-dimethylthiazol-2-yl]-2, 5-diphenyl tetrazolium bromide using the method explained by Ghazi-Khansari et al. 34 Briefly, MTT is reduced by living cells to insoluble purple MTT formazan crystals using succinate dehydrogenase enzyme. One hundred microliters mitochondrial suspensions were incubated with Tris-HCl buffer in a well of 96-well dish at 37°C for 30 minutes. Then 50 µL of MTT was added to the solution and incubated for 3 hours. Then 50 µL dimethyl sulfoxide was added, and the insoluble formazan crystals were dissolved in the solution of dimethyl sulfoxide. It was placed in a dark environment for half an hour, then MTT solution of well was extracted with the sampler. Finally, the absorbance of the colored suspension was measured at 490 to 540 nm using the ELISA reader. 35
Determination of Reactive Oxygen Species
ROS production was measured using dichlorofluorescein diacetate (DCFH). DCFH (1.2 mg) was dissolved in 1 mL ethanol and put on ice. The primary homogeneous tissue was dissolved in the respiration buffer, and after determining the protein, the volume was filled with respiration buffer to 1 mL. In tube 1, 2 mL homogeneous tissue was dissolved in the respiration buffer and in tube 2, 2 mL respiration buffer was filled. Then, 10 µL DCFH was added to each tube, were incubated with DCFH for 15 minutes. Finally, ROS was determined at 480 to 520 nm through fluorimetry. 36
Hormonal Measurements
The serum levels of FSH, LH, and TH were measured using commercially available ELISA kits (rat testosterone ELISA KIT Category No. E90243, rat luteinizing hormone ELISA KIT Category No. CK-E90904, rat follicle-stimulating hormone ELISA KIT Category No. CK-30597) according to the manufacturer’s instructions. (From East Bio Pharm Company). Fifteen minutes after adding a stopper solution, absorption of standards and samples at 450 nm wavelengths were read by ELISA (BioTeK-Synergy H1, USA).
Statistical Analysis
Data were analyzed by using GraphPad Prism 6.01 software. The results were expressed as mean ± SD. One-way analysis of variance was performed, and Tukey’s post hoc test was used for multiple comparisons. Differences of P < .05 were considered significant.
Results
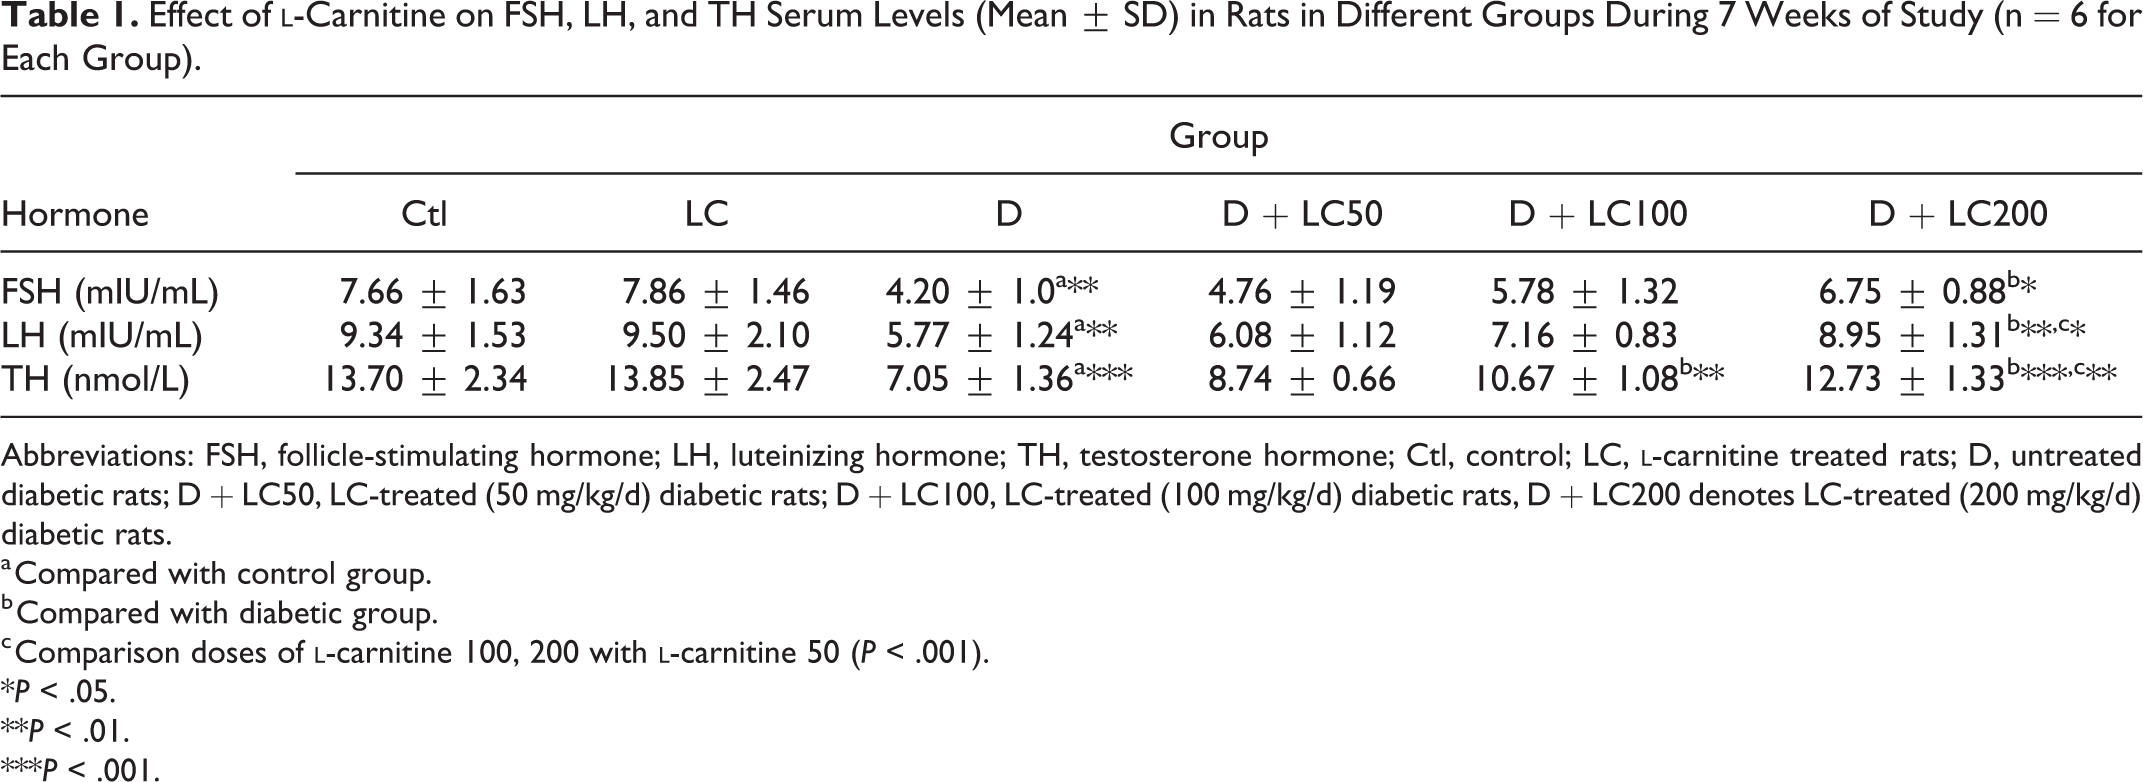
Effect of l -Carnitine on Gonadotropin and Testosterone Hormones Level in Rat Serum
As shown in Table 1, diabetes significantly decreased FSH, LH, and TH levels (P < .01) and while in the animals treated with
Effect of
Abbreviations: FSH, follicle-stimulating hormone; LH, luteinizing hormone; TH, testosterone hormone; Ctl, control; LC,
a Compared with control group.
b Compared with diabetic group.
c Comparison doses of
*P < .05.
**P < .01.
***P < .001.
Effect of l -Carnitine on the Biomarkers of Oxidative Stress in Rat Testis
MDA, as a marker of LPO, and as an end product of the oxidation of fatty acids, significantly increased in diabetic group versus control group (P < .001). MDA level in the diabetic groups receiving LC100 (P < .01) and LC200 (P < .001) versus the diabetic group had a significant decrease. The MDA level in diabetic group receiving LC200 significantly decreased versus the diabetic group receiving LC50 (P < .001) (Figure 1A).

Effect of
PC as a marker of protein oxidation in the diabetic group significantly increased versus the control group (P < .001). PC in the diabetic group receiving LC200 versus the diabetic group significantly decreased (P < .01) (Figure 1B).
MTT, mitochondria function was evaluated by assessing the MTT test, in the diabetic group significantly decreased versus the control group (P < .001), while the diabetic groups receiving LC showed a significant increase (P < .001) in a dose-dependent manner versus the diabetic group (Figure 1C).
TAC in the diabetic group significantly decreased versus the control group (P < .001). In the diabetic groups receiving LC100 (P < .05) and LC200 (P < .001) versus the diabetic group had a significant increase. TAC in the diabetic group receiving LC200 significantly increased versus the diabetic group receiving LC50 (P < .01) (Figure 1D).
GSH in the diabetic group significantly decreased versus the control group (P < .001). GSH in the diabetic groups receiving LC100 (P < .05) and LC200 (P < .01) versus the diabetic group had a significant increase. The diabetic group receiving LC200 showed significantly increased GSH compared with the diabetic group receiving LC50 (P < .01) (Figure 1E).
CAT activity in the diabetic group significantly decreased versus the control group (P < .001). CAT activity in the diabetic groups receiving LC100 (P < .05) and LC200 (P < .01) versus the diabetic group had a significant increase. The diabetic group receiving LC200 showed significantly increased CAT activity versus the diabetic group receiving LC50 (P < .01) (Figure 1F).
ROS in the diabetic group significantly increased versus the control group (P < .001). In the diabetic groups receiving LC100 (P < .05) and LC200 (P < .01), ROS showed a significant decrease versus the diabetic group. The diabetic group receiving LC200 showed significantly decreased ROS versus the diabetic group receiving LC50 (P < .01) (Figure 1G).
Discussion
In the present study, we found that MDA, PC, and ROS levels significantly increased in untreated diabetic group versus the control group, and CAT, GSH, TAC, and MTT levels were significantly decreased in diabetic group versus control group in the isolated rat testis mitochondria. The results of the present study confirm previous studies. 37,38
Diabetes can cause different lesions that several factors are involved, but the role of oxidative stress and free radicals has been more focused in the pathogenesis of these lesions. Oxidative damage mechanisms during diabetes include excessive ROS production, glucose auto-oxidation, synthesis of end products of glycation, and the reduction of antioxidant levels in the cell. Involvement of oxidative stress in the pathogenesis of diabetes is suggested not only by the generation of free radicals, especially ROS, but also because of nonenzymatic protein glycosylation, auto-oxidation of glucose, impaired glutathione metabolism, modification in antioxidant enzymes, and lipid peroxides formation. 39 –41 During diabetes, lipid peroxidation can be induced by ROS in the testis mitochondria and cause damage to the testis. 42 The formation of ROS is the result of an imbalance between antioxidants and pro-oxidants, ultimately deregulating cellular functions. 43 These ROS include oxygen free radicals such as superoxide, hydroxyl, peroxyl, alkoxyl, and hydroperoxyl radicals, which cause tissue damage by a variety of mechanisms, including DNA damage (DNA oxidation), lipid peroxidation (attack of free radicals on polyunsaturated fatty acids), protein oxidation, and depletion of thiols. 44 Also, superoxide anion plays an important role in the formation of other ROS such as hydrogen peroxide, hydroxyl radical, and singlet oxygen, which induce oxidative damage in lipids, proteins, and DNA. In this case, cellular functions are disrupted and structures are damaged, eventually leading to numerous pathological conditions. 43,45
Furthermore, the results of this study showed that the oxidative stress biomarkers levels such as MDA, PC, and ROS levels were significantly decreased (P < .001) and CAT, GSH, and TAC levels were significantly improved in the diabetic groups receiving LC versus untreated diabetic group. In these treated groups, the MDA and ROS were significantly decreased in both doses of 100 and 200 mg of LC. However, PC was significantly decreased in LC dose 200 mg/kg only. Also, GSH, CAT, and TAC levels were significant in both doses of 100 and 200 mg/kg of LC. This may be due to a reduction in free radical production and enhancement antioxidant content and free radical scavenging activity of LC. 46 It is likely that LC interacts with the arachidonic acid forming phospholipid, as well as protein kinase c, to reduce lipid peroxidation and oxidative stress. 47 These results are consistent with the previous studies. 48 –50 Therefore, it seems that the protective effect of LC against diabetes is dose dependent. However, further investigations are required with several higher doses of LC to prove it.
In the present study, diabetes treatment decreased mitochondrial GSH content and treatment with LC increased GSH content. The previous study indicated that the administration of LC resulted in elevation of antioxidant enzymes like catalase, SOD, and GSH. 51,52 The antioxidant defense system is composed of mainly 3 enzymes—glutathione peroxidase, CAT, and SOD. LC, an antioxidant, can protect these enzymes from further peroxidative damage. 53 Previous studies have suggested several molecular mechanisms for the GSH protective action: GSH is considered the principal mitochondrial antioxidant and inhibits lipid peroxidation by scavenging free radicals. 51 GSH maintains the membrane integrity and promotes the nonenzymatic detoxification of hydroxyl radicals. 54 Arduini 55 showed the antioxidant role of LC, and this mechanism protects cells against oxidative damage caused by free radicals.
In our study, mitochondria function was evaluated by assessing the MTT test. Percentage of mitochondria function was significantly decreased in untreated diabetic group versus control group (P < .001), However, MTT percent was significantly increased in animal treated by doses 100 and 200 mg/kg LC against untreated diabetic group (P < .01 and P < .001, respectively) (Figure 1C). Therefore, higher mitochondrial function in the treated groups might be due to the presence of high levels of antioxidant compounds in the treatment tested. LC increases the levels of intracellular antioxidant enzymes such as GSH and CAT, and it increases energy production by protecting mitochondria. In general, antioxidants inactivate free radicals with 2 main mechanisms: (1) Hydrogen atom transfer (HAT) reaction—the antioxidant compounds by transmitting hydrogen atom to free radical causes its inactivation in the environment. (2) Single electron transfer (SET) reaction—the antioxidants perform their function by transferring single electrons to free radicals, metals, or carbonyl groups in the reaction medium. 56
LPO (MDA) and PC are common biomarkers for the evaluation of oxidative damage generated by free radicals. PC that was formed by protein oxidation was evaluated in this study, and it was found to be remarkably increased in the diabetic group. The results of the present study illustrated that protein oxidation and lipid peroxidation were formed in the testis mitochondria by diabetes. Also, the results showed that PC content in testis mitochondria significantly decreased after treatment with the LC, especially at a dose of 200 mg/kg. Therefore, LC may trap the carbonyls and prevent protein carbonylation. Salmanoglu et al 57 in their study have reported that the level of MDA in the LC-treated diabetic group was significantly lower than that of the diabetic group. LC reduced liver MDA and improved GSH levels in the liver and improved the activity of SOD and CAT in red blood cells. In addition, Dokmeci et al 58 in their study of the role of LC on oxygen free radicals have shown that the use of LC prior to radiotherapy significantly reduced liver MDA and improved GSH levels in the liver and also, improved the activity of SOD and CAT in red blood cells. Moreover, studying the antioxidant role of LC on reduction of radiotherapy-induced complications in various tissues such as brain, liver, and retina showed that using LC before or after radiotherapy significantly decreased the level of MDA and ROS and improved GSH and CAT levels. 59 –61
Our results revealed that CAT significantly increased in diabetic groups treated with LC versus untreated diabetic group. Oxidation of biological molecules can be induced by hydroxyl (OH−ċ) radicals generated by hydrogen peroxide (H2O2). CAT is an important defense mechanism against the toxic effects of oxygen metabolism. The antioxidant enzymes CAT and glutathione peroxidase (GPx) protect SOD against inactivation by H2O2. Reciprocally, SOD protects CAT and GPx against superoxide anion. Thus, the balance of this enzyme system is essential to dispose the superoxide anion and peroxides generated in the testis. 62 It seems that ROS formation by the intracellular H2O2 generation system can be decreased by LC and LC was able to scavenge superoxide anion, to inhibit the lipoperoxidation. 63
Also, this study illustrated that the serum levels of TH, FSH, and LH in the untreated diabetic rats significantly were decreased, which after treatment with the LC significantly increased. The previous studies of researchers confirmed the present result. 64 Shi et al 65 have reported the effect of LC on sex hormones in diabetic patients. Their results indicated that the serum levels of FHS, LH, and TH significantly decreased but the trend was reversed by LC. 65 Also, El-Damarawi et al, 64 in their study on infertility disorders in obese men, showed that LC increased the serum levels of TH, FSH, and LH hormones. Various mechanisms may explain the effect of LC on improving of hormones levels: Diabetes increases of production of free radicals and reduces of the antioxidants enzymes leading to oxidative stress, which subsequently decreased LH, FSH, and TH levels. 66 –69 Therefore, LC acts as an antioxidant by inhibiting free radicals and increasing expression of the antioxidant enzymes such as GSH, CAT leading to reduced oxidative stress. 70 This consequently reduces oxidative stress, decreasing the complications of diabetes-induced oxidative stress on the pituitary-gonadal axis and anterior basophilic pituitary cells, as well as the complications of testicular tissue, which in turn improves the serum levels of sex hormones. 71 In addition, LC due to its antioxidant properties, reduced testicular oxidation stress, led to prevention of the destruction of Leydig cells, and thereby increases TH levels without changing gonadotropin levels. LC can also directly affect the testosterone secretion by decomposition of long-chain fatty acid, which reduces the aromatase enzyme in the adipose tissue, since this enzyme converts TH to estrogen, thereby inhibiting the activity of this enzyme and increasing TH levels in the blood. 72 However, further studies are required to achieve the most effective dose of LC in diabetes mellitus or comparison of therapeutic effect of LC on acute and chronic phases of diabetes mellitus. The limitations of this study arise from 2 issues: the long-term treatment and maintenance of animals.
Conclusion
In summary, our findings provide substantial evidence that LC, especially at a dose of 200 mg/kg, reduces side effects in diabetic rats. LC can increase the levels of antioxidant enzymes activities such as GSH, CAT, and TAC and improve mitochondrial function. In addition, it reduces the oxidative stress markers, such as MDA, PC, and ROS, which in turn modulate the serum levels of FSH, LH, and TH. The results of the present study indicate that intraperitoneal injection of LC significantly decreased the adverse metabolic effects in the serum of rats treated with STZ.
Footnotes
Acknowledgments
The authors would like to thank the Immunogenic Research Center (IRC) of Sari Medical Faculty and Chancellor for Research and Technology of Mazandaran University of Medical Sciences, Mazandaran, Iran, for financial supporting this research. Also, the authors would like to thank the Dr Abdolbaghi Rezaeitalarposhti for editing of the manuscript.
Author Contributions
NR was involved with supervising this work, study conception and design, performed the experiment, analysis and interpretation of data, writing the manuscript, critical revision and submission of the manuscript. TM was involved with performing the experiment, analysis and interpretation of data, and writing the manuscript. MMS was involved with study conception, interpretation of data, editing the manuscript, and critical revision. SA was involved with design of study, performing the experiment, and editing the manuscript. HM was involved with design of study, performing the experiment, and editing the manuscript. ZZ was involved with acquisition of data, interpretation of data, and editing the manuscript.
Declaration of Conflicting Interests
The authors declared no potential conflicts of interest with respect to the research, authorship, and/or publication of this article.
Funding
The authors disclosed receipt of the following financial support for the research, authorship, and/or publication of this article: This study was financially supported by the Immunogenetic Research Center (IRC) of Sari Medical Faculty and Chancellor for Research and Technology of Mazandaran University of Medical Sciences (Project No: 95-2460).
Ethical Approval
Ethical approval for this study was granted by the Ethical Research Committee of Mazandaran University of Medical Sciences (reference number: IR.MAZUMS.Rec.96.2460).