
Abstract
The claims by the traditional herbal medicine practitioners that Kigelia africana has bioactivity against several diseases, including diabetes mellitus, were investigated in this study. Type I diabetes mellitus was induced in mice by intraperitoneal administration of alloxan monohydrate followed by treatment with the therapeutic doses of the aqueous and ethyl acetate leaf extract of K africana to the experimentally diabetic mice. The treatment effects were compared with the normal control, diabetic control, and diabetic control rats treated with a standard antidiabetic drugs (insulin administered intraperitoneally at 1 IU/kg body weight in 0.1 mL physiological saline or glibenclamide administered orally at 3 mg/kg body weight in 0.1 mL physiological saline). Phytochemical composition of the leaf extract was assessed using standard procedures and mineral elements assessed using atomic absorption spectrophotometry and total reflection X-ray fluorescence system. Oral and intraperitoneal administration of the aqueous and ethyl acetate leaf extract caused a statistically significant dose-independent reduction in plasma glucose level in alloxan-induced diabetic mice. The observed hypoglycemic activity of this plant extract could be attributed to the observed phytochemicals and trace elements, which have been associated with exhibiting antidiabetic properties. Therefore, the data appear to support the hypoglycemic effects of K africana validating its folkloric usage.
Keywords
Diabetes mellitus is a chronic metabolic disorder characterized by hyperglycemia caused by an inherited or acquired deficiency in the production of insulin by the pancreas, or by the ineffectiveness of the insulin produced. 1 Patients with mild hyperglycemia do not experience any symptoms and therefore may be unaware they have diabetes for many years. 2 Clinically, symptoms of marked hyperglycemia include thirst (polydipsia), large volume of urine (polyuria), frequent feeling of hunger (polyphagia), feeling of tiredness, blurred vision, and weight gain or weight loss. 3 Acute life-threatening consequences of untreated diabetes mellitus include hyperglycemia with ketoacidosis or nonketotic hyperosmolar coma. In the long term, people with diabetes are predisposed to cardiovascular, peripheral vascular, and cerebrosvascular disease, as well as microvascular complications leading to retinopathy, nephropathy, or neuropathy with an increase in risk of foot ulcers and amputation. 4 The pathophysiological processes involved in the development of diabetes mellitus include exposure to viruses and allergens as well as autoimmune destruction of the β-cells of the pancreas with consequent insulin deficiency due to abnormalities that result in resistance to insulin action. 5,6
Diabetes mellitus has now become an epidemic with a worldwide incidence of about 5%. 7 This has been attributed to increase in prevalence of obesity and physical inactivity, population growth, aging, stress, and changes in food consumption. 7 The prevalence of diabetes for all age-groups worldwide was estimated to be 2.8% in 2000 and 4.4.% in 2030. 7 The number of people with diabetes is projected to rise to 171 million in 2000 to 366 million in 2030. 7,8 In 2010, 12.1 million people were estimated to be living with diabetes in Africa, and this is projected to increase to 23.9 million by 2030. 9 In Kenya, it was estimated to be 1.06% in 2000 and would possibly rise to 1.32% by the year 2025. 10
Diabetes mellitus is classified into type I or insulin-dependent diabetes mellitus (IDDM) also referred to as juvenile onset diabetes and accounts for 5% to 10% of patients with diabetes globally. It occurs primarily as a result of cellular-mediated autoimmune destruction of β-cells of the pancreas or can be idiopathic. It is prone to ketoacidosis. 11 Diabetes is also classified as type II or non–insulin-dependent diabetes mellitus (NIDDM), which accounts for approximately 90% to 95% of the diabetes mellitus cases worldwide. 12 It is also called adults-onset diabetes because its onset is usually after 40 years of age. 13 It is mainly caused by insulin resistance and relative or absolute insulin deficiency. 12
Diabetes mellitus is characterized by recurrent or persistent hyperglycemia, and is diagnosed by demonstrating: fasting plasma glucose level ≥126 mg/dL (≥7.0 mmol/L); plasma glucose ≥200 mg/dL (≥11.1 mmol/L) 2 hours after a 75 g oral glucose load in a glucose tolerance test; random plasma glucose ≥200 mg/dL (11.1 mmol/L) 2 fasting glucose measurements ≥126 mg/dL (7.0 mmol/L) or random blood sugar level >200 mg/dL on 2 occasions is considered diagnostic for diabetes mellitus; patients with fasting sugars between 6.1 and 7.0 mmol/L (110 and 125 mg/dL, respectively) are considered to have imparied fasting glucose and finally patients with plasma glucose ≥140 mg/dL (7.8 mmol/L) 2 hours after a 75 g oral glucose load are considered to have impaired glucose tolerance. 8,14
In conventional medical practice, the present therapies of diabetes mellitus are reported to be unaffordable or unavailable and mostly having unwanted side effects especially in poor resource economies. 4 Herbal medicines are affordable, easily accessible and are firmly embedded within wider belief systems of many people in the underdeveloped and developing countries thus according them greater acceptance. 15 However, there is need for scientific evaluation of the efficacy, safety, and quality of medicinal plants products.
Kigelia africana (Lam) belongs to the family Bignoniaceae (Figure 1). It is widespread across Africa and it is found in wet savannah and near river bodies where it occurs in abundance. 16 It is used to treat skin ailments, including fungal infections, boils, psoriasis and eczema, leprosy, syphilis, and cancer. The roots, the wood, and leaves have been found to contain kigelinone, vernolic acid, kigelin, iridoids, luteolin, and 6-hydroxyluteolin. 16 The iridoids have antibacterial effect. Previous studies on Kigelia pinnata belonging to the same family Bignoniaceae have established hypoglycemic properties in animal models. 17 The rationale for utilization of K africana by many Kenyan communities in the management of diabetes mellitus largely rests on its long-term clinical application. However, its long-term of use has not been accompanied by scientific data to support such claims. The present study, therefore, sought to screen K africana for its hypoglycemic activity to provide scientific data that can guide proper use of this plant in management of diabetic mellitus.

Kigelia africana (photograph taken in July 2014, in Nthawa ward, Siakago Division, Mbeere North Subcounty, Embu County, Kenya).
Materials and Methods
Study Site
This study was undertaken at the Department of Biochemistry and Biotechnology, School of Pure and Applied Sciences, Kenyatta University.
Collection of the Plant Materials and Preparation of the Extracts
The plant used in this study was collected from its natural habitat in Nthawa ward, Siakago Division, Mbeere North Sub-County, Embu County, Kenya. A taxonomist authenticated its botanical identity and voucher specimen deposited at the National Museums of Kenya Herbarium, Nairobi, Kenya for future reference. The collected leaves of Senna singuena were air-dried until completely dry then ground into fine powder using an electric mill.
For aqueous extraction, 100 g of the powdered plant material were extracted in 1 L of distilled water for 6 hours at 60°C. The plant was then decanted and filtered using filter papers under vacuum pump. The filtrate was finally freeze-dried for 48 hours. The freeze-dried powder was weighed and stored in airtight container at −20°C ready for bioassay.
For organic extraction, 500 g of powdered K africana leaves were soaked in 1 L of ethyl acetate for 48 hours. The extract was decanted and filtered using muslin cloth. The semisolid mass was vacuum dried using a rotary evaporator at 77°C to obtain a solid residue. The extract was refrigerated at −20°C until used for analysis.
Experimental Animals
The study used male Swiss White Albino mice (3-4 weeks old) that weighed 23 to 27 g with a mean weight of 25 g. These were bred in the animal house at the Department of Biochemistry and Biotechnology of Kenyatta University. The mice were housed at a temperature of 25°C with 12 hours/12 hours darkness photoperiod and fed on rodent pellets and water ad libitum. The experimental protocols and procedures used in this study were approved by the Ethics Committee for the Care and Use of Laboratory Animals of Kenyatta University, Kenya.
Induction of Hyperglycemia
Hyperglycemia was induced experimentally by a single dose intraperitoneal administration of 186.9 mg/kg body weight of a freshly prepared 10% alloxan monohydrate. 2 Forty-eight hours later, mice with blood glucose levels above 200 mg/dL were considered diabetic and used in this study. Prior to initiation of this experiment, the animals were fasted for 8 to 12 hours but allowed free access to water until the end of this experiment.
Experimental Design
For either intraperitoneal or oral route of drug administration, the experimental mice were randomly divided into 7 groups of 5 animals each. Group I consisted of normal mice either intraperitoneally or orally administered with 0.1 mL physiological saline; group II consisted of alloxan-induced diabetic mice either intraperitoneally or orally administered with 0.1 mL physiological saline; group IIIa consisted of alloxan-induced diabetic mice intraperitoneally administered with 0.025 insulin units (0.25 insulin units in 1 mL) (1 IU/kg body weight) in 0.1 mL physiological saline; group IIIb consisted of alloxan-induced diabetic mice orally administered with 0.075 mg glibenclamide (0.75 mg in 1 mL) (3 mg/kg body weight) in 0.1 mL physiological saline; group IV consisted of alloxan-induced diabetic mice either intraperitoneally or orally administered with 1.25 mg extract (12.5 mg in 1 mL physiological saline) (50 mg/kg body weight) in 0.1 mL physiological saline; group V consisted of alloxan-induced diabetic mice either intraperitoneally or orally administered with 2.5 mg extract (25 mg extract in 1 mL physiological saline) (100 mg/kg body weight) in 0.1 mL physiological saline; group VI consisted of alloxan-induced diabetic mice either intraperitoneally or orally administered with 5 mg extract (50 mg extract in 1 mL physiological saline) (200 mg/kg body weight) in 0.1 mL physiological saline; group VII consisted of alloxan-induced diabetic mice either intraperitoneally or orally administered with 7.5 mg extract (75 mg extract in 1 mL physiological saline) (300 mg/kg body weight) in 1 mL physiological saline. A volume of 0.1 mL of either insulin or glibenclamide or the plant extract solution was administered either intraperitoneally or orally to each experimental mouse. The same experimental design was adapted for organic fraction too. The selected dosages were calculated as 2 log doses between 50 and 300 mg/kg body weight based on acceptable therapeutic doses for bioscreening.
Blood Sampling and Glucose Determination
Blood sampling was done by sterilizing the tail with 70% alcohol and then nipping the tail at the start of the experiment and repeated after 1, 2, 4, 6, 8 and 24 hours. Bleeding was enhanced by gently “milking” the tail from the body toward the tip. After the operation, the tips of the tail were sterilized by swabbing with 70% ethanol. The blood glucose levels were determined with a glucose analyzer model (Hypogaurd, Woodbridge, UK).
Phytochemical Analysis
The extract was analyzed for the following phytochemicals: total phenolics, saponins, tannins, flavonoids, alkaloids and phytonutrients; vitamins B1, B3, and C were assessed using standard procedures. 18
Determination of the Mineral Content
Atomic absorption spectrophotometry and total reflection X-ray fluorescence techniques were employed for mineral content analysis.
Total Reflection X-Ray Fluorescence System
In the TXRF technique, the X-rays excite atoms immediately at the surface of the sample, which in turn, emit radiation characteristic to them in all directions. A detector placed above the sample senses the fluorescence X-rays and not the background scatter to a very high sensitivity level.
Preparation of the sample
To 1 g of each plant sample was added 10 mL of double-distilled water to a vial in triplicate. As an internal standard, 20 μL of 1000 ppm gallium stock solution was added to each sample resulting to a concentration of 2 ppm Ga. The mixture was vortexed for 1 minute and aliquots of 10 μL of each sample drawn and pipetted into quartz carriers in triplicate. The samples were placed in the oven to evaporate the liquid.
Sample spectrum acquisition and quantitative analysis was carried out by use of Picofox TXRF spectrometer. Each sample was irradiated for 1000 seconds. The spectrometer was preheated at 50 kV and a current of 1000 μA. S2 PICOFOX software was used to evaluate the measured spectra based on the selected elements. The following formula was used to calculate the elemental concentration:

where, Cx is the concentration of the analyte, Cis is the concentration of the internal standard, Nx is the net intensity of the analyte, Nis is the net intensity of the internal standard, Sx is the relative sensitivity of analyte, and Sis is the relative sensitivity of internal standard.
Raw data tabulated on excel worksheet was processed in order to arrive at the average and standard deviation for each sample. Final values were expressed as μg/g ppm.
Atomic Absorption Spectrophotometry
The quantities of magnesium, chromium, and vanadium in the plant samples were determined using atomic absorption spectrophotometry. This method determines the quantity of the chemical elements by the absorption of optical radiation generated by the free atoms in the gaseous state. Standards with known analyte content are required to establish the correlation between the absorbance of the sample and the concentration of the analyte. This technique is based on the Beer-Lambert law.
In the preparation of the wet digests for analysis, 1 g of the dry samples from each plant were put into 100-mL Pyrex beakers to which was added 10 mL of concentrated nitric acid. The mixture was allowed to stand in order to soak. Subsequently, 3 mL of perchloric acid (60% HClO4) was added to each beaker and the mixture slowly warmed on a hot plate until frothing ceased. This was followed by intense heating in order to evaporate all the nitric acid. After charring and cooling, 10 mL of concentrated nitric acid was further added, and heating resumed until white fumes due to HClO4 were observed. Filtration of the solution into 100-mL volumetric flasks was carried out using Whatman filter paper No. 1. After vigorous shaking, the solution was transferred into plastic bottles and the samples kept in the freezer awaiting analysis.
Standard solutions for each element were prepared varied range (1, 5, 10, 15, 20, and 25 ppm) in order to give a linear relationship between concentration and absorbance. Aliquots of standard stock solution were drawn and put into a series of flasks and diluted using distilled water to give the desired final concentration. For magnesium, 2 mL of 5% lanthum solution was added before dilution. Blank was prepared by adding all the reagents except the sample.
After setting up the atomic absorption spectrophotometry instrument, the respective standards and samples were aspirated into the flame in order to determine the absorbance. Absorbance at zero concentration was reestablished by flashing distilled water into the flame. A calibration curve was plotted of the absorbance against the concentration of the standard solution. The above procedure for each sample was repeated in duplicate. The mean absorbance was determined and recorded. Final values were expressed as μg/g dry matter.
Data Management and Statistical Analysis
The data were entered in the Microsoft Excel Spread Sheet, cleaned and then exported to Statistical Package of Social Sciences (SPSS) software for analysis. Results were expressed as mean ± standard deviation (SD). Statistical analyses were done using analysis of variance and post–analysis of variance to compare the means of untreated normal control mice with diabetic mice treated with saline, diabetic mice treated with the conventional drug, and diabetic mice treated with plant extract at doses of 50, 100, 200, and 300 mg/kg body weight. P ≤ .05 was considered statistically significant.
Results
Effect of Intraperitoneal and Oral Administration of Ethyl Acetate Leaf? Extract of Kigelia africana in Alloxan-Induced Diabetic Mice
Oral administration of Kigelia africana lowered the blood glucose in all the doses as shown in Figure 2 and Table 1 when compared to the diabetic control group. However, in the diabetic group, there was a gradual increase of the blood glucose levels from 0 hour to the 24th hour (P < .05). It was only at the 6th, 8th, and 24th hour that there was a significant elevation of the blood glucose level when compared with the 0th hour (P < .05). There was significant variation for all the normal group from the 2nd hour to the 24th hour from the 0 hour. Only the 0th hour, 6th, and 8th hour were different from the 2nd hour (P < .05). Significant lowering of the blood glucose levels was also expressed in mice following the administration of 50, 100, 200, and 300 mg/kg body weight of K africana. After administration of 50 mg/kg, it was only at the 8th hour that significant lowering of the blood glucose was shown compared with the 0th hour (P < .05). The rest were basically similar. Interestingly, a dose of 100 mg/kg body weight of K africana did not produce any significant variation in the blood glucose levels (P > .05). A dose of 200 and 300 mg/kg body weight of K africana only induced changes after 6, 8, and 24 hours, respectively, when compared with the normal control (P < .05). The 8th hour for a dose of 200 mg/kg and the 24th hour for a dose of 300 mg/kg body weight of K africana were different from 2nd hour respectively (Table 1).

The mean percentage change in blood glucose levels after ethyl acetate leaf extract of Kigelia africana was administered orally in alloxan-induced diabetic mice.
Effect of Intraperitoneal Administration of Organic Leaves Extracts of Kigelia africana in Alloxan-Induced Diabetic Mice.*

*Values are expressed as means ± standard error of the mean for 5 animals per group. Means within respective columns followed by similar lowercase letters are not significantly different at P ≤ .05; means within respective rows followed by similar uppercase letters are not significantly different at P ≤ .05 following analysis of variance and Tukey’s post hoc test for multiple comparison.
On the other hand, the organic extract administered intraperitoneally produced almost similar variations in the diabetic groups, a dose of 50 and 200 mg/kg body weight, a dose of 100 mg/kg was similar to the effect generated at 300 mg/kg body weights of K africana. In the insulin-treated group, the blood glucose levels were significantly elevated at all the different hours compared with the 0th hour (P < .05) (Table 2 and Figure 3). Only the 6th and 8th hour was different from the 2nd hour while the 24th hour was different from 6th and 8th hour, respectively. After the administration of 50 mg/kg dose, K africana induced significant lowering of the blood glucose levels at the 4th, 6th, 8th, and 24th hour compared with 0th hour and 6th and 8th hour compared with the 2nd hour (P < .05) (Table 2). At 100 mg/kg body weight, K africana induced significantly lower levels of blood glucose levels in mice following the alloxan-induced toxicity in mice from the 2nd hour to the 24th hour when compared with the 0th hour and 8th hour when compared with the 2nd hour (P < .05). Administration of 200 mg/kg body weight of K africana induced a significant lowering of the blood glucose levels at the 4th hour to the 24th hour when compared with the 0th hour (P < .05). Similarly, in the 6th and 8th hour, the blood glucose levels were significantly lowered when compared with the 2nd hour (P < .05) and 24th hour was significantly elevated compared with the 8th hour. Finally, a dose of 300 mg/kg body weight K africana caused significant variations in the blood glucose levels at all the hours studied: The blood glucose was lowered significantly for the 2nd to 24th hour when compared with the 0th hour (P < .05). Glucose levels at the 6th and 8th hour were significantly lower compared with the 2nd hour at the same dose (P < .05) (Table 2).

The mean percentage change in blood glucose levels after ethyl acetate leaf extracts of Kigelia africana was administered intraperitoneally in alloxan-induced diabetic mice.
Effect of Oral Administration of Organic Leaves Extracts of Kigelia africana in Alloxan-Induced Diabetic Mice.*

*Values are expressed as means ± standard error of the mean for 5 animals per group. Means within respective columns followed by similar lowercase letters are not significantly different at P ≤ .05; means within respective rows followed by similar uppercase letters are not significantly different at P ≤ .05 following analysis of variance and Tukey’s post hoc test for multiple comparison.
Effect of Intraperitoneally and Oral Administration of Aqueous Extracts of Kigelia africana on Alloxan-Induced Diabetic Mice
Administration of K africana aqueous extract caused a similar trend as the organic extract by lowering the blood glucose levels as the dose of the extract increased at all the hours from 0th to the 24th hour. The blood glucose levels were significantly elevated in the diabetic control group for all the hours compared with the normal and all the other groups of the study. Similarly, there was a slight elevation of the blood glucose levels at the 24th hour compared with the 8th hour (Figure 4). There was no significant change in the normal blood glucose levels in mice (Table 3). However, in the diabetic group following administration of alloxan in mice, it is only at the 24th hours that the blood glucose was significantly elevated when compared with both the 0th hour and 2nd hour (P < .05). In the reference group, glucose levels in all the groups were significantly lower when compared with the normal control (P < .05). Administration of 50 mg/kg body weight of K africana significantly lowered the blood glucose levels at the 4th, 6th, 8th, and 24th hour when compared with the 0th hour and 8th hour when compared with the 2nd hour (P < .05). The same effect was observed with administration of 100 mg/kg bodyweight with an additional significant variation of the 6th hour with the 2nd hour. However, at 200 mg/kg, the effects observed with 50 mg/kg were also observed with this group of mice. At a dose of 300 mg/kg, all the groups were significantly different from the 0th hour in addition to both the 6th and 8th hour being significantly lower from the 2nd hour of the treatment in alloxan-induced diabetic mice.

The mean percentage change in blood glucose levels after aqueous leaf extracts of Kigelia africana was administered intraperitoneally in alloxan-induced diabetic mice.
Effects of Intraperitoneal Administration of Aqueous Leaves Extracts of Kigelia africana in Alloxan-Induced Diabetic Mice.*
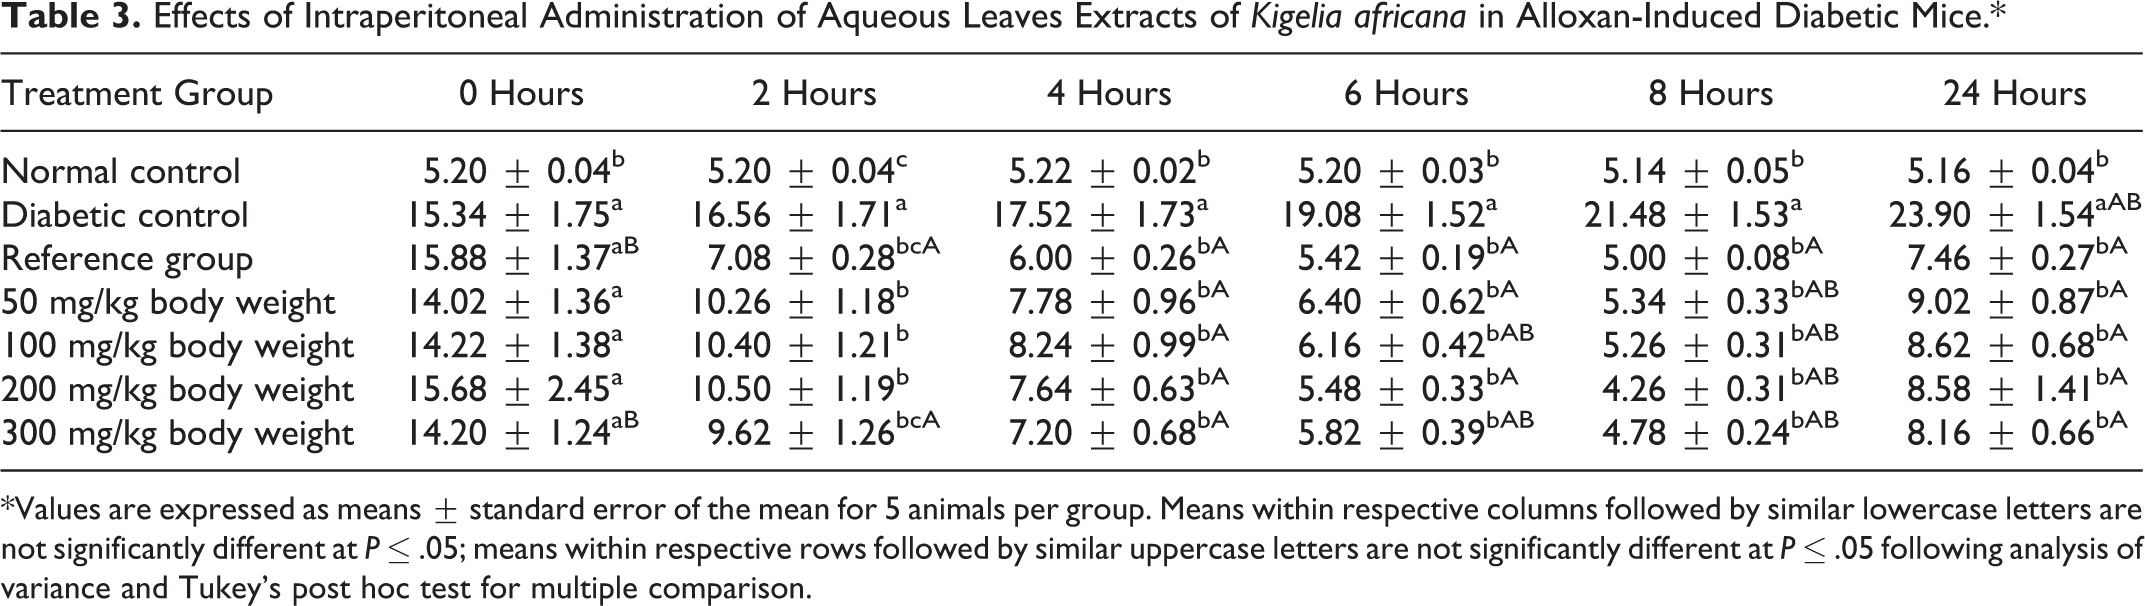
*Values are expressed as means ± standard error of the mean for 5 animals per group. Means within respective columns followed by similar lowercase letters are not significantly different at P ≤ .05; means within respective rows followed by similar uppercase letters are not significantly different at P ≤ .05 following analysis of variance and Tukey’s post hoc test for multiple comparison.
Administration of the aqueous extract of Kigelia africana orally reduced the levels of the blood glucose levels as the dose of the aqueous extract increased and as the time in hours increased from the 2nd to the 8th hour. However, the blood glucose levels were elevated at the 24th hour when compared with the 8th hour. At the different times, the blood glucose levels of the diabetic group following administration of alloxan induced diabetes in mice was significantly elevated when compared with the normal and other groups at the different hours (P < .05) (Figure 5 and Table 4). Among the different groups of the study, the diabetic group following the administration of alloxan had their blood levels elevated significantly (P < .05). However, it is only at the 24th hour that there was significant elevation of the blood glucose levels when compared with the 0th hour (P < .05). However, administration of glibenclamide in the reference group significantly lowered the blood glucose levels from the 2nd to the 24th hour (P < .05). Other comparisons also showed that the 4th hour to the 24th hour was significantly different from the 2nd hour (P < .05). Administration of 50 mg/kg K africana lowered the blood glucose levels at all the hours significantly when compared with the 0th hour (P < .05). At a dose of 100 mg/kg, K africana also induced a significant lowering of the blood glucose levels at all the hours when compared with the 0th hour except for the 6th and 8th hour, which were significantly different from 2nd hour of this group (P < .05). Interestingly, the effects of both 200 and 300 mg/kg body weight of K africana caused a similar effect at each dose levels; all the groups were significantly different from the 0th hour while the 4th to the 8th hour were also significantly different from the 2nd hour of the study following the administration of K africana at both doses (P < .05).

The mean percentage change in blood glucose levels after aqueous leaf extract of Kigelia africana was administered orally in alloxan-induced diabetic mice.
Effects of Oral Administration of Aqueous Leaves Extracts of Kigelia africana in Alloxan-Induced Diabetic Mice.*
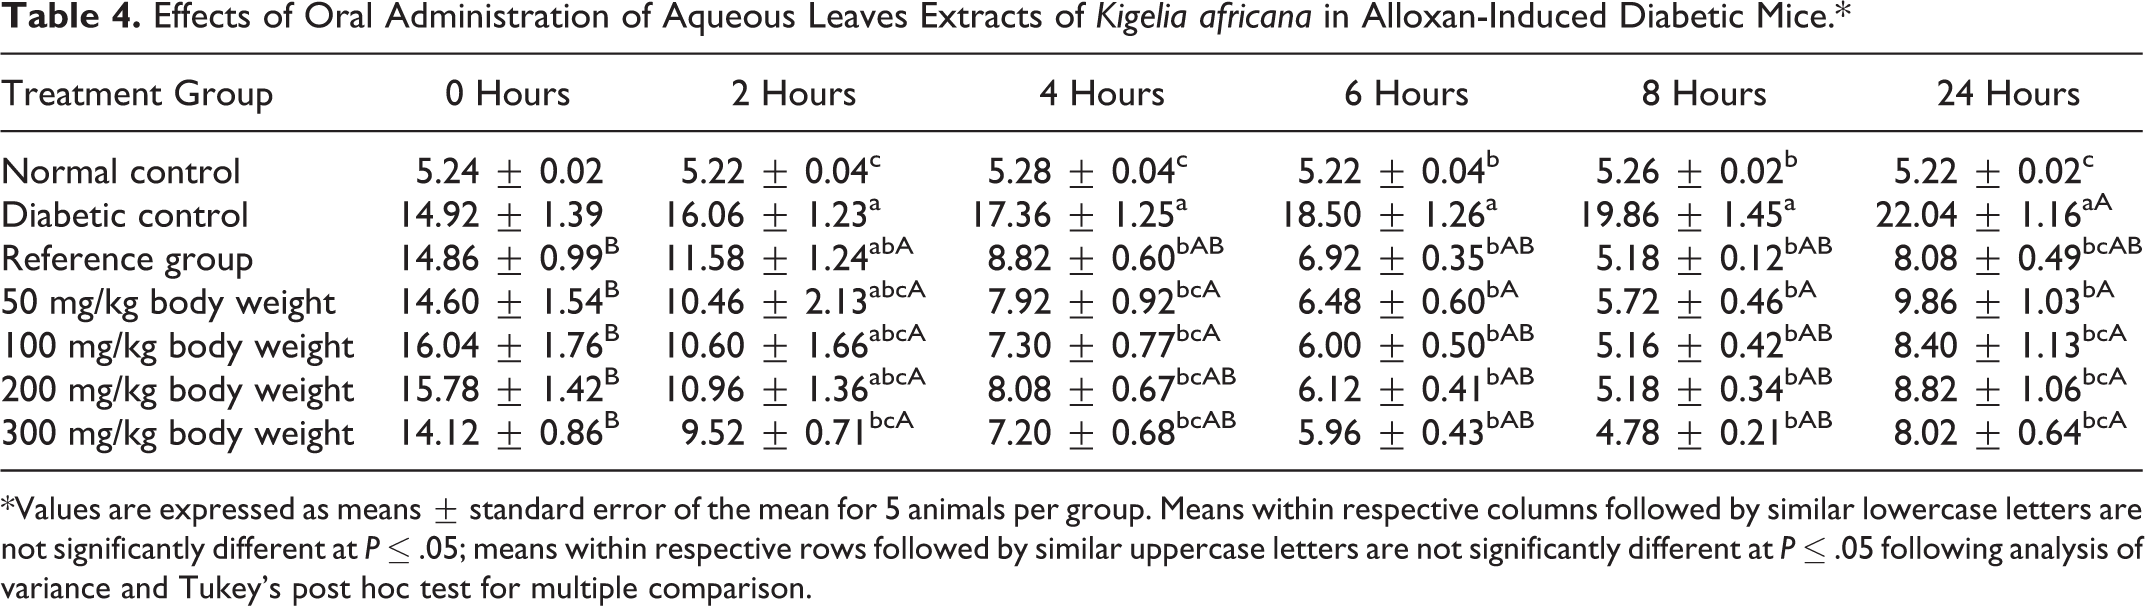
*Values are expressed as means ± standard error of the mean for 5 animals per group. Means within respective columns followed by similar lowercase letters are not significantly different at P ≤ .05; means within respective rows followed by similar uppercase letters are not significantly different at P ≤ .05 following analysis of variance and Tukey’s post hoc test for multiple comparison.
Phytochemicals Composition in Kigelia africana
The phytochemicals detected in the leaf powder of K africana were total phenolics, saponins, tannins, flavonoids, and alkaloids. The leaves extract was found to contain the following macronutrients in significant amounts; vitamin B1, vitamin B3, and vitamin C (Table 5).
Quantitative Phytochemical Analysis of the Kigelia africana Leaf Powder.

Elemental Analysis
Various mineral elements were detected in the plant extract at different levels (Table 6). It is shown that calcium, potassium, iron, manganese, and titanium were determined to be in high concentrations when compared with other mineral elements with concentrations of 40 ppm and higher. However, calcium had the highest concentrations of more than 10 000 ppm when compared with other mineral elements. This was followed closely by potassium with concentrations between 4000 and 9000 ppm, followed by titanium, strontium, vanadium, zinc, and manganese, which had levels of approximately between 40 and 100 ppm.
Quantitative Mineral Analysis for the Kigelia africana Plant Extract in µg/g (ppm).

Other elements whose levels were less than 40 ppm included chromium, nickel, copper, arsenic, bromine, rubidium, strontium, yttrium, and lead. Among these elements; radioactive elements were also present, for example, strontium. Toxic elements such as lead, arsenic, and nickel were also detected; however, they are in very low concentrations of <40 ppm.
Discussion
The alloxan-induced diabetic rats had a 3- to 4-fold increase in blood glucose relative to the normal control rats. The aqueous and ethyl acetate leaf extracts of K africana showed blood glucose lowering effect when administered intraperitoneally and orally an indication that they contained hypoglycemic constituents. Similar results were observed by Kumar et al 17 after an oral administration of K pinnata in streptozotocin-induced diabetic rats at doses of 250 and 500 mg/kg body weight for 21 days. Arika et al 4 also observed that aqueous leaf extracts of Lippia javanica showed hypoglycemic activity in alloxan-induced diabetic mice. The lowering effect of blood sugar levels by extract in a dose-independent manner may reflect uptake of the active constituents through saturable active transport. 4 The recovery phase observed in the 24th hour in both fractions and routes help identify frequency of dosing of the antidiabetic drugs. The return to diabetic states in this hour may be due to the reduction of antidiabetic activity of the extracts as a result of fast hepatic metabolism and renal clearance or the extracts having a short half-life. 19
The possible mechanisms underlying the hypoglycemic activity exhibited by K africana among others include inhibition of intestinal absorption of glucose, facilitation of glucose-induced insulin release, enhancement of peripheral glucose uptake, promotion of the regeneration of β-cell of islets of Langerhans and amelioration of oxidative stress 1 attributed to the presence of a variety of phytoconstituents present in this plant.
The blood glucose lowering effect of the plant extracts may be attributed to the presence of total phenols, flavonoids, alkaloids, tannins, terpenoids, and saponins that have been known to confer hypoglycemic activity. 20 1-Ephedrine is the major alkaloid component that is known to suppress hyperglycemia through facilitation of regeneration of pancreatic islet cells restoring the secretion of insulin. 20 Flavanoids such as quercetin and myricetin have insulino-mimetic properties and stimulate lipogenesis and glucose transport in the adipocytes. Tannins have been shown to have hypoglycemic activity. 21 Graded doses of saponins extract (10, 15, and 20 mg/kg) caused a marked hypoglycemic effect in alloxan-induced diabetic rabbits. 22
The hypoglycemic effect of the plant extracts could also be attributed to the presence of trace elements such as iron, manganese, magnesium, vanadium, chromium, copper, potassium, calcium, and zinc. Iron influences glucose metabolism and reciprocally, iron influences insulin action. 23 Magnesium increases insulin secretion and/or improves insulin sensitivity and peripheral glucose uptake. 24 Manganese helps the body catabolize lipids, carbohydrates, and proteins and assist in energy production. 25 Vanadium facilitates glucose uptake and metabolism and enhances insulin sensitivity in animal models. 23 Zinc plays a key role in the regulation of insulin production by pancreatic tissues and glucose utilization by muscles and fat cells. 26 Calcium and cyclic adenosine monophosphate are important in the stimulation of insulin release. 27 Potassium supplementation yields improved insulin sensitivity, responsiveness and secretion. 27 Chromium functions as a cofactor in insulin-regulating activities. 23 Copper possesses an insulin-like activity and promotes lipogenesis. 27
Conclusion
In conclusion, the findings of this study indicate that aqueous and ethyl acetate leaf extracts of K africana had antidiabetic activity when therapeutic doses were administered both intraperitoneally and orally in both fractions. However, the extract lowered blood sugar levels in a dose-independent manner in both routes. The observed hypoglycemic activity could be associated with the phytochemicals and phytonutrients and trace elements present in K africana. The study recommends continued use of K africana in the management of diabetes mellitus and supports its folkloric claims. Also, the study finding opens an avenue for the conservation efforts to ensure that its continued use is sustainable. Moreover, further studies to determine genes that act as molecular signatures are essential in understanding the biology of this disease in order to design appropriate therapeutic drugs for the management of diabetes mellitus.
Limitations of the Study
The main limitation of this study was lack of specific grant from any funding agency whatsoever. This therefore, limited the scope of the present study.
Footnotes
Acknowledgments
The authors wish to acknowledge the Department of Biochemistry and Biotechnology, Kenyatta University for allowing us to use the departmental animal house facility for mice breeding and performing the efficacy studies; Mr James Adino of the Department of Medical Laboratory Sciences, Kenyatta University for the technical support; Mr Wycliffe Wenwa and Mr Gitonga from the Department of Biochemistry and Biotechnology, Kenyatta University for their endowed support in plant extract preparation and mice breeding.
Author Contributions
SMN initiated the writing of this review and designed the structure of this review, interpreted results, and drafted the manuscript. WMA and AKM compiled information and made contribution to the revision of the manuscript. ENMN designed the structure of this review, interpreted results, and revised the language. JJNN gave some valuable advice about the structure and language of the manuscript.
Declaration of Conflicting Interests
The authors declared no potential conflicts of interest with respect to the research, authorship, and/or publication of this article.
Funding
The authors received no financial support for the research, authorship, and/or publication of this article.
Ethical Approval
The experimental protocols and procedures used in this study were approved by the Ethics Committee for the Care and Use of Laboratory Animals of Kenyatta University, Kenya.