
Abstract
There is very little scientific information on indigenous plants used for medicinal purposes. Therefore, the aim of the study was to evaluate the antibacterial and antioxidant activities of the leaves of Commelina africana, Elephantorrhiza elephantina, Dombeya rotundifolia, and the whole plant excluding the roots of Schkuhria pinnata indigenous medicinal plants from the Limpopo Province, which may be used for the treatment in humans infected with bacterial pathogens. The screening of different phytoconstituents using standard methods revealed the presence of terpenoids, flavonoids, tannins, and saponins. The total phenolic, tannin, and flavonoid content were estimated using spectrophotometric methods. D rotundifolia had the highest amounts of phenol (259.00 ± 2.65 mg of gallic acid equivalent [GAE]/g), tannin (330.33 ± 15.63 mg of GAE/g), and flavonoid (19.90 ± 0.75 mg of quercetin equivalent [QE]/g) content, while S pinnata had the least. All the plants had antibacterial activity against Escherichia coli and Pseudomonas aeruginosa with the bioautography method. The microbroth dilution assay revealed antibacterial activity with minimum inhibitory concentration values raining from 0.02 to 2.50 mg/mL. D rotundifolia had the highest antioxidant activity in both the free radical scavenging and ferric reducing power methods. S pinnata and C africana extracts had high antibacterial activity, while D rotundifolia had high antioxidant activity, which made them potential plants for isolation of bioactive compounds and possible application in the pharmaceutical industry.
Biochemical reactions are natural processes that take place in cells and organelles in our bodies in order to sustain life. However, these reactions contribute to formation of free radical molecules. 1 Accumulation of these free radicals in the body leads to oxidative stress and this causes human diseases such as cancer, diabetes, cardiovascular diseases, and inflammatory conditions. 2 On the other hand, the prevalence of infectious diseases poses a major problem, since pathogens have acquired resistance to the available antibiotics. 3 Therefore there is a great need to develop new drugs with a different mechanism of action and novel structures.
Plants have been the basis of treatment of many diseases for centuries and they represent rich sources of therapeutics. 4,5 Their usage stems from the presence of secondary metabolites that have been proven to be effective for prevention and cure of diseases in humans and animals. 6 These metabolites have therapeutic properties, such as antioxidant, antimicrobial, anticancer, antidiabetic, immune modulatory, and renoprotection effects. 7,8
Four plants (Commelina africana, Dombeya rotundifolia, Elephantorrhiza elephantina, and Schkuhria pinnata) were selected in this study based on indigenous knowledge and their use in traditional medicine. C africana is a perennial spreading herb from the Commelinaceae family, with small canary yellow flowers and flat or folded hairy leaves, which is widely distributed in forests and grassland in Africa, Madagascar, and the Arabian Peninsula. A decoction of the root is used by the Ndebele people for treatment of venereal diseases. 9 D rotundifolia, on the other hand, is a small single stemmed tree from the Sterculiaceae family, with green large rounded leaves, largely distributed in most South African provinces. 10 McGaw et al 11 reported on the antibacterial activity of the ethanolic leaf extracts of D rotundifolia.
E elephantina is a low shrub from the Leguminosae family, with unbranded stems, dark reddish-brown bark, and dull green leaves. This plant grows from an enormous underground rhizome and is widely distributed in South Africa. 10 The traditional uses include treatment of various diseases in cows, including pneumonia, coughing, and tick-borne diseases. 12 S. pinnata (Asteraceae) can mostly be found on roadsides and ground like fields in Zimbabwe and South Africa. 13 The documented biological activities include control of mastitis pathogens 13 and for treatment of various disorders linked to infectious microorganisms in animals. 14
There is very little scientific information on indigenous plants used for medicinal purposes. As such the validation of these plants to augment their traditional use is required to create public awareness. 15
Materials and Methods
Plant Collection and Storage
The leaves of Commelina africana L var africana (UNIN 12295), Dombeya rotundifolia (Hochst) Planch var rotundifolia (UNIN 12296), Elephantorrhiza elephantina (Burch) Skeels (UNIN 12297), and the whole plant excluding the roots of Schkuhria pinnata (Lam) Kuntze ex Thell) (UNIN 12298) (Table 1) were collected in April 2015 at the University of Limpopo, South Africa. Voucher specimen and tree labels were used to verify the identity of the plants. The voucher specimens were deposited to Larry Leach Herbarium (UNIN) for confirmation. Plant collection was based on ethnopharmacological information provided by traditional healers in Limpopo Province. The plants were air dried and later ground to fine powder using a blender (Waring Laboratory Blender LB20ES). Ground plant materials were stored in air-tight containers in the dark until extraction to prevent oxidation.
Selected Medicinal Plants That Are Used by Bapedi Traditional Healers to Treat Various Ailments.

Extraction Procedure
Ground plant materials (1 g) each was extracted using 10 mL each of n-hexane, dichloromethane, acetone, and methanol. The plant solvent mixtures were vigorously shaken for 10 minutes in series 25 shaking incubator machine (New Brunswick Scientific Co, Inc) at a high speed (100 rpm). The extracts were filtered into preweighed labeled containers. The process was repeated 3 times to exhaustively extract the constituents and extracts were combined. The solvents were removed under a stream of cold air at room temperature.
Thin Layer Chromatography (TLC) Fingerprint Profiling of Plant Extracts
The plant extracts were redissolved in acetone to a final concentration of 10 mg/mL. For each plant and extracts 10 μL (100 μg) was loaded on aluminum-backed TLC) plate (Sigma), and developed in saturated chambers with 3 solvent systems of different polarity, namely, BEA (benzene/ethanol/ammonium hydroxide, 18:2:0.2, nonpolar/basic); CEF (chloroform/ethyl acetate/formic acid, 10:8:2, intermediate polarity/acidic); EMW (ethyl acetate/ methanol/water, 10:1.35:1, polar/neutral). 24 Developed plates were observed under ultraviolet (UV) light at 254 and 365 nm for the presence of fluorescing compounds and thereafter sprayed with vanillin sulfuric acid reagent (0.1 g vanillin [Sigma]:28 methanol:1 mL sulfuric acid). Plates were heated at 110°C for optimal color development.
Qualitative Phytochemical Analysis Tests
Tests for the presence of the following phytochemical were performed on the extracts: terpenoids, 25 flavonoids, 25 cardiac glycosides, 25 phlobatannins, 25 alkaloids, 26 steroids, 25 saponins, 27 and tannins. 28
Quantitative Phytochemical Analysis
Total Phenolic Content Determination
The concentration of phenolic content in 70% aqueous acetone extracts of the selected plants was determined using spectrophotometric method described by Singleton et al
29
with modifications. The determination of the total phenol content employed the Folin-Ciocalteau method, where 0.1 mL of extract and 0.9 mL of distilled water were mixed in a 25-mL volumetric flask. To this mixture, 0.1 mL of Folin-Ciocalteau phenol reagent was added and the mixture shaken well. One milliliter of 7% sodium carbonate (Na2CO3) solution was added to the mixture after 5 minutes. The volume was made up to 2.5 mL with distilled water. A set of standard solutions of gallic acid (0.0625, 0.125, 0.25, 0.5, and 1 mg/mL) were prepared as described above. The mixtures were incubated for 90 minutes at room temperature and the absorbance for test and standard solutions were determined against the reagent blank at 550 nm with a UV/visible spectrophotometer. Total phenol content was expressed as mg of gallic acid equivalent (GAE)/g of extract calculated from the equation,
Total Tannin Content Determination
The tannin content was determined using Folin-Ciocalteau method. About 0.1 mL of the 70% aqueous acetone extracts of the selected plants was added to a 25-mL volumetric flask with 5 mL of distilled water. To this mixture, 0.2 mL of 2 M Folin-Ciocalteau phenol reagent and 1 mL of 35% Na2CO3 solution was added and this was made up to 10 mL with distilled water. The mixture was shaken well and kept at room temperature for 30 minutes. A set of standard solutions of gallic acid (0.0625, 0.125, 0.25, 0.5, and 1 mg/mL) were prepared in the same manner as described above. Absorbance for test samples and standard solutions were measured against the blank at 725 nm with a UV/visible spectrophotometer. The tannin content was expressed as mg of GAE/g of extract calculated from the equation,
Total Flavonoid Content Determination
Total flavonoid content was determined by the aluminium chloride colorimetric assay. One millilitre of 70% aqueous acetone extracts of the selected plants was mixed with 4 mL of distilled water in a 25 mL volumetric flask. To the flask, 0.30 mL of 5% sodium nitrite was added. About 0.3 mL of 10% aluminium chloride was added to the mixture after 5 minutes, this was mixed. After 5 minutes, 2 mL of 1 M Sodium hydroxide was added and this was made up to 10 mL with distilled water. A set of reference standard solutions of quercetin (0.0625, 0.125, 0.25, 0.5 and 1 mg/mL) were prepared in the same manner as described above. The absorbance for test and standard solutions were determined against the reagent blank at 510 nm with a UV/visible spectrophotometer. The total flavonoid content was expressed as mg of quercetin equivalent (QE)/g of extract calculated from the equation,
Antioxidant Activity Assay
Qualitative 2,2-Diphenyl-1-picryl-hydrazyl (DPPH) Assay on TLC
The plant extracts were separated using TLC as described in TLC for phytochemical analysis. The chromatograms were air dried and sprayed with 0.2% (w/v) 2,2-diphenyl-1-picryl-hydrazyl (DPPH) (Sigma) to detect the presence of antioxidant compounds on TLC plates. The presence of antioxidant activity is indicated by yellow spots against a purple background on TLC plates sprayed with 0.2% DPPH in methanol. 30
Quantitative Antioxidant Activity Assay
Quantitative 2, 2-diphenyl-1-picrylhydrazyl (DPPH) radical scavenging activity assay
The free radical scavenging activity of the 70% aqueous acetone extracts of the selected plants was measured using the method described by Brand-Williams et al 31 with modifications. The stock solution of 0.2% DPPH in methanol was prepared and this was kept in a refrigerator until use. A working solution was made by diluting the stock solution with methanol to make an absorbance of 0.98 (±0.02) at 517 nm. One milliliter of the DPPH working solution was mixed with 1 mL of the plant extract (1 mg/mL), or the standard solution in a test tube. The absorbance was measured at 517 nm. The percentage of radical scavenging activity was calculated using the formula below where, Ac and As are the absorbance of control and sample, respectively. The control contained 1 mL of methanol in place of the plant sample. 52

Reducing power method
The antioxidant capacity was evaluated using the reducing power assay described by Oyaizu 32 with modifications. A set of concentrations ranging from 0.0625 mg/mL to 1 mg/mL of the 70% aqueous acetone extracts of the selected plants was made. Two milliliters of each of the prepared concentration was added into a test tube, to this 2 mL of sodium phosphate buffer (1 M, pH 6.6) and 2 mL of potassium ferricyanide (1% w/v in distilled water) were added and mixed well. This mixture was incubated in a water bath at 50°C for 20 minutes. Following incubation, 2.5 mL of trichloroacetic acid (10% w/v in distilled water) was added and the mixture was centrifuged at 650 rpm for 10 minutes. About 3 mL of the supernatant was and added into a test tube. To this, 10 mL of distilled water and 1 mL of ferric chloride (0.1% w/v in distilled water) solution was added and mixed well. The absorbances of the solutions were measured at 700 nm against a blank prepared as described above but replacing the plant extract with an equal volume of a solvent. 33
Antibacterial Activity Assay
Microorganisms Used in This Study
Two Gram-positive bacteria (Staphylococcus aureus ATCC 29213 and Enterococcus faecalis ATCC 29212) and 2 Gram-negative bacteria (Escherichia coli ATCC 28922 and Pseudomonas aeruginosa ATCC 27853), which are a major cause of nosocomial infections in hospitals 34 and are the strains primarily recommended for use by the Clinical and Laboratory Standards Institute (CLSI), 35 were selected for the study. The bacterial cultures were maintained on nutrient agar at 4°C and inoculated in nutrient broth and incubated at 37°C for 12 hours prior to screening tests.
Qualitative Antibacterial Activity Assay by Bioautography
The bioautography procedure was done according to Begue and Kline. 36 The plates were prepared as in the section “Thin Layer Chromatography (TLC) Fingerprint Profiling of Plant Extracts” but without spraying with vanillin/H2SO4 and allowing the solvents to evaporate for 5 days prior to spraying with test bacteria. Following spraying with test bacteria, the plates were placed in humidity and incubated at 37°C for 24 hours. Following incubation, the plates were sprayed with 2 mg/mL ρ-iodonitrotetrazolium violet (Sigma) dissolved in distilled water and further incubated for 2 to 3 hours. The bioautograms were observed for bacterial growth, and the clear zones against the red-pink background indicated growth inhibition by the compounds with antibacterial activity on TLC plates.
Quantitative Antibacterial Activity Assay by Microbroth Dilution Method
Antibacterial activity was evaluated by the determination of the minimum inhibitory concentration (MIC) of each extract on E faecalis, E coli, P aeruginosa, and S aureus using the microdilution method developed by Eloff. 37 The extracts were redissolved in acetone to a final concentration of 10 mg/mL. Twofold serial dilutions of the extracts (2.5 mg/mL to 0.02 mg/mL) were prepared in 96-well microtiter plates. The effects of the extracts were tested against each pathogen at a density of following exposure, and microtiter plates were incubated at 37°C overnight. Densities of bacterial cultures for use in the screening procedures were as follows: S aureus, 2.6 × 10¹² colony-forming units (CFU)/mL; E faecalis, 1.5 × 10¹⁰ CFU/mL; P aeruginosa, 5.2 × 10¹³ CFU/mL; E coli, 3.0 × 10¹¹ CFU/mL. Thereafter, 40 µL of 0.2 mg/mL iodonitrotetrazolium chloride (Sigma-Aldrich) was added to each well and the plates were reincubated for a further 30 minute at 37°C for S aureus and P aeruginosa, 1.5 hours for E coli, and 24 hours for E faecalis. The formation of a red-pink color signified microbial growth. All samples were assayed in triplicates.
Results and Discussion
Dried plant materials were used in this study to avoid problems associated with fresh plant material such as bacterial and fungal contamination since most plants live in a mutualistic relationship with microorganisms. 38 The success of extracting compounds from plants is determined by the type of extraction solvent used. 38 As such solvents of varying polarities were used for the extraction process (n-hexane, dichloromethane, acetone, and methanol). Water is usually used in preparations of traditional medicine because of its availability and nontoxic effect. However, the use of water poses a challenge when it comes to extraction of nonpolar bioactive compounds. 38
The total mass of plant materials extracted using different solvents is shown in Figure 1. n-Hexane was a poor extracting solvent, since the yield was low in all the plants except for E elephantina (121 mg), with 50 mg for D rotundifolia, S pinnata (32 mg), and C africana (4 mg). Methanol appears to be the best extracting solvent in all the plants since a greater quantity of extracted plant material was obtained with methanol as compared with the other solvents. These observations are in agreement with those reported by Masoko and Nxumalo. 39 The high extraction yield observed with methanol was probably because of methanol’s ability to efficiently penetrate the cell membrane of the plants. 40

The mass extracted from 1 g of dried plant materials using 10 mL of different solvents (n-hexane, dichloromethane, acetone, and methanol).
TLC aided in the analysis of the phytochemical profiles of the extracts. More fluorescent compounds with different colors were observed in BEA than in CEF (Figure 2b). This suggests that most of the compounds in the selected plants are nonpolar in nature. Some compounds were not fluorescent therefore vanillin–sulfuric acid reagent was used for their detection. The observed difference in colors represent different phytochemical compounds, with more bands observed in acetone extracts of C africana and dichloromethane extracts of E elephantina in BEA than in CEF (Figure 2a).
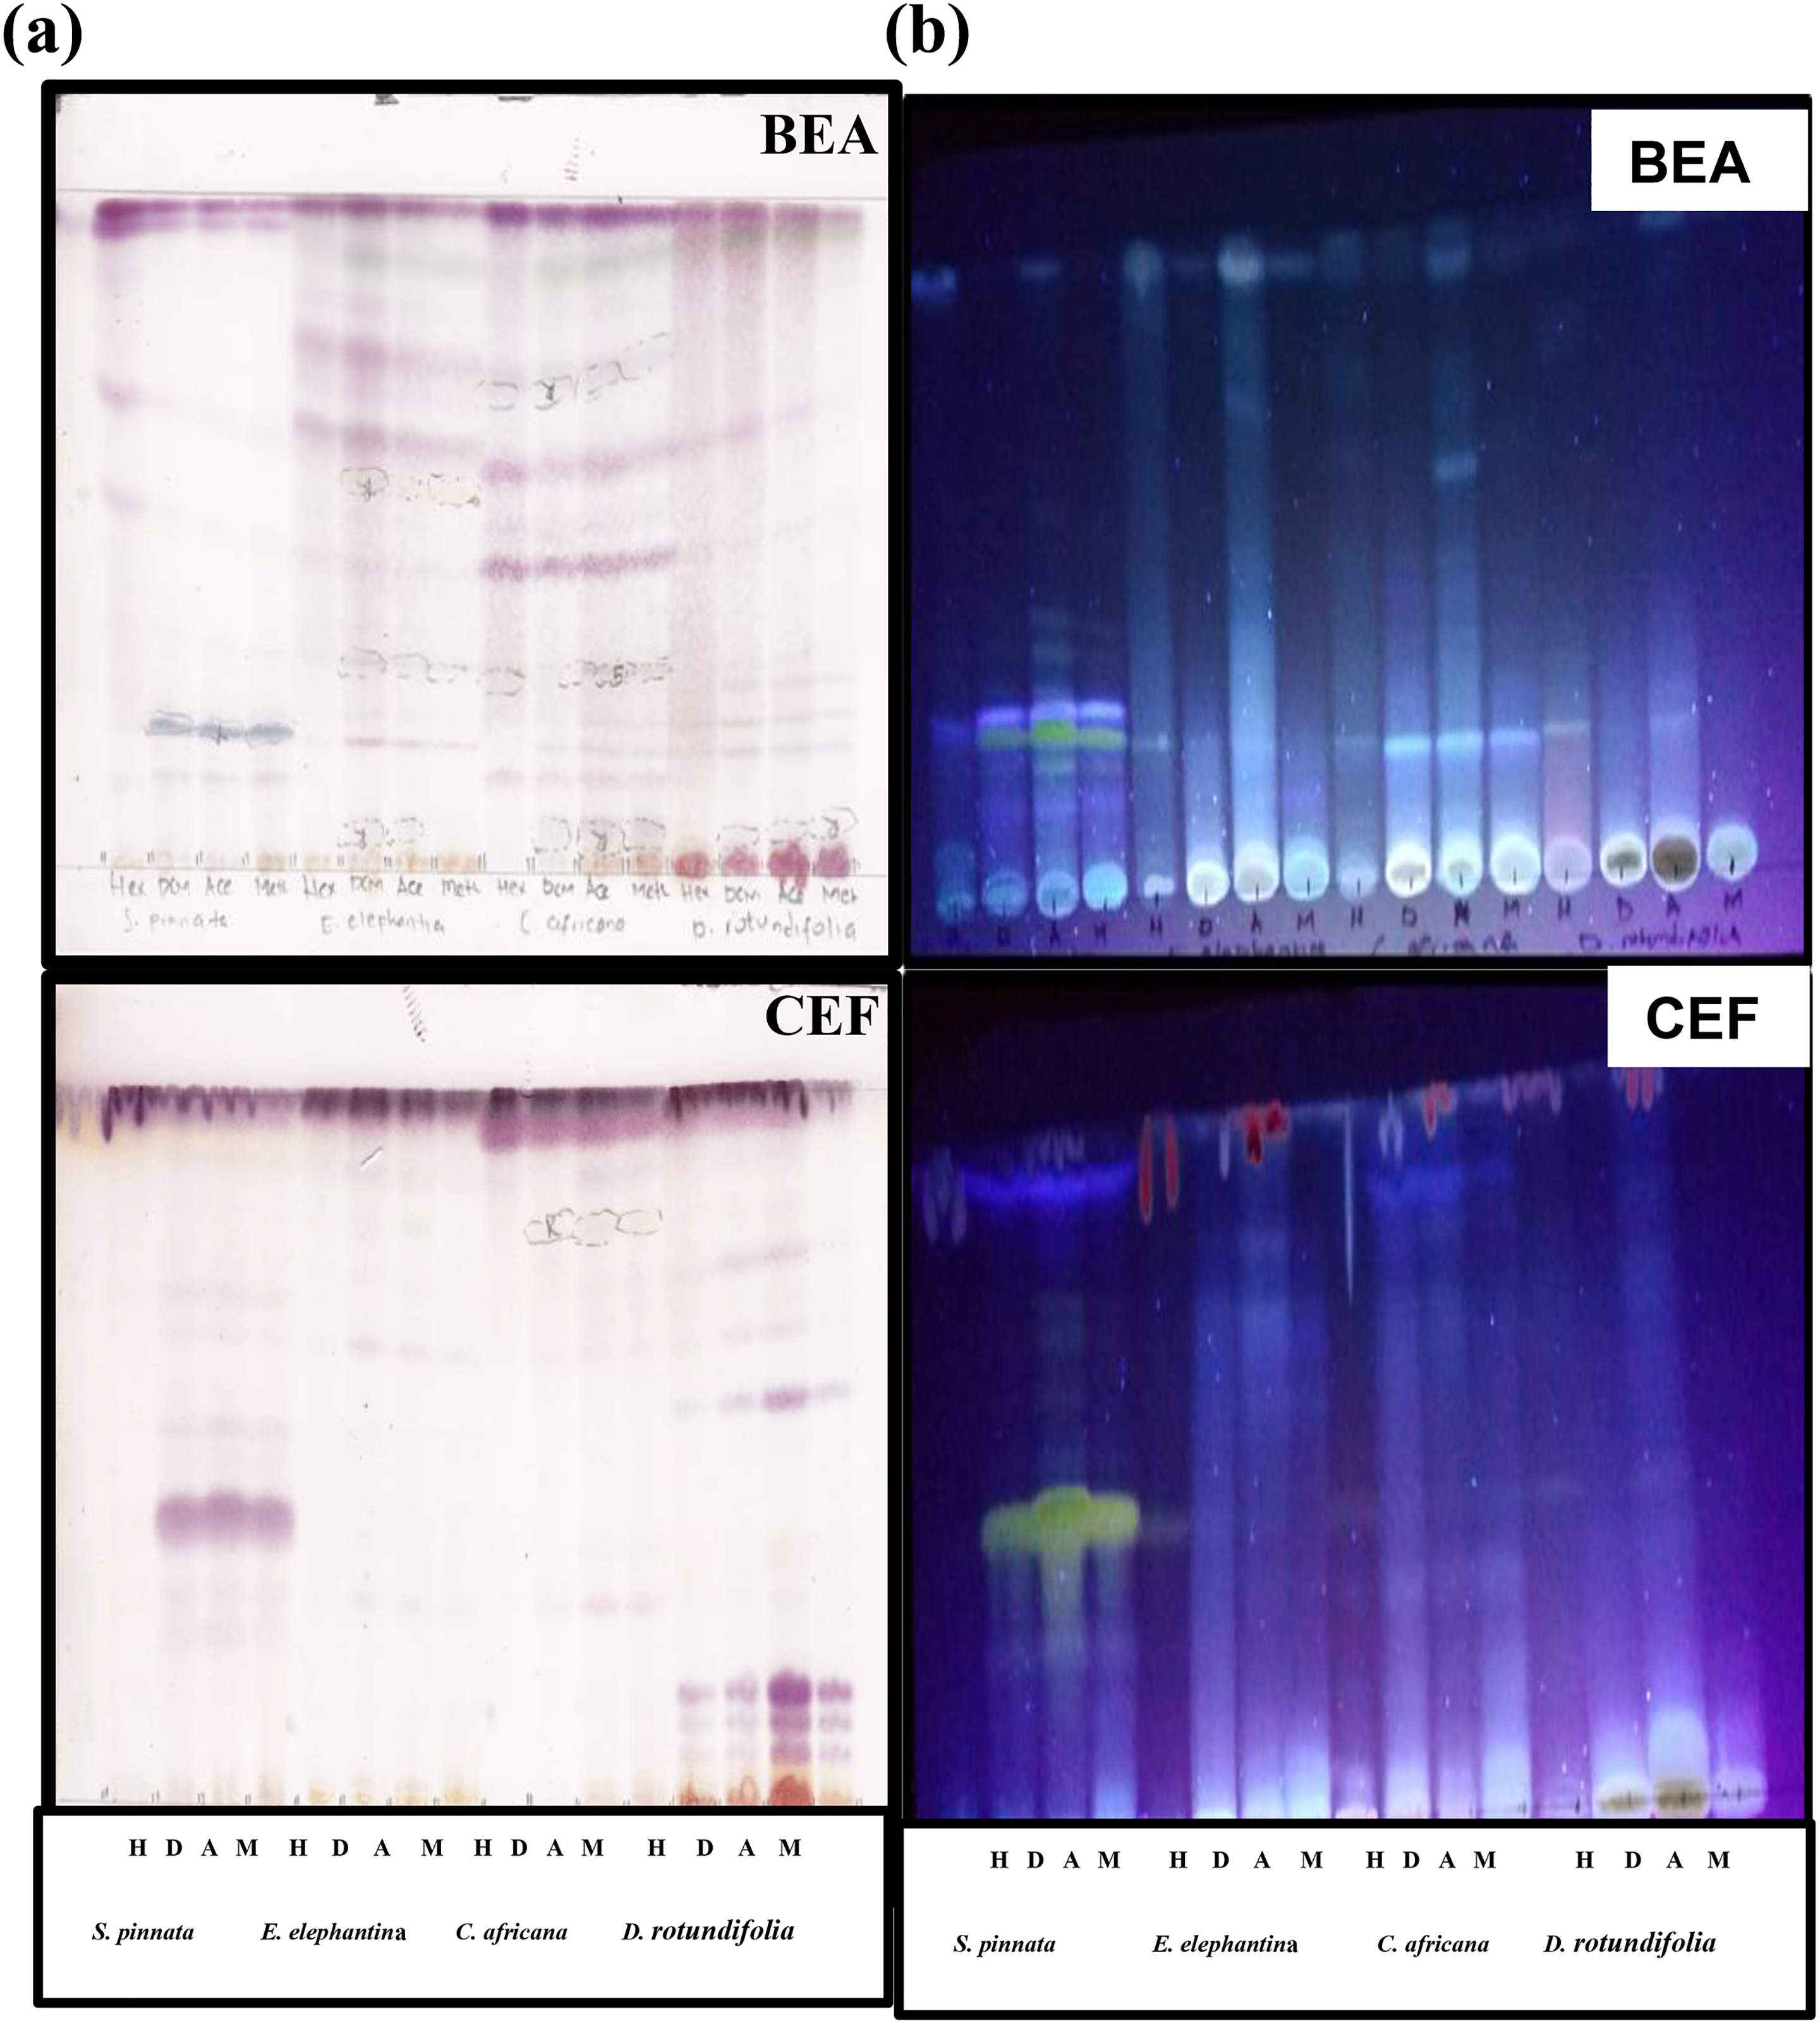
The chromatograms obtained after running the thin layer chromatographic aluminum backed plates loaded with the plant extracts (Schkuhria pinnata, Elephantorrhiza elephantina, Commelina africana, and Dombeya rontudifolia) in BEA and CEF mobile phases and sprayed with vanillin–sulfuric acid (a) and viewed under ultraviolet light (b) for phytochemical analysis. H, n-hexane; D, dichloromethane, A, acetone; M, methanol; BEA, benzene/ethanol/ammonium hydroxide (18:2:0.2); CEF, chloroform/ethyl acetate/formic acid (10:8:2).
Table 2 represents the phytochemicals which could be responsible for the medicinal activity of the selected plants. Steroids, tannins, and cardiac glycosides were present in all the plants while alkaloids were absent. Terpenoids and saponins were detected in all the plants except in E elephantina, while all the plants investigated except S pinnata contained flavonoids. These bioactive compounds have therapeutic value and may possess one or more biological activity hence the importance of preliminary screening of phytochemicals when studying medicinal plants. The quantitative measure of total phenolic, tannin, and flavonoid content are presented in Table 3. The quantity of these phytochemicals varied between the plant species. The highest concentration of phenolic (259.00 ± 2.65 mg GAE/g of sample), tannin (330.33 ± 15.63 mg GAE/g of sample), and flavonoid (19.90 ± 0.75 mg QE/g of sample) content was recorded with D rotundifolia. This was followed by C africana with 113.67 ± 5.77 mg GAE/g of sample, 116.00 ± 3.46 mg GAE/g of sample, and 14.10 ± 0.30 mg QE/g of sample for phenolic, tannin, and flavonoid content respectively. The lowest amount of these phytochemicals was recorded with S pinnata, phenolic (55.33 ± 3.51 mg GAE/g of sample), tannin (28.00 ± 1.73 mg GAE/g of sample), and flavonoid content (4.00 ± 0.35 mg QE/g of sample). The preliminary screening results revealed that flavonoids were absent in S pinnata; however, they were detected when using the quantitative method. This is probably because they were too low to be detected. These observations are in line with those reported by Agunbiade et al, 16 Reid et al, 41 Mpofu et al, 42 for C africana, D rotundifolia, and E elephantina with an exception of the absence of alkaloids, which Mpofu et al 42 reported on their presence in trace amounts in E elephantina. In all the plants, the total phenolic content is higher than the flavonoid content because most flavonoids are also phenols. These important phytochemicals have been reported to be responsible for a number of activities, including antioxidant activity. 43
Phytochemical Constituents of the Schkuria pinnata, Elephantorrhiza elephantina, Commelina africana, and Dombeya rontudifolia Leaf Extracts.a

a“+” indicates presence and “−” indicates absence.
Total Phenol, Tannin, and Flavonoid Content Concentrations of the 70% Aqueous Acetone Extract of 4 Selected Plants.
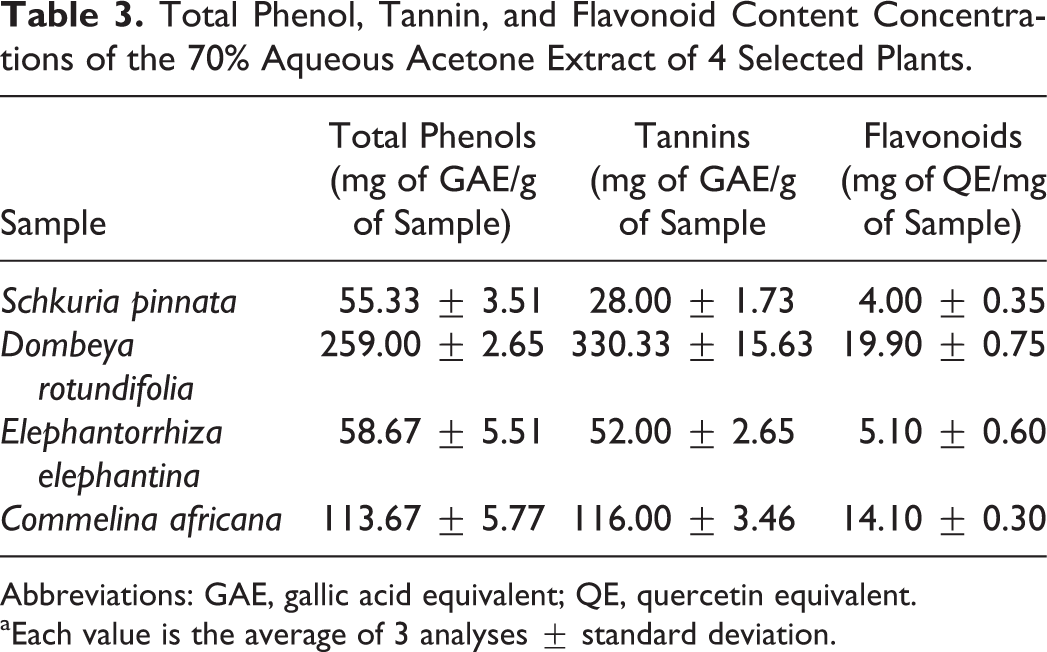
Abbreviations: GAE, gallic acid equivalent; QE, quercetin equivalent.
aEach value is the average of 3 analyses ± standard deviation.
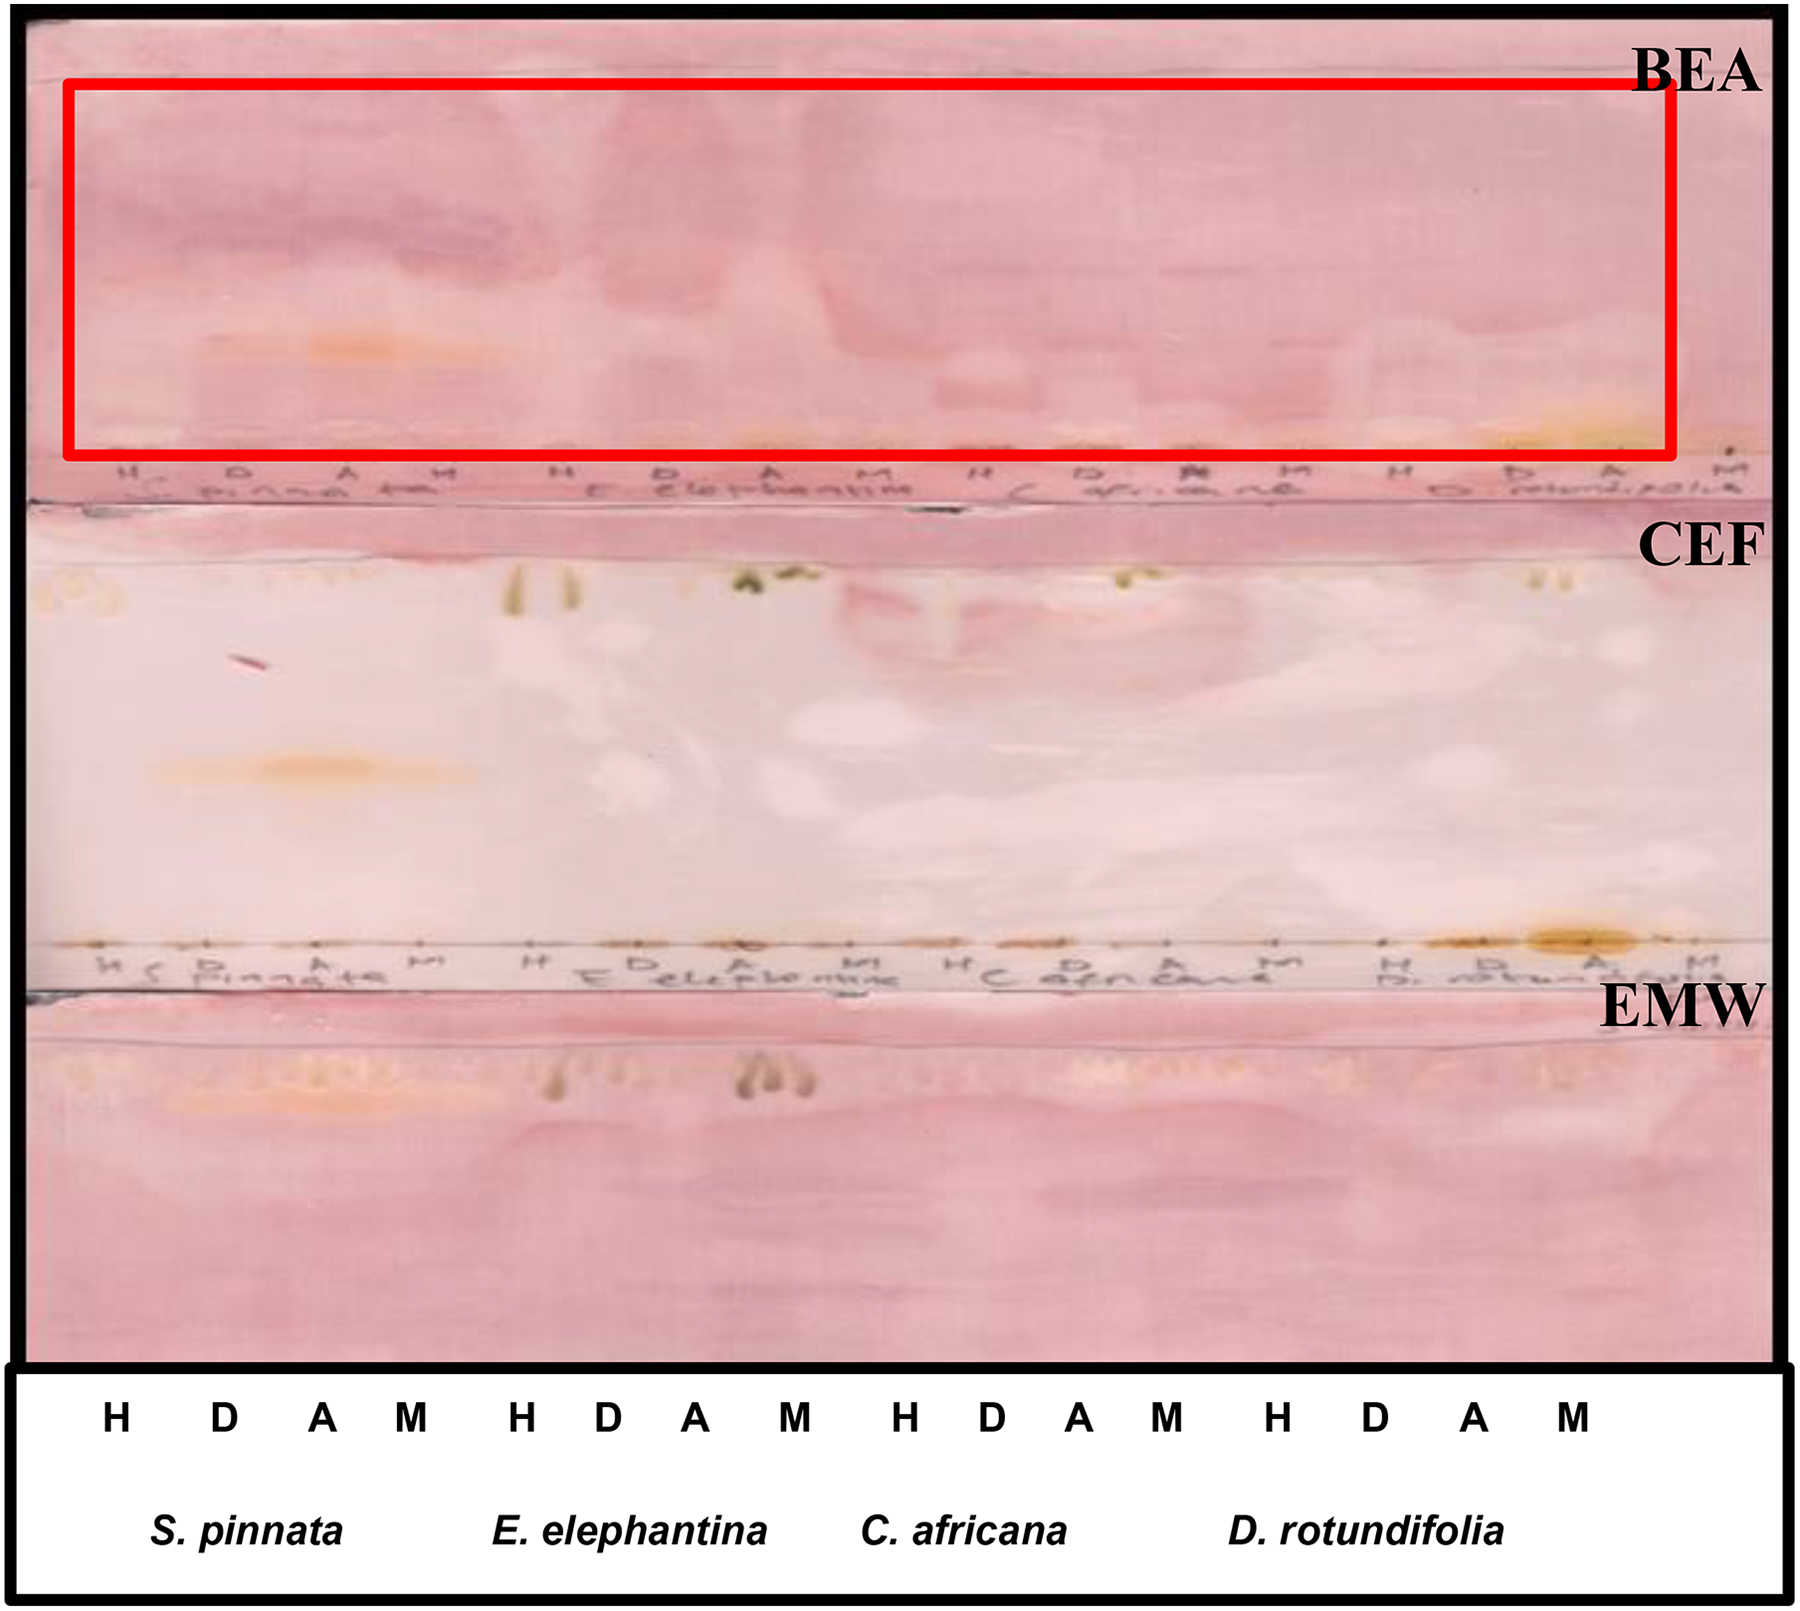
Figure 3 shows the presence antioxidant constituents in the extracts of D rotundifolia that are polar as yellow spots against the purple background, even though they were not well separated when developed in BEA and CEF solvent systems. This suggests that the extracts contain hydrogen-donating antioxidant compounds, which were able to reduce DPPH to a yellow DPPH-H. The observed antioxidant compounds were not separated probably because of their polarity relative to the solvent systems. One could possibly alter the ratio of the solvent to achieve good separation. The same plant had the highest anti–free radical activity against DPPH with the lowest half-maximal effective concentration (EC50; 0.27 ± 0.0007) while the lowest was recorded in S pinnata with the highest EC50 (2.98 ± 0.0071) (Table 4). It is worth noting that EC50 is the concentration of the antioxidant required to scavenge half of the free radicals present, and the lower the EC50 value, the higher the antioxidant activity. The reducing power method of antioxidant capacity assay revealed that D rotundifolia had the highest reducing power while the other plants showed almost equal efficacy that is lower (Figure 4). The reducing power capacity of all the plants increased in a dose-dependent manner. This method is based on the ability of antioxidants in the plants to reduce the ferric complex to its ferrous form. 31 D rotundifolia plant which had the highest total phenolic, tannin, and flavonoid content also displayed the highest free radical scavenging and ferric reducing capacity. This correspondence may be attributed to the well-known fact that phenolics and flavonoids possess high antioxidant potential 31 as free radical scavengers and metal ion reducers. 44

Chromatograms obtained after development of the plant extracts in BEA, CEF, and EMW mobile phases and sprayed with 0.2% DPPH in methanol for antioxidant analysis. H, n-Hexane,;D, dichloromethane; A, acetone; M, methanol; BEA, benzene/ethanol/ammonium hydroxide (18:2:0.2); CEF, chloroform/ethyl acetate/formic acid (10:8:2); EMW, ethyl acetate/methanol/water (10:1.35:1); DPPH, 2,2-diphenyl-1-picrylhydrazyl.
The Free Radical Scavenging Potential (EC50 Values) of the 70% Aqueous Acetone Extracts of the Selected Plants Against Ascorbic Acid as a Positive Control.

Abbreviations: DPPH, 2,2-diphenyl-1-picrylhydrazyl; EC50, half-maximal effective concentration.

The reducing power potential of the selected plants and ascorbic acid, with absorbance increasing with increasing concentration.
The screening for antibacterial potential of the extracts employed both qualitative and quantitative methods, using both Gram-negative and Gram-positive bacteria as test microorganisms to check the spectrum of activity of the extracts. The microbroth dilution assay was used to determine the lowest concentrations of the plant extracts that lead to growth inhibition of the tested bacteria, expressed as the MIC values (Table 5). Findings of this study revealed the plants to exhibit antibacterial activity against the tested bacteria with the most susceptible against test extracts being E coli with an average MIC value 0.87 mg/mL, followed by P aeruginosa (1.92 mg/mL). E faecalis (2.07 mg/mL) and S aureus (1.92 mg/mL) were the least susceptible to the effect of the extracts. The acetone extract of C africana was the most effective with MIC value of 0.02 mg/mL against E coli. The acetone and methanol extract of D rotundifolia and those of S pinnata were shown to have MIC values of 0.32 mg/mL, as well as the dichloromethane, acetone, and methanol extract of E elephantina against E coli. The results suggest that the extracts of the selected plants have antibacterial compounds with broad spectrum activity but are more effective in inhibiting growth of Gram-negative bacteria than Gram-positive bacteria. The different sensitivity observed between Gram-negative and Gram-positive bacteria is because of the difference in cell membrane morphology. 45 The MIC values for the positive control (ampicillin) were ranging from 0.02 to 0.08 mg/mL. The antibacterial potential of the selected plants observed may be due to the presence of tannins, flavonoids, and terpenoids which were reported to have various pharmacological activities, including antibacterial activity. 46
The Minimum Inhibitory Concentration (MIC) Values of the Selected Plant Extracts (mg/mL) Against the Tested Bacteria.

Abbreviations: H, n-hexane; D, dichloromethane; A, acetone; M, methanol.
Previous studies on antibacterial potential of the selected plants against the tested bacteria are as follows: E elephantina, 13,47–50 D rotundifolia. 51 The MIC for E elephantina methanolic and acetone extracts against S aureus were 0.16 mg/mL and 0.320 mg/mL, respectively. However, E coli was reported to be resistant to both extracts. 49 No records of reports have been found on the antibacterial potential of both C africana and S pinnata against the tested bacteria used in this study using the bioautography and microbroth dilution method.
Eloff 51 reported on the importance of considering the total activity of the extracts altogether with the MIC when assessing the activity of the extracts. This is the volume with which the bioactive compounds in 1 g could be diluted to and still inhibits growth of the test bacteria. As shown in Table 6, the highest total activity was observed with the acetone extract of C africana (600 mL/g) followed by the methanolic extract of S pinnata (466 mL/g) against E coli and the lowest with the n-hexane extract of C africana (1.6 mL/g) against all the tested pathogens. This means that the quantity extracted from 1 g of C africana with acetone can be diluted to 600 mL/g and still inhibit the growth of E coli.
The Total Activity of the Selected Plant Extracts (mL/g) After 24 Hours of Incubation.

Abbreviations: H, n-hexane; D, dichloromethane; A, acetone; M, methanol.
Bioautograms were obtained after spraying the eluted plates with the test bacteria. The white areas against the purple-pink background indicate antimicrobial activity of the extracts, where the tetrazolium salts were not reduced to formazan because of the presence of compounds that inhibited microbial growth. The results demonstrated that all the selected plants exhibited antibacterial potential against P aeruginosa (Figure 5) and E coli (Figure 6) on the chromatogram eluted in BEA. However, no activity was observed on the chromatogram eluted in CEF. The lack of activity on plates maybe related to poor separation of compounds against these bacteria on TLC eluted in CEF and EMW. This assumption holds true because only dichloromethane, acetone, and methanol extracts were shown to exhibit prominent activity against E coli on a chromatogram eluted in EMW (Figure 6). The extracts showed less activity against E. faecalis (Figure 7) and no activity against S aureus (results not shown).
The bioautograms of different leaf extracts obtained after separation in different separation systems, spraying with overnight Pseudomonas aeruginosa cultures and visualized by spraying with 2 mg/mL ρ-iodonitrotetrazolium violet (INT). Circle indicates where the activity was observed. H, n-hexane; D, dichloromethane; A, acetone; M, methanol.

Bioautograms of different leaf extracts obtained after separation in different separation systems, spraying with overnight Escherichia coli cultures and visualized by spraying with 2 mg/mL ρ-iodonitrotetrazolium violet (INT). Circle indicates where the activity was observed. H, n-hexane; D, dichloromethane; A, acetone; M, methanol.

Bioautograms of different leaf extracts obtained after separation in different separation systems, spraying with overnight Enterococcus faecalis cultures and visualized by spraying with 2 mg/mL ρ-iodonitrotetrazolium violet (INT). Circle indicates where the activity was observed. H, n-hexane; D, dichloromethane; A, acetone; M, methanol.
Overall, more activity was observed on the chromatograms separated in BEA followed by EMW; this implies that the extracts have more nonpolar antibacterial bioactive compounds than polar compounds. All the extracts showed poor antibacterial activity against all the tested bacteria on the chromatograms developed in CEF probably because of the toxicity of the traces of formic acid that was included in the mobile phase. 38,45
The extracts had promising antibacterial potential against the tested bacteria. However, the bioautography results did not correlate with the MIC results. It was observed that the C africana extracts, which had poor antibacterial activity against P aeruginosa in the micro-dilution method (highest MIC), had better antibacterial activity on the bioautographic method than the S pinnata extracts. Bioactive compounds contained in S pinnata can be separated or used as mixtures and still bring about inhibition of microbial growth. Many studies report on pharmacokinetics of many natural bioactive compounds to have better activity when applied as mixtures than as single compounds. 52
Conclusion
The study demonstrated that the extracts of the selected plants have antibacterial potential against E coli and P aeruginosa, which may be attributed to the nonpolar and polar phytochemicals present in the plants. Furthermore, the D rotundifolia extracts had free radical scavenging and reducing power antioxidant potential, which way be attributed to the highest amount of phenolics and flavonoids observed in the former plant. Therefore, the attained association between the supposed main classes of compounds in the extracts and promising activity in the study may lead in the future isolation and evaluation of the bioactive compounds. Further phytochemical and pharmacological studies of these plants are essential and significant for possible application as natural plant–based drugs in the pharmaceutical industry.
Footnotes
Acknowledgments
We would like to thank the National Research Foundation and University of Limpopo for financial support and Dr Victor Bagla for proofreading.
Author Contributions
RGK carried out the experiments and analyzed the data. PM was involved with conception and design of the study.
Declaration of Conflicting Interests
The authors declared no potential conflicts of interest with respect to the research, authorship, and/or publication of this article.
Funding
The authors disclosed receipt of the following financial support for the research, authorship, and/or publication of this article: Financial assistance was provided by the University of Limpopo and National Research Foundation.
Ethical Approval
The study protocol was confirmed by University of Limpopo Ethics Committee (TREC/248/2017: IR).