
Abstract
Detection of mitochondria-ER contacts (MERCs) from diffraction limited confocal images commonly uses fluorescence colocalization analysis of mitochondria and endoplasmic reticulum (ER) as well as split fluorescent probes, such as the split-GFP-based contact site sensor (SPLICS). However, inter-organelle distances (∼10–60 nm) for MERCs are lower than the 200–250 nm diffraction limited resolution obtained by standard confocal microscopy. Super-resolution microscopy of 3D volume analysis provides a two-fold resolution improvement (∼120 nm XY; 250 nm Z), which remains unable to resolve MERCs. MCS-DETECT, a membrane contact site (MCS) detection algorithm faithfully detects elongated ribosome-studded riboMERCs when applied to 3D STED super-resolution image volumes. Here, we expressed the SPLICSL reporter in HeLa cells co-transfected with the ER reporter RFP-KDEL and label fixed cells with antibodies to RFP and the mitochondrial protein TOM20. MCS-DETECT analysis of 3D STED volumes was compared to contacts determined by co-occurrence colocalization analysis of mitochondria and ER or the SPLICSL probe. Percent mitochondria coverage by MCS-DETECT derived contacts was significantly smaller than those obtained for colocalization analysis or SPLICSL, and more closely matched contact site metrics obtained by 3D electron microscopy. Further, STED analysis localized a subset of the SPLICSL label to mitochondria with some SPLICSL puncta observed to be completely enveloped by mitochondria in 3D views. These data suggest that MCS-DETECT reports on a limited set of MERCs that more closely corresponds to those observed by EM.
Keywords
Introduction
Cellular organelles form segregated microenvironments that serve a variety of independent functions in the cell (Scorrano et al., 2019). Organelles interact with each other at membrane contact sites (MCS), regions in the cell where membranes of two organelles come into close proximity without fusing (Helle et al., 2013; Voeltz et al., 2024). Contact sites form predominantly between the endoplasmic reticulum (ER) and other organelles, including mitochondria, endosomes, lysosomes, the plasma membrane, peroxisomes and lipid droplets. Mitochondria-ER contacts (MERCs) were the first type of MCS to be characterized (Bernhard and Rouiller, 1956; Vance, 1990; Scorrano et al., 2019) and arguably the most well-studied MCS (Vance, 2020). MERCs are involved in a diverse array of processes including intracellular signaling, lipid metabolism, organelle dynamics and more (Prinz et al., 2020), and can present varied interorganelle distances ranging from 10–80 nm (Giacomello and Pellegrini, 2016).
MCS were initially visualized in cells with electron microscopy (EM) (Bernhard and Rouiller, 1956), and EM remains the gold standard for ground truth in contact site research (Nabi et al., 2024). Fluorescence microscopy is the optimal modality to study cell structures based on its capacity to label multiple, specific proteins of interest in conjunction with its amenability to live cell studies. However, the study of membrane contact sites by fluorescence microscopy is challenging as interorganellar distances are below the 200–250 nm resolution of diffraction-limited optical microscopy (Scorrano et al., 2019). Indeed, fluorescence colocalization has been used extensively to report on relative changes in organelle contact sites in numerous studies, including our own (Wang et al., 2000; Goetz et al., 2007; Li et al., 2015). However, while the development of various super-resolution microscopy techniques such as stimulated emission depletion microscopy (STED) (Hell and Wichmann, 1994), structured illumination microscopy (SIM) (Heintzmann and Huser, 2017), and single molecule localization microscopy (SMLM) (Moerner and Kador, 1989; Betzig, 1995) has narrowed the resolution gap between fluorescence microscopy and EM, imaging MCS by fluorescent microscopy in the 3D space of the cell remains challenging.
To facilitate the study of MCS with light microscopy, various approaches using fluorescent probes have been developed and applied, including colocalization of organelle labels, as well as a plethora of techniques aimed at identifying contacts directly, such as Förster resonance energy transfer (FRET) (Csordas et al., 2010), bimolecular fluorescence complementation (BiFC) (Cieri et al., 2018; Vallese et al., 2020), dimerization dependent fluorescent proteins (ddFP) (Naon et al., 2016), and proximity ligation assay (PLA) (Tubbs and Rieusset, 2016). Here, we utilize the recently developed split-GFP-based contact site sensor (SPLICS) (Cieri et al., 2018; Vallese et al., 2020), where GFP moieties targeted to organelle membranes reconstitute fluorescence upon organelle proximity. SPLICS improves upon previous fluorescent probe approaches by being amenable to detection of a range of MERC interaction distances, as well as being flexible for identifying contacts between other organelles as well. A known drawback of SPLICS is the poorly reversible binding of its GFP fragments, resulting in limited applicability for dynamic contact studies (Cieri et al., 2018).
More recently, our group developed a computational approach for identifying contact sites in super-resolution 3D cell volumes, known as the membrane contact site detection algorithm (MCS-DETECT). MCS-DETECT identifies contacts from 3D STED image volumes labeled for mitochondria and ER with subpixel resolution via differential analysis, bypassing the need for segmentation (Nabi et al., 2024). Here, we use SPLICSL, the SPLICS variant designed to label long-range (∼40–50 nm) MERCs, composed of the GFP1–10 moiety localized to the outer mitochondrial membrane (OMM-GFP1-10) and the ER localized β11 strand with a 146 aa spacer (ER-Long β11). We compared SPLICSL and MCS-DETECT detection of MERCs with co-occurrence based colocalization of mitochondria and ER probes in 3D STED super-resolution image volumes in HeLa cells. By confocal microscopy, the majority of the SPLICSL probe associated with sites of mitochondria-ER colocalization, however by STED super-resolution microscopy the SPLICSL probe localized to both sites of mitochondria-ER colocalization as well as exclusively to mitochondria. Application of MCS-DETECT to super-resolution 3D STED volumes identifies MERCs with ten-fold higher specificity than either the SPLICSL probe or mitochondria-ER colocalization and corresponds more closely to the mitochondria surface coverage reported by focused-ion beam scanning electron microscopy (FIB-SEM) analysis of MERCs (Heinrich et al., 2021).
Results
Analysis of 3D STED Volumes of HeLa Cells Expressing SPLICSL Probe
In order to compare SPLICSL and MCS-DETECT to identify MERCs, HeLa cells were cotransfected with the SPLICS long (SPLICSL) split-GFP probe (Vallese et al., 2020) and RFP tagged with the KDEL ER retention signal (RFP-KDEL) as an ER reporter. After fixation (Gao et al., 2019), anti-TOM20 labeling followed by Alexa Fluor 532 secondary antibody served as a mitochondria reporter and RFP-KDEL labeling was enhanced for STED imaging by anti-RFP labeling with Alexa Fluor 568 secondary antibody labeling. 3D STED image volumes were acquired for all three channels from SPLICSL expressing cells as well as from pcDNA transfected controls (Figure 1A). MCS-DETECT was applied to the mitochondria and ER channels from deconvolved 3D STED volumes to identify MERCs. The output from the algorithm is a 3D stack representing the MCS mask and referred to as MCS-DETECT (Figure 1A, white) (Cardoen et al., 2024).
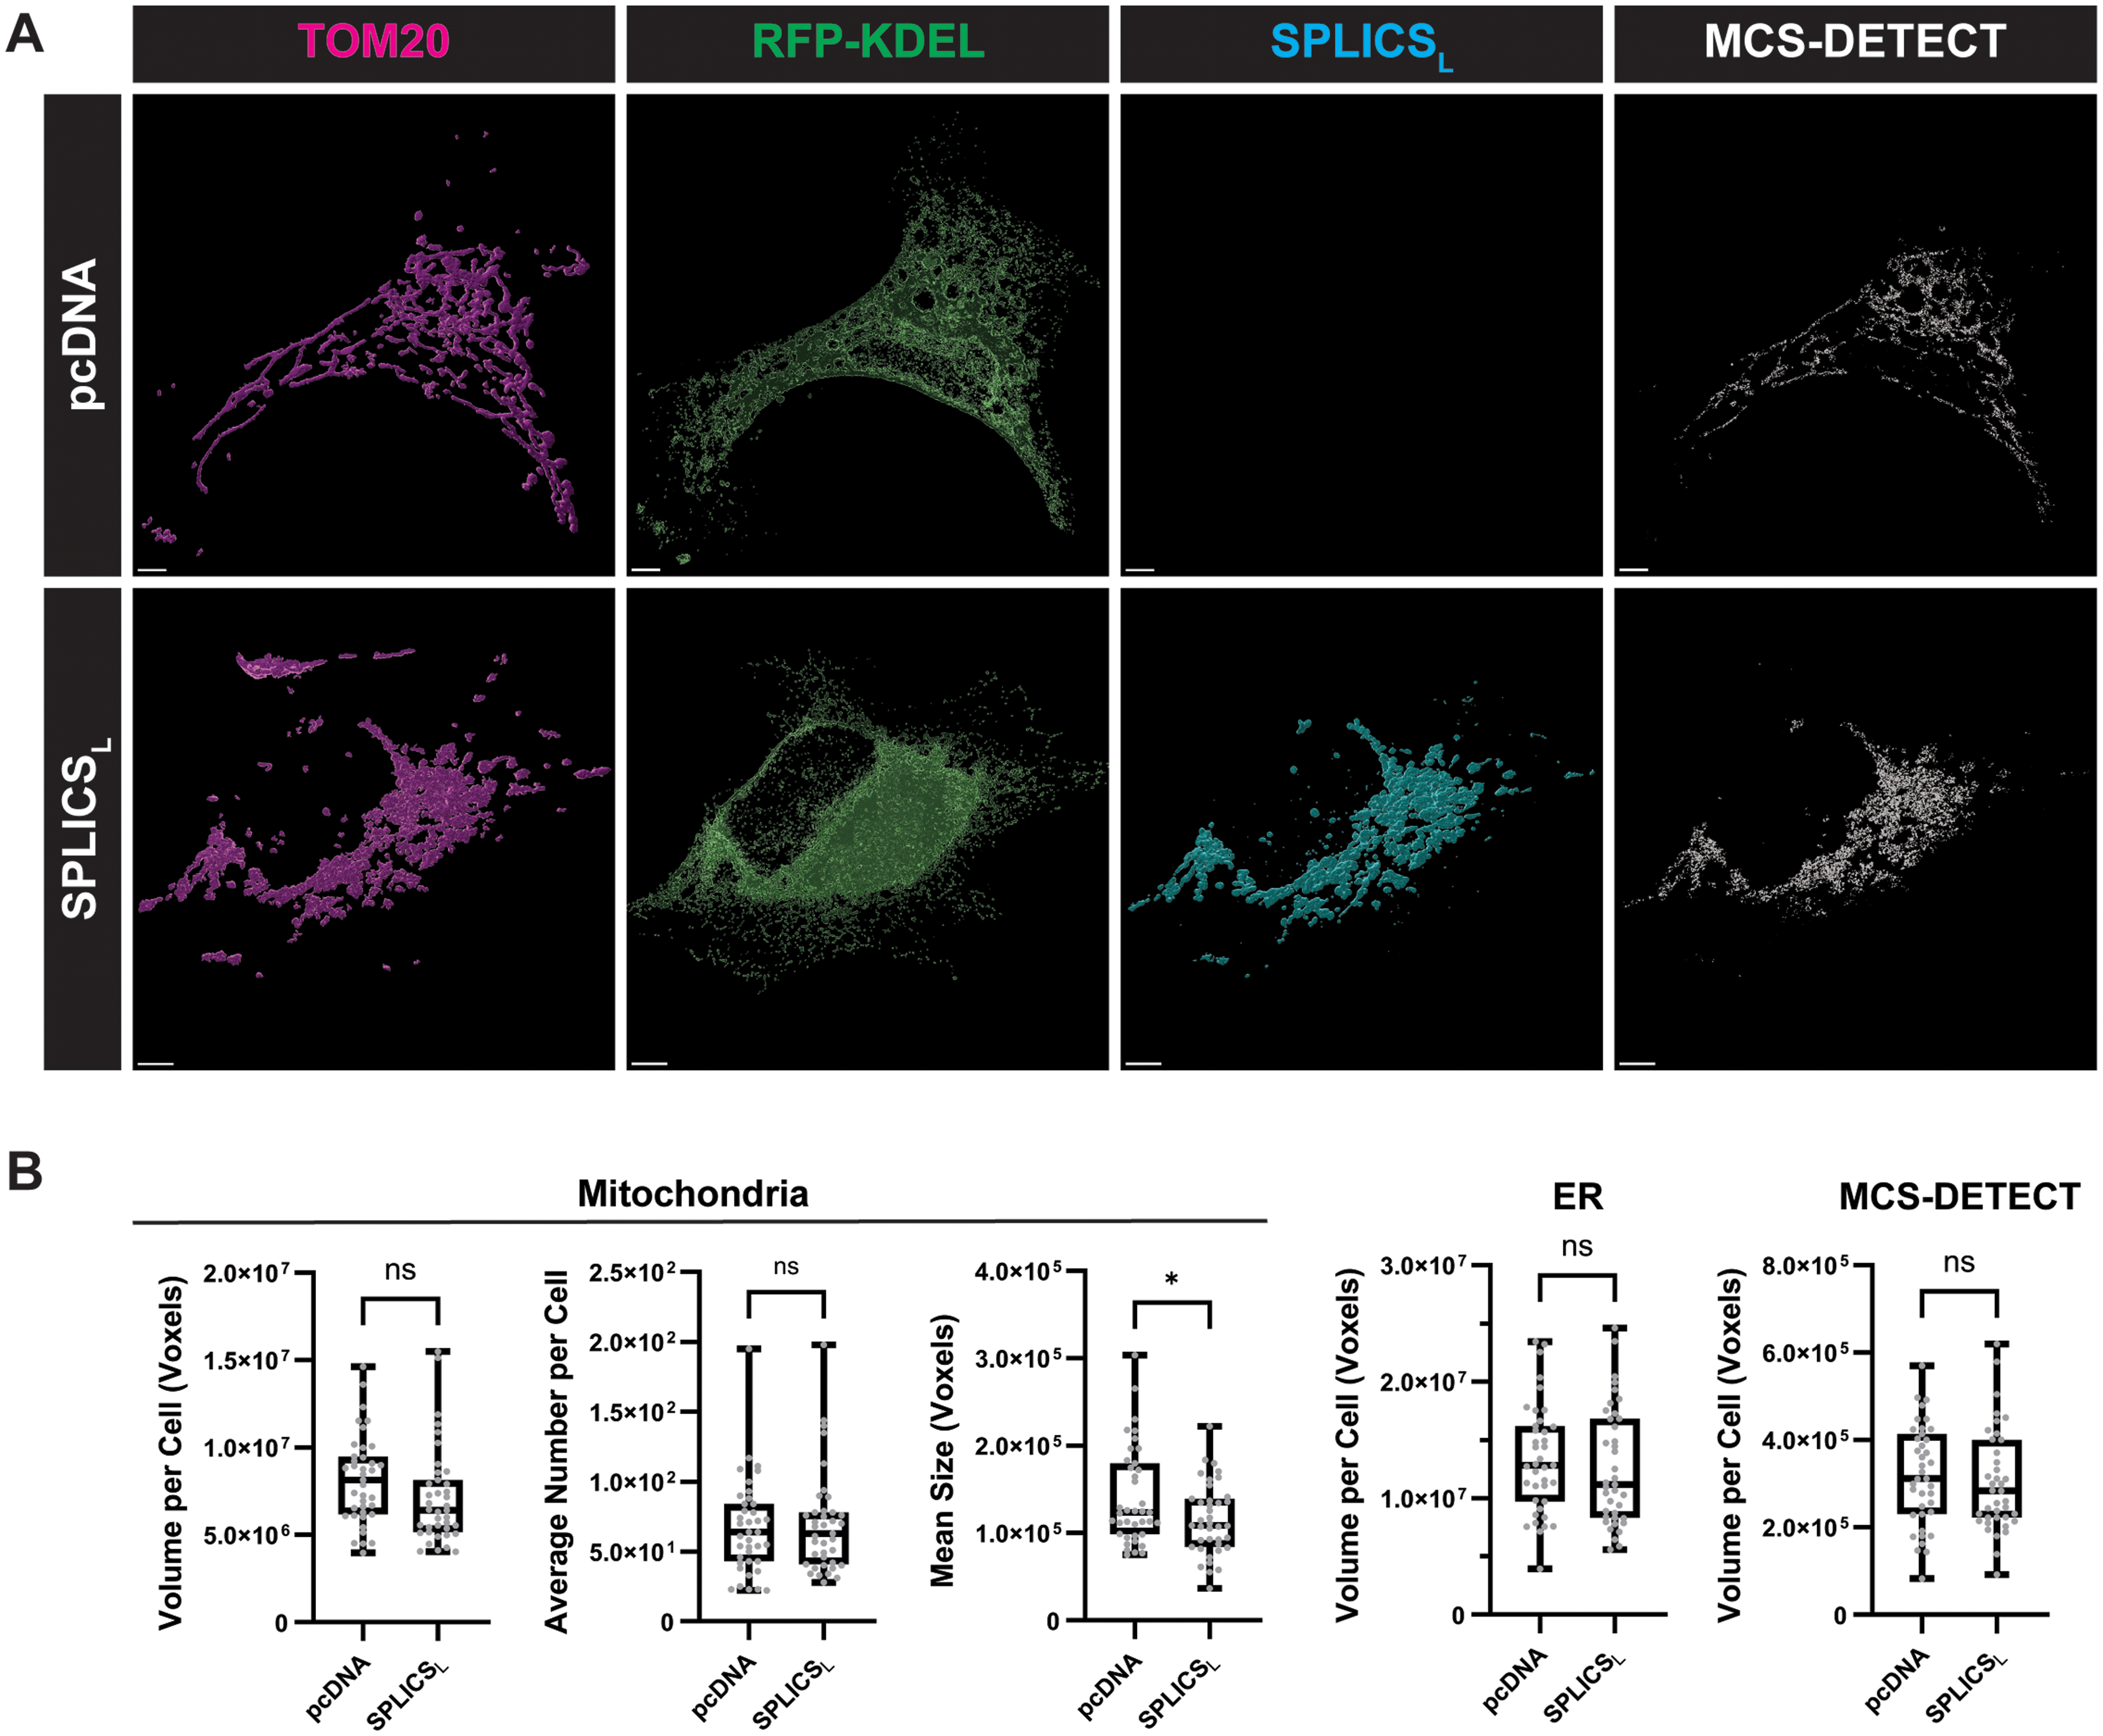
MCS-DETECT analysis of cells expressing SPLICSL probe. (A) Volume-rendered views of HeLa cells co-transfected with RFP-KDEL and either pcDNA or SPLICSL (Cyan). Cells were labeled with anti-RFP (ER; Green) and anti-TOM20 (Mitochondria; magenta) and contact sites rendered by the MCS-DETECT algorithm (White). (B) Mitochondria volume, number and mean size, together with ER, and MCS-DETECT contact site volumes per cell are shown for pcDNA and SPLICSL transfected HeLa cells (Averaged over cell, Student t Test, n = 3 independent biological replicates, ≥10 cells/condition per experiment). (Bar = 5 μm).
To determine if SPLICSL expression impacted mitochondria and ER volumes or the extent of contact sites detected by MCS-DETECT, total volume per cell of the mitochondria, ER and MCS-DETECT masks were quantified. No significant differences were observed in mitochondria or ER volumes per cell between SPLICSL expressing cells compared to pcDNA controls (Figure 1B). Further, MCS-DETECT found similar total contact site volumes per cell in SPLICSL transfected cells compared to pcDNA transfected controls as well (Figure 1B). While transfection of SPLICSL into HeLa cells did not affect mitochondria or ER volume or the extent of contact sites between the organelles as determined using MCS-DETECT, SPLICSL did induce a significant decrease in mitochondria segment size compared to pcDNA controls (Figure 1B) indicative of altered mitochondrial interaction or fusion, if not overall volume per cell. Analysis of SPLICSL expression in HEK293 cells resulted in a significant reduction in mitochondria area (Supp. Fig. 1), leading us to focus our analysis on HeLa cells and highlighting the variable impact of SPLICSL expression on different cell types.
Comparing the Specificity of Contact Site Detection Methods
Closer visual inspection of 3D volume-rendered views of the mitochondria, ER, SPLICSL and MCS-DETECT channels from 3D STED volumes, qualitatively revealed that both SPLICSL probe and MCS-DETECT contact sites localized to mitochondria and associated with regions where the ER overlaps mitochondria (Figure 2). Contact site puncta identified by MCS-DETECT were smaller compared to the SPLICSL puncta and the two were closely associated (Figure 2).

MERCs identified by MCS-DETECT and SPLICSL probe. Volume-rendered views of HeLa cells co-expressing RFP-KDEL and SPLICSL (cyan), labelled with anti-RFP (ER; green) and anti-TOM20 (mitochondria; magenta), with MCS-DETECT contact sites overlaid (white). ROIs from the whole cell view are shown volume-rendered in adjacent panels. (Bar = 5 μm).
To compare the relative specificity of contact site detection methods, the SPLICSL channel and MCS-DETECT contact sites were compared to the co-occurrence based colocalization mask of the mitochondria and ER generated by intersecting the filtered mitochondria and ER channels (hereafter referred to as mito-ER COLOC). From volume-rendered views, SPLICSL puncta were of similar size to those derived from the mito-ER COLOC mask, although of different shapes and exhibiting only partial overlap. Smaller MCS-DETECT contact-site puncta presented complete association with puncta of the mito-ER COLOC mask but only partial association with SPLICSL puncta (Figure 3A). SPLICSL expressing HeLa cells have more centrally localized MERCs compared to pcDNA controls (Supp. Fig. 2) and we present insets of both central and peripheral cell regions (Figure 3A). Contact-sites identified by MCS-DETECT had significantly smaller total volume relative to both SPLICSL and the mito-ER COLOC mask both per cell and when normalized to mitochondrial volume (Figure 3B). Quantification confirmed that the SPLICSL contact mask showed only partial overlap with both the mito-ER COLOC and MCS-DETECT masks; in contrast, the MCS-DETECT mask overlapped completely with the mito-ER COLOC mask (Figure 3C and D). While the volume measurement of the SPLICSL contact masks matched that of the mito-ER COLOC mask, the two contact site masks showed only partial overlap and SPLICSL puncta extended beyond these overlap regions. In contrast, MCS-DETECT contact sites were included in the mito-ER COLOC mask.
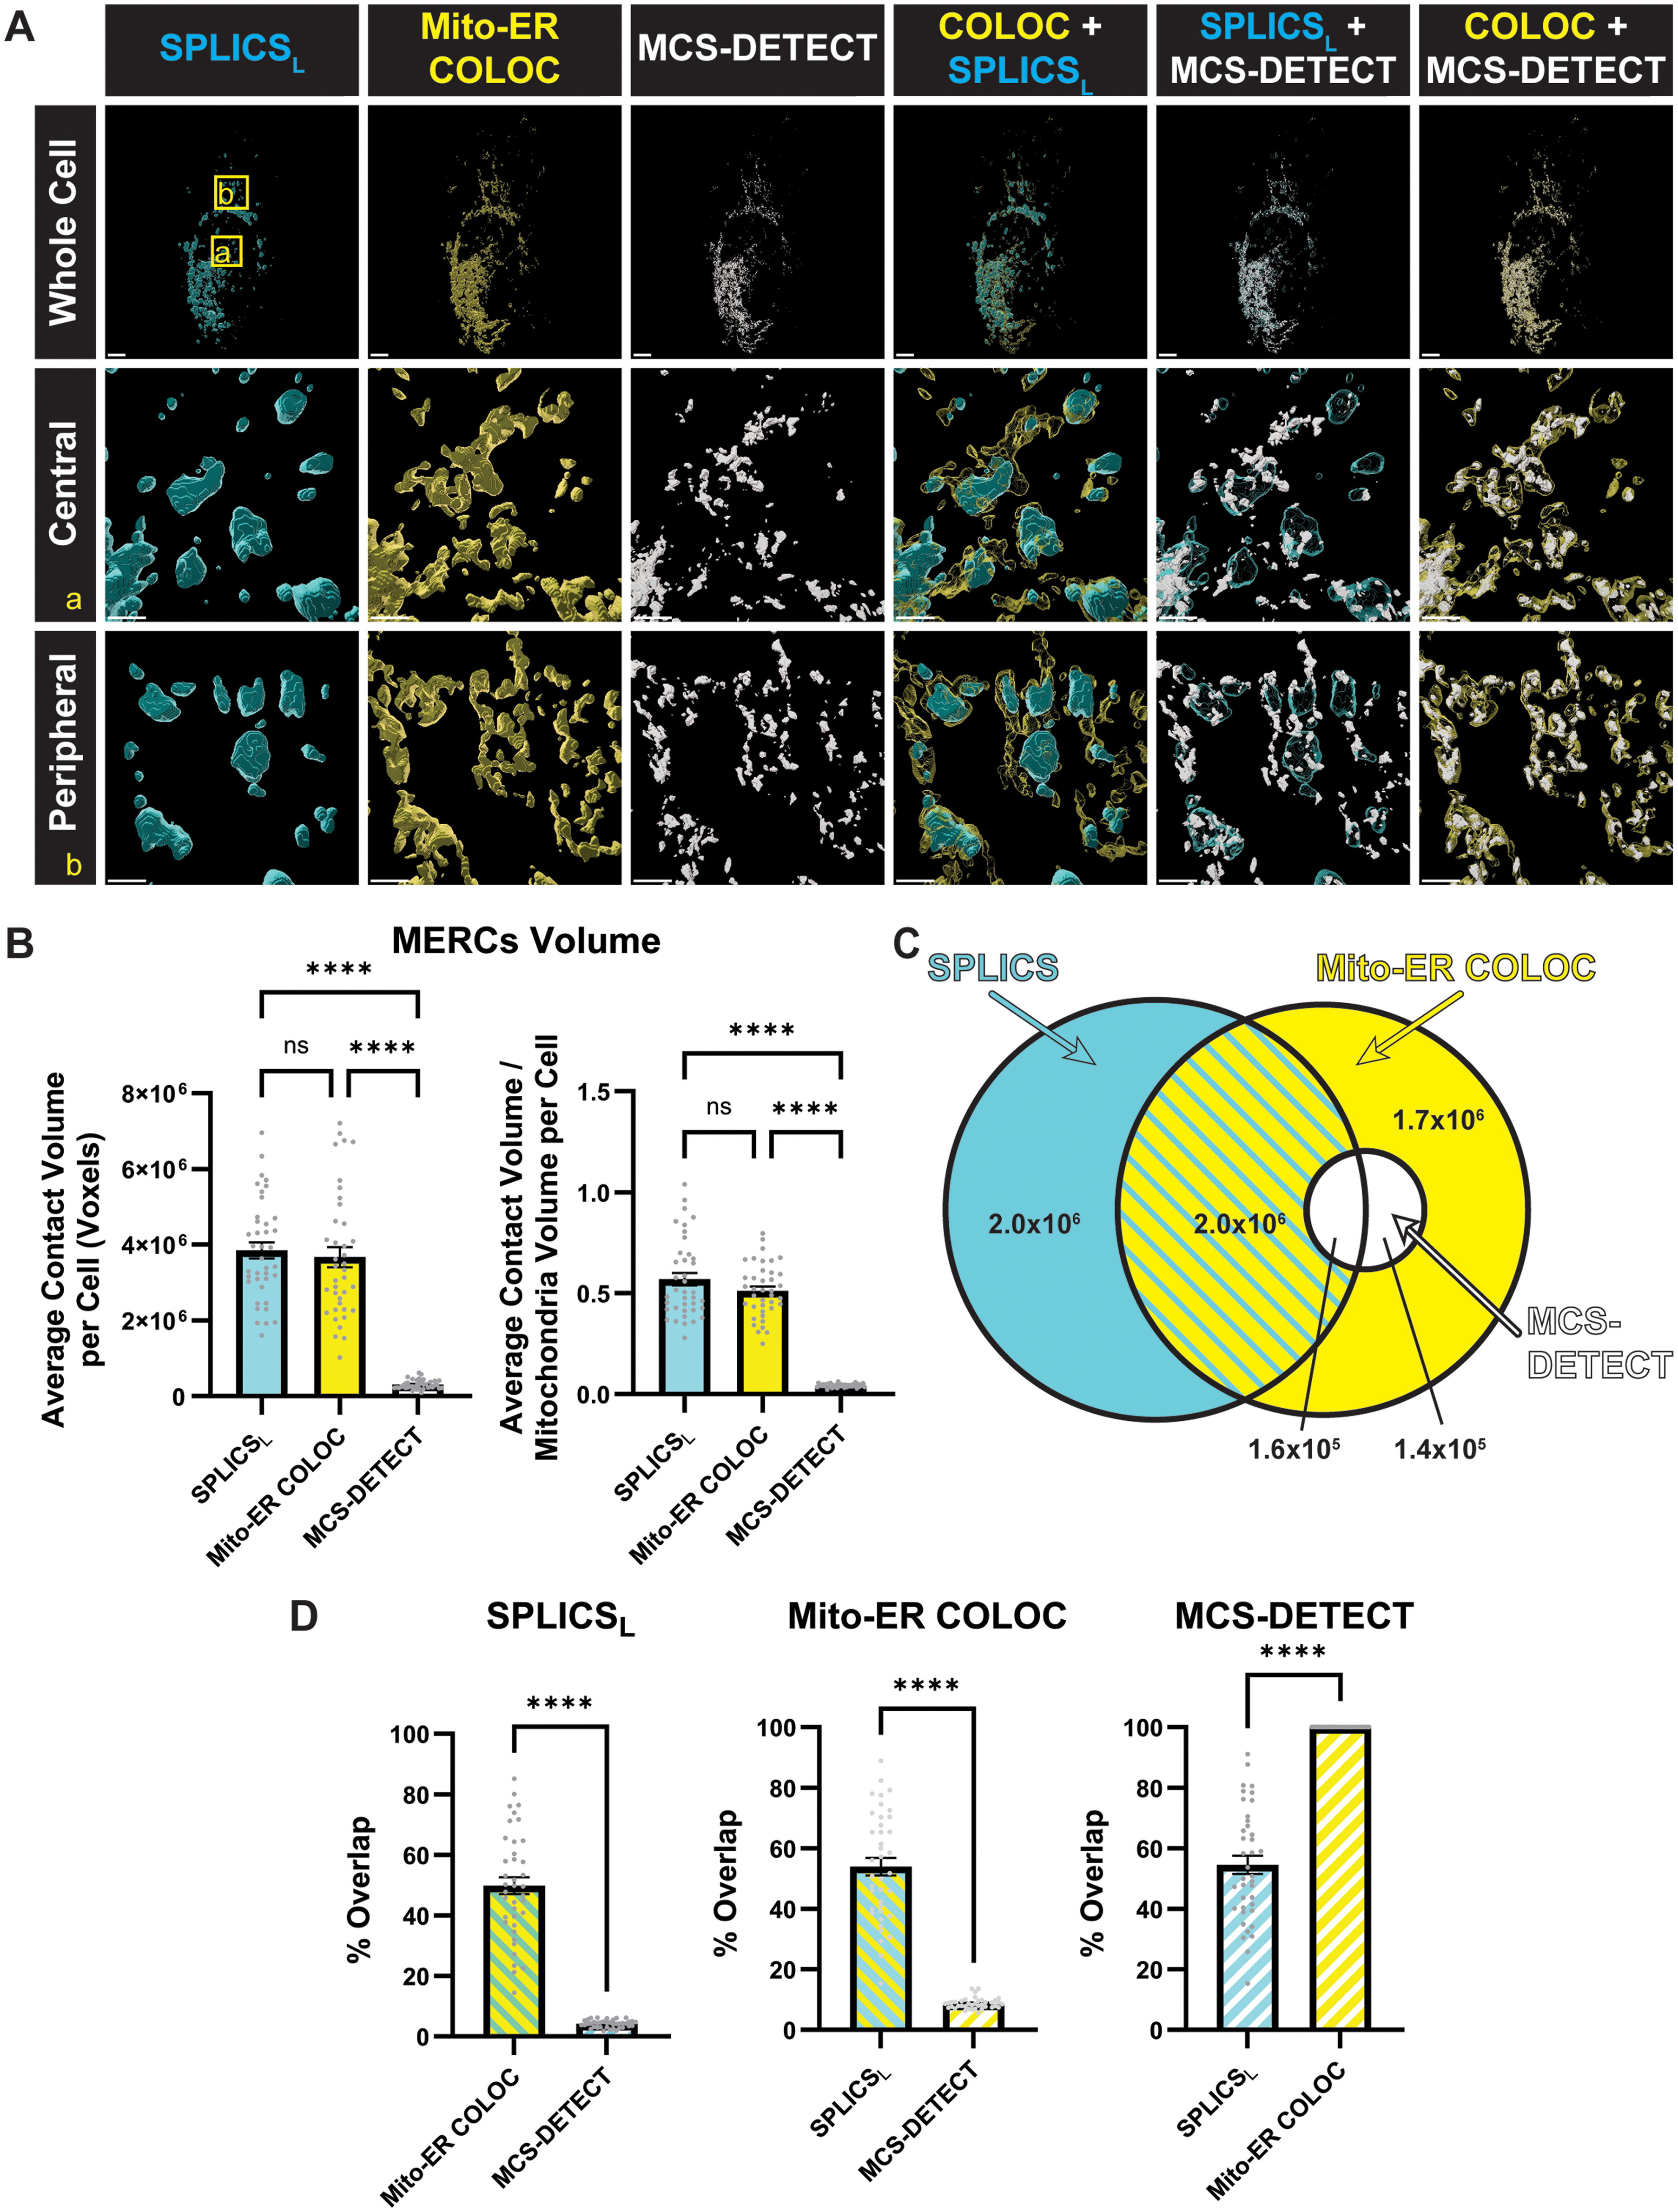
Reduced MERC detection by MCS-DETECT. (A) Volume-rendered views of HeLa cells showing SPLICSL (Cyan), Mito-ER COLOC mask (Yellow), and MCS-DETECT contact sites (White). ROIs from the whole cell view are shown volume-rendered in panels below (Bar = 5 μm). (B) Average total MERC volume per cell, and MERC volume normalized by mitochondrial volume per cell, as identified by SPLICSL, Mito-ER COLOC mask, and MCS-DETECT (Averaged over cell, one-way ANOVA, n = 3 independent biological replicates, ≥10 cells per experiment, ****P < 0.0001). (C) Venn diagram representation of volume overlap between MERCs identified by SPLICSL, Mito-ER COLOC, and MCS-DETECT. (D) Percentage colocalization between MERCs identified by SPLICSL, Mito-ER COLOC, and MCS-DETECT (Averaged over cell, n = 3 independent biological replicates, ≥10 cells per experiment).
A small dataset of two HeLa cells imaged via FIB-SEM provided baseline assessments of the extent of formation of MERCs detecting 7.2 and 0.68% mitochondrial surface coverage by MERCs (Heinrich et al., 2021). MCS-DETECT metrics for MERCs mitochondrial surface coverage more closely matched the FIB-SEM data compared to SPLICSL or the MITO-ER COLOC mask (Table 1). While the number of contacts detected by MCS-DETECT and SPLICSL were in the same range as those detected by FIB-SEM, total contact volume and average contact size for MCS-DETECT were larger than FIB-SEM, although not approaching that of SPLICSL or the MITO-ER COLOC mask that were significantly larger than MCS-DETECT. Based on volume-based overlap analysis, the SPLICSL probe labels contact sites to a similar high (40%) extent to colocalization analysis, ten-fold greater than that reported by MCS-DETECT. Analysis of mitochondrial surface coverage shows that SPLICSL shows reduced association with mitochondria relative to colocalization that remains higher than MCS-DETECT with MCS-detect values approaching that reported by FIB-SEM (Table 1). Differences in contact volume and mitochondrial surface coverage highlight the differences in resolution of the various approaches and suggest improved specificity of contact detection by MCS-DETECT relative to SPLICSL.
Comparison of Mitochondria-ER Contact Site Metrics in HeLa Cells.
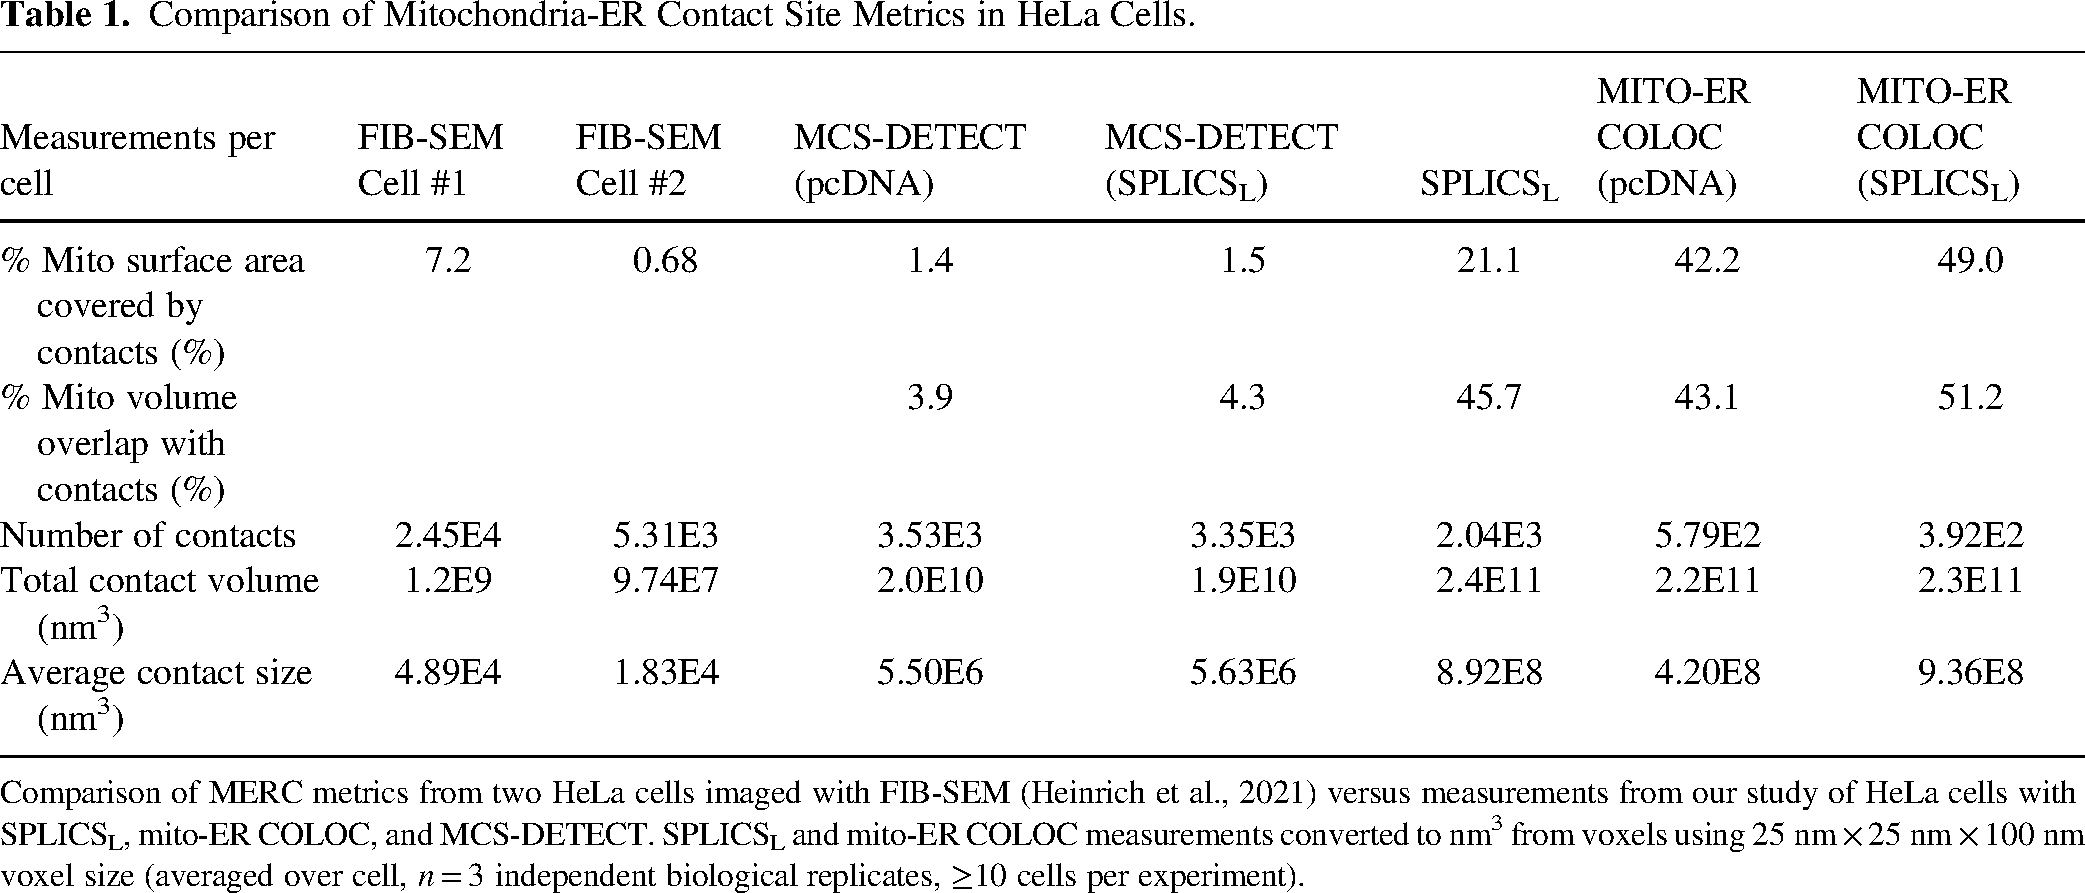
Comparison of MERC metrics from two HeLa cells imaged with FIB-SEM (Heinrich et al., 2021) versus measurements from our study of HeLa cells with SPLICSL, mito-ER COLOC, and MCS-DETECT. SPLICSL and mito-ER COLOC measurements converted to nm3 from voxels using 25 nm × 25 nm × 100 nm voxel size (averaged over cell, n = 3 independent biological replicates, ≥10 cells per experiment).
To complement the mito-ER COLOC mask, we generated additional binary masks from 3D STED volumes, Mitochondria and not ER (Mito only), ER and not mitochondria (ER only) and neither mitochondria nor ER (not Mito & not ER) (Figure 4A) and assessed the extent of their overlap with the SPLICSL and MCS-DETECT contact masks. 50% of the SPLICSL probe localized to the mito-ER COLOC mask (Figure 4B) and the 30% of SPLICSL that overlapped with the “Mito only” mask was significantly greater than 10% overlap with the “ER only” and “not Mito & not ER” masks, the latter likely corresponding to background (Figure 4B). Similarly, fluorescence intensity of SPLICSL localized to the “Mito only” mask was similar to that of the mito-ER COLOC mask and elevated relative to the “ER only” and “not Mito & not ER” masks (Supp. Fig. 3). In contrast, the contact sites identified by MCS-DETECT exhibited 100% colocalization with the 3D STED mito-ER COLOC mask (Figure 4B), demonstrating a high specificity for MERCs.

Subcellular Localizations of SPLICSL probe and Contact Sites Identified by MCS-DETECT. (A) 3D STED and confocal images of HeLa cells co-expressing RFP-KDEL (ER; green) and SPLICSL (cyan) were labelled with anti-RFP (ER; green) and anti-TOM20 (mitochondria; magenta). Contact site colocalization subgroups were determined based on colocalization in 2D STED slices: exclusive to mitochondria (mito only; light magenta), exclusive to ER (ER only; light green), colocalized with mitochondria-ER colocalization mask (Mito-ER COLOC; light yellow), localized with neither mitochondria nor ER (Not Mito & Not ER; blue). The extent of association of SPLICSL and MCS-DETECT with the localization subgroups in 3D STED slices is shown (Bar = 5 μm). (B) Quantification from 3D STED volumes of association with localization subgroups for SPLICSL and MCS-DETECT contact sites (averaged over cell, one-way ANOVA, n = 3 independent biological replicates, ≥10 cells per experiment, ****P < 0.0001). (C) 2D Confocal images showing association with localization subgroups for SPLICSL. (D) Quantification from confocal images areas of association with localization subgroups for SPLICSL (averaged over cell, one-way ANOVA, n = 3 independent biological replicates, ≥10 cells per experiment, ****P < 0.0001).
In order to determine whether super-resolution imaging was required to detect the reduced association of the SPLICSL mask with the mito-ER COLOC mask, we analyzed 2D diffraction limited confocal images. Binary masks were generated from 2D confocal images of the SPLICSL, mitochondria and ER channels, that had been acquired in conjunction with the 3D STED images. The SPLICSL channel showed enriched colocalization with the ER-mito mask (Figure 4C, D); SPLICSL association with the “Mito only” mask was not significantly different from its association with the “ER only” or “not Mito & not ER” masks (Figure 4C). This suggests that the subset of SPLICSL localized to mitochondria can only be detected by super-resolution microscopy.
To better assess the relationship between contact sites detected by MCS-DETECT and SPLICSL with mitochondria, we generated 3D STED volume-rendered views of isolated mitochondria. MCS-DETECT puncta associated with sites of interaction between ER and mitochondria. SPLICSL puncta were not as clearly associated with regions of ER-mitochondria overlap and, in some cases, appeared to be completely encapsulated by mitochondria (Figure 5, S1 and S2 Movies).

3D STED reveals mitochondrial localization of SPLICSL probe. Volume-rendered views of HeLa cells transfected with RFP-KDEL and SPLICSL (Cyan), labelled with anti-RFP (ER; Green) and anti-TOM20 (Mitochondria; magenta), with contact cites identified by MCS-DETECT (White). Rotated views of the ROIs are shown volume-rendered in panels below. (Bar = 1 μm).
Discussion
Current approaches in studying membrane contact sites face challenges to find detection methods which allow simultaneously for high spatial and temporal resolution, while still enabling specific labelling of proteins and molecules of interest. EM has been a crucial player in contact site research, being the earliest method by which MCS were discovered (Bernhard and Rouiller, 1956). Recent advances in FIB-SEM high resolution 3D volume imaging and AI-aided segmentation have allowed for analysis of organelle interactions in these datasets (Heinrich et al., 2021; Xu et al., 2021), Live-cell 2D confocal microscopy of mitochondria and ER in the cell periphery has previously been used to great effect in studying MERC-associated mitochondrial fission (Friedman et al., 2011). The involvement of MERCs in mitochondria division has further been validated with 2D live cell super-resolution SMLM and STED (Shim et al., 2012; Bottanelli et al., 2016; Obara et al., 2024). Contact site detection from 3D super-resolution image volumes has been reported using MCS-DETECT, an algorithm which is capable of identifying contact sites in 3D super-resolution image volumes (Nabi et al., 2024).
In addition to the advent of super-resolution microscopy techniques, contact site studies have also benefited from the development of novel fluorescent probes, with the aims of reducing perturbations to physiological contacts and being better able to observe contact site dynamics. The SPLICS probe used in this study was initially developed as a split-GFP construct expressed in separate plasmids to identify mitochondria-ER contacts, with two different possible spacer lengths to aid in differentiating short and long-range MERC interactions (Cieri et al., 2018). Shortly after, the technique was improved to express both moieties within the same construct, allowing for improved ease of transfection and equimolar expression. Other constructs have also been created with different targeting sequences to enable detection of contact sites between other organelles including the plasma membrane and peroxisomes in combination with the previously targeted ER and mitochondria (Vallese et al., 2020). SPLICS has since been used in a number of different studies, including the role of MERCs in SARS-CoV-2 (Poggio et al., 2023), in neuronal function (Maddison et al., 2023), and lysosome-mitochondria contacts in autophagy (Giamogante et al., 2024). However, these studies all rely on diffraction-limited confocal microscopy in their analysis of membrane contact sites, with comparatively few instances where super-resolution modalities were applied (Grossmann et al., 2023). The bi-complementation approach to assess inter-organelle contact sites has led to the development of a toolkit to assess interaction between diverse organelles (Miner et al., 2024).
Concerns about bi-complementation approaches promoting the formation or stabilization of MERCs have been discussed (Scorrano et al., 2019). The impact of SPLICS, or other bi-complementation approaches, on organelle distribution and morphology could be related to expression levels of the probe, which we endeavoured to retain at low levels. Our data show that SPLICSL expression reduced mitochondrial area in HEK293 cells; in HeLa cells we did not detect a reduction in mitochondrial or ER volume but did observe changes in mitochondrial segment size which might be related to altered fusion or distribution of mitochondria in the cell. SPLICSL expression did not alter the extent of MERCs, as detected by MCS-DETECT, but did impact their distribution relative to the centroid of the distribution of the channel label. Altogether, our data suggests that SPLICSL expression can affect, in a cell line-dependent manner, the morphology, distribution and expression of MERCs and mitochondria.
Further, the SPLICSL probe localized to mitochondria in regions absent of ER labelling, appearing to be inside mitochondria from 3D STED image volumes (Figures 4 and 5). This “Mito only” subgroup of SPLICSL occurs at similar intensity to the Mito-ER COLOC mask and at significantly higher frequency compared to the “ER only” and “Not Mito & Not ER” groups and thus cannot be attributed to noise or other imaging artifacts. By confocal microscopy, the SPLICSL probe associated predominantly with the mito-ER COLOC mask, highlighting the necessity of using super-resolution microscopy to detect this aberrant localization.
The basis for SPLICSL localization to mitochondria is not clear. Fluorescent detection of split-GFP should necessarily be due to complementation of mitochondria-targeted GFP-S1-10 with the GFP-S11 chain derived from the ER localized component of SPLICSL. This suggests that both the OMM-GFP1−10 and ER-Long β11 components of SPLICL have entered mitochondria and recombined within the mitochondrial matrix. The basis for mitochondrial import of ER-Long β11ER-SPLICS is not clear. Overexpression of SPLICSL components might lead to their aggregation in the cytosol and the reconstitution of GFP within such aggregates. Cytosolic aggregates have been reported to enter mitochondria in yeast to prevent cytosolic cytotoxicity (Ruan et al., 2017).
In our study, we demonstrate the high specificity of MCS-DETECT to detect MERCs in 3D STED image volumes. Validation of MCS-DETECT was originally based on comparison of cells that differentially expressed a distinct class of MERCs, ribosome-studded riboMERCs (Cardoen et al., 2024). In HeLa cells, MERCs are detected by MCS-DETECT at a similar order of magnitude to that reported by FIB-SEM (Table 1) (Heinrich et al., 2021), however the extent to which they correspond to real MERCs remains to be determined. Use of EM as ground truth for MCS detection and application of correlative light-EM (CLEM) (de Boer et al., 2015) approaches, preferably based on super-resolution microscopy could be used to validate individual contact sites. Application of weakly supervised AI approaches (Nabi et al., 2024) to cells known to exhibit differential MCS detection may identify classes of MERCs other than riboMERCs (Nabi et al., 2024) as well as contribute to identification and characterization of contacts between other organelles. Application of MCS-DETECT to different 2D and 3D imaging modalities other than 3D STED, including confocal, two-photon and other super-resolution imaging modalities, to live-cell datasets, including multi-organelle labeled cells (Valm et al., 2017), as well as to cells grown in 3D culture or in tissues ex vivo represent promising avenues of future research.
Materials and Methods
Cell Culture
HeLa cells were maintained in a 37°C incubator with 5% CO2 atmosphere in complete DMEM (Thermo Fischer Scientific, USA) containing 10% FBS (Thermo Fischer Scientific, USA) and 1% L-Glutamine (Thermo Fischer Scientific, USA). Twenty-four hours before transfection, cells were seeded at 60% to 80% confluency onto #1.5H coverslips (Paul Marienfeld, Germany). Transfections were carried out using Effectene (Qiagen, Germany) according to the manufacturer's protocol for 22 h, with 540 ng of SPLICSL or pcDNA and 26 ng of RFP-KDEL plasmid in each well of a 6 well plate.
Antibodies and Reagents
SPLICS Mt-ER Long P2A was a gift from Marisa Brini and Tito Calì (Addgene plasmid # 164107). RFP-KDEL was a gift from Nicolas Demaurex (Addgene plasmid # 114177). Goat serum (Cat# 16210-064) was purchased from Thermo Fisher Scientific (USA). Bovine serum albumin (BSA; Cat# A9418) was purchased from Sigma (USA). Mouse monoclonal antibody to TOM20 (Cat# ab56783) and rabbit polyclonal antibody to RFP (Cat# ab124754) were purchased from Abcam (Cambridge, MA, USA). Alexa Fluor 532 conjugated goat anti-mouse (Cat# A11002) and Alexa Fluor 568 conjugated goat anti-rabbit (Cat# A11036) were purchased from Thermo Fisher Scientific (USA). 16% paraformaldehyde (Cat# 15710) and 25% glutaraldehyde (Cat# 16220) were purchased from Electron Microscopy Sciences (Hatfield, PA, USA).
Labelling Mitochondria and ER
Immunofluorescence labelling was carried out using procedures previous described (Gao et al., 2019; Nabi et al., 2024). Cells were fixed with 3% paraformaldehyde and 0.2% glutaraldehyde for 15 min at room temperature, washed with PBS-CM (phosphate-buffered saline solution with 1 mM CaCl2 and 10 mM MgCl2) and permeabilized with 0.2% Triton X-100 for 5 min. After washing with PBS-CM, cells were quenched with 1 mg/mL NaBH4 for 10 min, again washed with PBS-CM and blocked with 10% goat serum and 1% BSA for 1 h at room temperature. Primary antibody labeling was performed in antibody buffer (2% goat serum, 1% BSA, 0.05% Triton X-100, 1X sodium/sodium citrate (SSC) buffer in Milli-Q H2O) overnight at 4°C, after which the cells were washed three times for 5 min with antibody wash buffer (1× SSC, 0.05% Triton X-100 in Milli-Q H2O) before incubation with secondary antibody in SSC antibody buffer for 1 h at room temperature. Cells were then washed six times for 10 min with antibody wash buffer on a rocker, rinsed with Milli-Q H2O, mounted with ProLong Diamond (Thermo Fisher) and cured for 24–48 h at room temperature before imaging.
Imaging
Confocal and 3D STED images were taken using a Leica TCS SP8-STED microscope (Leica, Wetzler, Germany) equipped with a white light laser using a 100X/1.40NA Oil HC PL APO CS2 objective, STED 592, 660 and 775 depletion lasers, HyD detectors, an environmental chamber and Leica Application Suite X (LAS X) software. Time gating was used to improve lateral resolution of fluorescence detection. SPLICSL was excited at 488 nm and depleted with the 592 nm depletion laser. Alexa-Fluor 532 was excited at 528 nm and depleted with the 660 nm depletion laser. Alex-Fluor 568 was excited at 577 nm and depleted with the 660 nm depletion laser. Sequential acquisition of AF568, AF532 and then SPLICSL signal, in that order, between stacks (for 3D STED) or frames (for 2D confocal) was used to reduce crosstalk. STED images were deconvolved with Huygens Professional software (Scientific Volume Imaging, Netherlands) and cropped using ImageJ.
Image Analysis
MCS-DETECT algorithm was applied to the 3D STED image volumes using previously described protocols (Cardoen et al., 2024).
Link to repository: https://github.com/bencardoen/SubPrecisionContactDetection.jl.
Briefly, the MCS-DETECT algorithm first computes a correlation of intensity and Laplacian for both channels, then computes a confidence map of contact sites, and finally applies filters to remove artifacts. Filtered 3D STED images, including MCS-DETECT processed mitochondria, ER and contact site channels, were analyzed using ImageJ software to quantify channel volumes. ImageJ was used to generate binary masks of individual channels, then overlay masks between channels to quantify colocalization. For surface area coverage, ImageJ was used to generate outlines of mitochondria, then overlaid with masks of contact site channels to quantify overlap. Channel areas from confocal images were quantified using ImageJ with thresholds for signal detection set using the Otsu method for all channels, together with a minimum detected object size of 5 pixels. Two-tailed Student t-tests were used for comparison of mitochondria, ER and MCS-DETECT contact volumes. One-way ANOVA tests were used to compare MERC volumes and localization subgroups. Kolmogorov-Smirnov test was used to compare probability density curves of distance to centroids, as this non-parametric allows testing the hypothesis that two distributions are equal based on their density function, capturing shifts in distributions. Statistical analyses and graphs were generated with Microsoft Excel 2019 and GraphPad Prism. 3D image rendering was performed using Bitplane Imaris V10.0.
Supplemental Material
Supplemental Material
Supplemental Material
sj-tif-1-ctc-10.1177_25152564251313721 - Supplemental material for Comparative Analysis of SPLICS and MCS-DETECT for Detecting Mitochondria-ER Contact Sites (MERCs)
Supplemental material, sj-tif-1-ctc-10.1177_25152564251313721 for Comparative Analysis of SPLICS and MCS-DETECT for Detecting Mitochondria-ER Contact Sites (MERCs) by Jieyi Zheng, Ben Cardoen, Milene Ortiz-Silva, Ghassan Hamarneh and Ivan R. Nabi in Contact
Supplemental Material
sj-tif-2-ctc-10.1177_25152564251313721 - Supplemental material for Comparative Analysis of SPLICS and MCS-DETECT for Detecting Mitochondria-ER Contact Sites (MERCs)
Supplemental material, sj-tif-2-ctc-10.1177_25152564251313721 for Comparative Analysis of SPLICS and MCS-DETECT for Detecting Mitochondria-ER Contact Sites (MERCs) by Jieyi Zheng, Ben Cardoen, Milene Ortiz-Silva, Ghassan Hamarneh and Ivan R. Nabi in Contact
Supplemental Material
sj-tif-3-ctc-10.1177_25152564251313721 - Supplemental material for Comparative Analysis of SPLICS and MCS-DETECT for Detecting Mitochondria-ER Contact Sites (MERCs)
Supplemental material, sj-tif-3-ctc-10.1177_25152564251313721 for Comparative Analysis of SPLICS and MCS-DETECT for Detecting Mitochondria-ER Contact Sites (MERCs) by Jieyi Zheng, Ben Cardoen, Milene Ortiz-Silva, Ghassan Hamarneh and Ivan R. Nabi in Contact
Supplemental Material
sj-docx-4-ctc-10.1177_25152564251313721 - Supplemental material for Comparative Analysis of SPLICS and MCS-DETECT for Detecting Mitochondria-ER Contact Sites (MERCs)
Supplemental material, sj-docx-4-ctc-10.1177_25152564251313721 for Comparative Analysis of SPLICS and MCS-DETECT for Detecting Mitochondria-ER Contact Sites (MERCs) by Jieyi Zheng, Ben Cardoen, Milene Ortiz-Silva, Ghassan Hamarneh and Ivan R. Nabi in Contact
Footnotes
Acknowledgements
Supported by CIHR Project grant AWD-022443.
Declaration of Conflicting Interests
The authors declared no potential conflicts of interest with respect to the research, authorship, and/or publication of this article.
Funding
The authors disclosed receipt of the following financial support for the research, authorship, and/or publication of this article: This work was supported by the Natural Sciences and Engineering Research Council of Canada, Canadian Institutes of Health Research, (grant number RGPIN-2019-05179, RGPIN-2020-06752, AWD-022443).
Supplemental Material
Supplemental material for this article is available online.
References
Supplementary Material
Please find the following supplemental material available below.
For Open Access articles published under a Creative Commons License, all supplemental material carries the same license as the article it is associated with.
For non-Open Access articles published, all supplemental material carries a non-exclusive license, and permission requests for re-use of supplemental material or any part of supplemental material shall be sent directly to the copyright owner as specified in the copyright notice associated with the article.