
Abstract
Alterations of endoplasmic reticulum (ER)-mitochondrial interaction have been associated with different pathological conditions, including neurodegenerative diseases, characterized by dysregulation of protein homeostasis. However, little is known about how enhanced ER-mitochondrial tethering affects cellular proteostatic machinery. Here, we transiently overexpressed synthetic ER-mitochondrial linkers (EMLs), stabilizing the ER-mitochondrial distance at ≤5 nm (denominated as 5 nm-EML) and ∼10 nm (10 nm-EML), in HeLa cells. No alterations were found in cell growth, although metabolic activity and total ATP were significantly reduced. In EML-expressing cells, global protein synthesis was significantly reduced, accompanied by a reduction of total PERK and eIF2α protein levels, but increased p-eIF2α. Unfolded protein response (UPR) markers ATF4 and ATF6 were upregulated, suggesting that enhanced ER-mitochondrial tethering deranges protein synthesis and induces a low-grade ER stress/UPR. To further investigate ER-mitochondrial tethering-induced protein dyshomeostasis, we performed shotgun mass spectrometry proteomics followed by bioinformatic analysis. Analysis of highly changed proteins and the most significantly overrepresented gene ontology (GO) terms revealed that ≤5 nm tethering preferentially affected the expression of proteins involved in RNA processing and splicing and proteasomal protein degradation, while ∼10 nm tethering preferentially affected protein translation. Both EMLs affected expression of proteins involved in mitochondrial bioenergetics and metabolism, defense against oxidative stress, ER protein homeostasis, signaling and secretion. Finally, lipidomic analysis suggests that 5 nm-EML and 10 nm-EML differentially affect lipid homeostasis. Altogether, our results suggest that enhanced ER-mitochondrial tethering leads to a profound remodeling of cellular protein homeostasis, which may play a key role in pathogenesis of Alzheimer's and other neurodegenerative diseases.
Introduction
Alterations of mitochondria-ER contact sites (MERCS) (Csordás et al., 2018; Scorrano et al., 2019) emerged as possible key factors in the pathogenesis of many disease conditions including cancer, metabolic and cardiovascular disorders, neurological and neurodegenerative diseases (Paillusson et al., 2016; Area-Gomez and Schon, 2017; Joseph et al., 2019; Erustes et al., 2022; Li et al., 2022; Liu et al., 2023; An et al., 2024; Jiang et al., 2024; Sathyamurthy et al., 2024). Representing a hub of interaction between endoplasmic reticulum (ER) and mitochondria, MERCS host and coordinate processes such as phospholipid biogenesis, Ca2+ homeostasis and mitochondrial bioenergetics, apoptosis, autophagosome formation and ribosomal protein synthesis (van Vliet et al., 2014; Csordás et al., 2018; Barazzuol et al., 2021; Voeltz et al., 2024). In neurodegenerative diseases, such as amyotrophic lateral sclerosis (ALS), Parkinson's (PD), and Alzheimer's diseases (AD), dysregulation of ER-mitochondrial communication has been documented and has been suggested as a novel target for therapeutic intervention (Paillusson et al., 2016; Area-Gomez and Schon, 2017; Lim et al., 2021; Dentoni et al., 2022). Attempts to modulate ER-mitochondria contacts in normal and disease conditions suggest that normalization of the interaction between these two organelles may indeed represent a promising approach (Basso et al., 2018; Garrido-Maraver et al., 2020; Gӧbel et al., 2020, 2021, 2022, 2023, 2024, 2025). However, negative effects of a forced ER-mitochondria linking have also been described (Tapella et al., 2022).
Due to aberrant protein processing and accumulation of pathogenic protein species, neurodegenerative diseases present intrinsic dysregulation of protein homeostasis, including RNA processing and trafficking, ribosomal protein synthesis, post-translational modifications, autophagic and proteasomal degradation, and adaptive proteostatic mechanisms such as ER stress/unfolded protein response (UPR) (Ding et al., 2005; Alkallas et al., 2017; Boehringer and Bowser, 2018; Gerakis and Hetz, 2018; Thibaudeau et al., 2018; Hsieh et al., 2019; Zuniga et al., 2023). In AD, reports suggest an enhanced ER-mitochondria interaction, linked to a deficient ER-mitochondrial Ca2+ transfer, to aberrant localization of γ-secretase components and proteolytic products of amyloid precursor protein (APP), and to increased cholesterol and phospholipid synthesis due to possible localization of ApoE4 at MERCS (Hedskog et al., 2013; Paillusson et al., 2016; Area-Gomez and Schon, 2017; Lim et al., 2021). Recently, we suggested that, in AD astrocytes, alterations of mitochondrial Ca2+ handling and bioenergetics, activation of a low-grade ER stress/UPR, dysregulation of protein synthesis and degradation may be linked to enhanced ER-mitochondrial tethering (Rocchio et al., 2019; Dematteis et al., 2020; Tapella et al., 2022; Gong et al., 2023). However, knowledge about relationships between the strength of the ER-mitochondrial interaction and protein homeostasis remains uncomplete.
In this contribution we employed previously reported synthetic ER-mitochondrial linkers (Csordás et al., 2006, 2010), transiently overexpressed in HeLa, a cell line widely used for investigation of basic (patho)mechanisms of cell biology, including neurodegeneration and MERCS functions (Calì et al., 2012; Filadi et al., 2018). Using this system, we show that enhanced ER-mitochondrial tethering results in dramatic remodeling of many aspects of protein homeostasis, including RNA processing, protein translation, post-translational protein modifications, ER and proteasomal degradation.
Results
Forced ER-Mitochondria Tethering at 5 or 10 nm Alters Global Protein Synthesis and Induces Low-Grade ER Stress/UPR
Synthetic linkers which have been employed in this work (kind gift of Gyorgy Hajnoczky from Jefferson University, US) are composed of a monomeric red fluorescent protein (RFP) flanked by flexible spacers and by targeting sequences for the cytosolic sides of outer mitochondrial membrane (OMM) (AKAP) and ER (UBC6). A shorter linker is estimated to maintain a distance of ≤5 nm between the membranes (Csordás et al., 2006, 2010) and is referred to as 5 nm-EML. In the second linker, the spacers were extended to span the distance of ≤10–12 nm, referred to as 10 nm-EML. Control samples were transfected either with empty pcDNA3.1 vector and/or with an ER-targeted RFP (ER-RFP). Overexpression of both 5 nm-EML and 10 nm-EML did not affect cell viability and proliferation (Figure 1A), however, total cellular ATP (Figure 1B) and the activity of metabolic enzymes were significantly reduced compared with HeLa cells expressing control ER-RFP plasmid (Figure 1C). No difference was found between pcDNA3.1 and ER-RFP-expressing cells.

Effect of 5 nm-EML and 10 nm-EML overexpression on cell viability, ATP, metabolic activity and global protein synthesis. (A) crystal violet cell viability assay. (B) ATPlite, total cell ATP content assay. (C) MTT metabolic activity assay. (D) SUnSET puromycin incorporation assay. Data are shown as mean ± SEM of 3–4 independent experiments. One-way ANOVA with Tukey post-hoc test. ** p < 0.01; *** p < 0.001.
Previously, we suggested that in immortalized hippocampal astrocytes from 3xTg-AD mice, alteration of protein synthesis was associated with an increased ER-mitochondrial interaction, in particular, overexpression of 10 nm-EML resulted in a decrease of global protein synthesis rate (Tapella et al., 2022). We investigated if this was the case also for EMLs-overexpressing HeLa cells, and, therefore, could represent a general mechanism. While no difference was found between pcDNA3.1 and ER-RFP-expressing cells, overexpression of both 5 nm-EML and 10 nm-EML for 48 h resulted in a significant inhibition of puromycin incorporation in neo-synthesized peptides, indicative of the reduction of global protein synthesis (Figure 1D). Next, we checked if this effect was linked to an increased phosphorylation of PERK and eIF2α, responsible for global protein synthesis shutdown during stress conditions (Pakos-Zebrucka et al., 2016; Hetz et al., 2020). We found that the level of total PERK and eIF2α proteins were significantly downregulated at 48 h post-transfection (Figure 2A). While p-PERK was not detected (not shown), p-eIF2α was expressed at detectable level and the ratio of p-eIF2α to total protein tended to increase, specifically in 5 nm-EML-expressing cells. Interestingly, the expression of the eIF2α scaffold protein phosphatase GADD34 was increased (Figure 2A).

Effect of ER-mitochondrial linkers on ER stress/UPR. (A) Representative bands and quantification of Western blot analysis of HeLa cells, expressing empty plasmid (pcDNA3.1), ER-RFP, 5 nm-EML or 10 nm-EML. Data are expressed as mean ± SD of 3–6 independent experiments. One-way ANOVA with Tukey post-hoc test. * p < 0.05; ** p < 0.01; *** p < 0.001. (B) Real-time PCR analysis of ER-stress/UPR-related genes ATF4, ATF6, HERP and XBP1s. Data are expressed as mean ± SEM of 3–4 independent experiments performed in triplicate. One-way ANOVA with Tukey post-hoc test. * p < 0.05; ** p < 0.01; *** p < 0.001.
Quantitative real-time PCR (qPCR) of UPR-inducible genes, namely ATF4, XBP1s and ATF6, showed significant upregulation, although in an EML-specific manner. Overexpression of 5 nm-EML resulted in upregulation of ATF6 (downstream of ATF6 arm) and a short splice variant of XBP1, XBP1s, downstream IRE1α arm. Instead, overexpression of 10 nm-EML resulted in upregulation of ATF4 (generally induced downstream PERK → p-eIF2α axis), ATF6 and HERP (HERPUD1, induced downstream of both ATF4 and ATF6) (Figure 2B). Altogether, these results are in line with the alterations found in AD astrocytes or in astrocytes overexpressing 10 nm-EML (Tapella et al., 2022).
Given that certain types of MERCS may host ribosomes (Giacomello and Pellegrini, 2016), we used transmission electron microscopy (TEM) to investigate relationships between 5- and 10 nm MERCS in EML-expressing cells and ribosomal localization. In control cells, rough ER-bound electron-dense structures, compatible with ribosomes, were located on the ER distant >20 nm from the OMM (Figure 3A). No ribosomes were found in MAMs (Mitochondria Associated Membranes) in 5 nm-EML or 10 nm-EML-expressing cells (Figure 3B, C).

Transmission electron microscopy analysis. (A) Control cells transfected with ER-RFP. (B) 5 nm-EML-transfected cells. (C) 10 nm-EML-transfected cells. Arrows indicate MERCS, numbers indicate the transversal distance between ER and mitochondria. Scale bar, 200 nm.
While the effect of MERCS remodeling on cellular proteostasis is likely to be multifaceted, we hypothesized that, at least in part, a reduction of ATP synthesis upon forced tethering at short distances may be linked to the reduction of protein synthesis rate. Recently, we demonstrated that forced tethering at 5 and 10 nm between ER and mitochondria dramatically reduces ER-mitochondrial Ca2+ transfer, mitochondrial Ca2+ uptake, oxidative phosphorylation and total cellular ATP (Dematteis et al., 2024). To test this hypothesis, we inhibited ATP synthase with oligomycin and assessed ATP production, protein synthesis rate and mitochondrial Ca2+ uptake. Both total cell ATP and global protein synthesis rate were significantly inhibited upon pretreatment with oligomycin (Figure 4A, B). However, oligomycin had no effect on mitochondrial Ca2+ uptake, assessed using 4mtD3cvp, a genetically encoded ratiometric Ca2+ probe targeted to the mitochondrial matrix (Palmer et al., 2006) (Figure 4C).
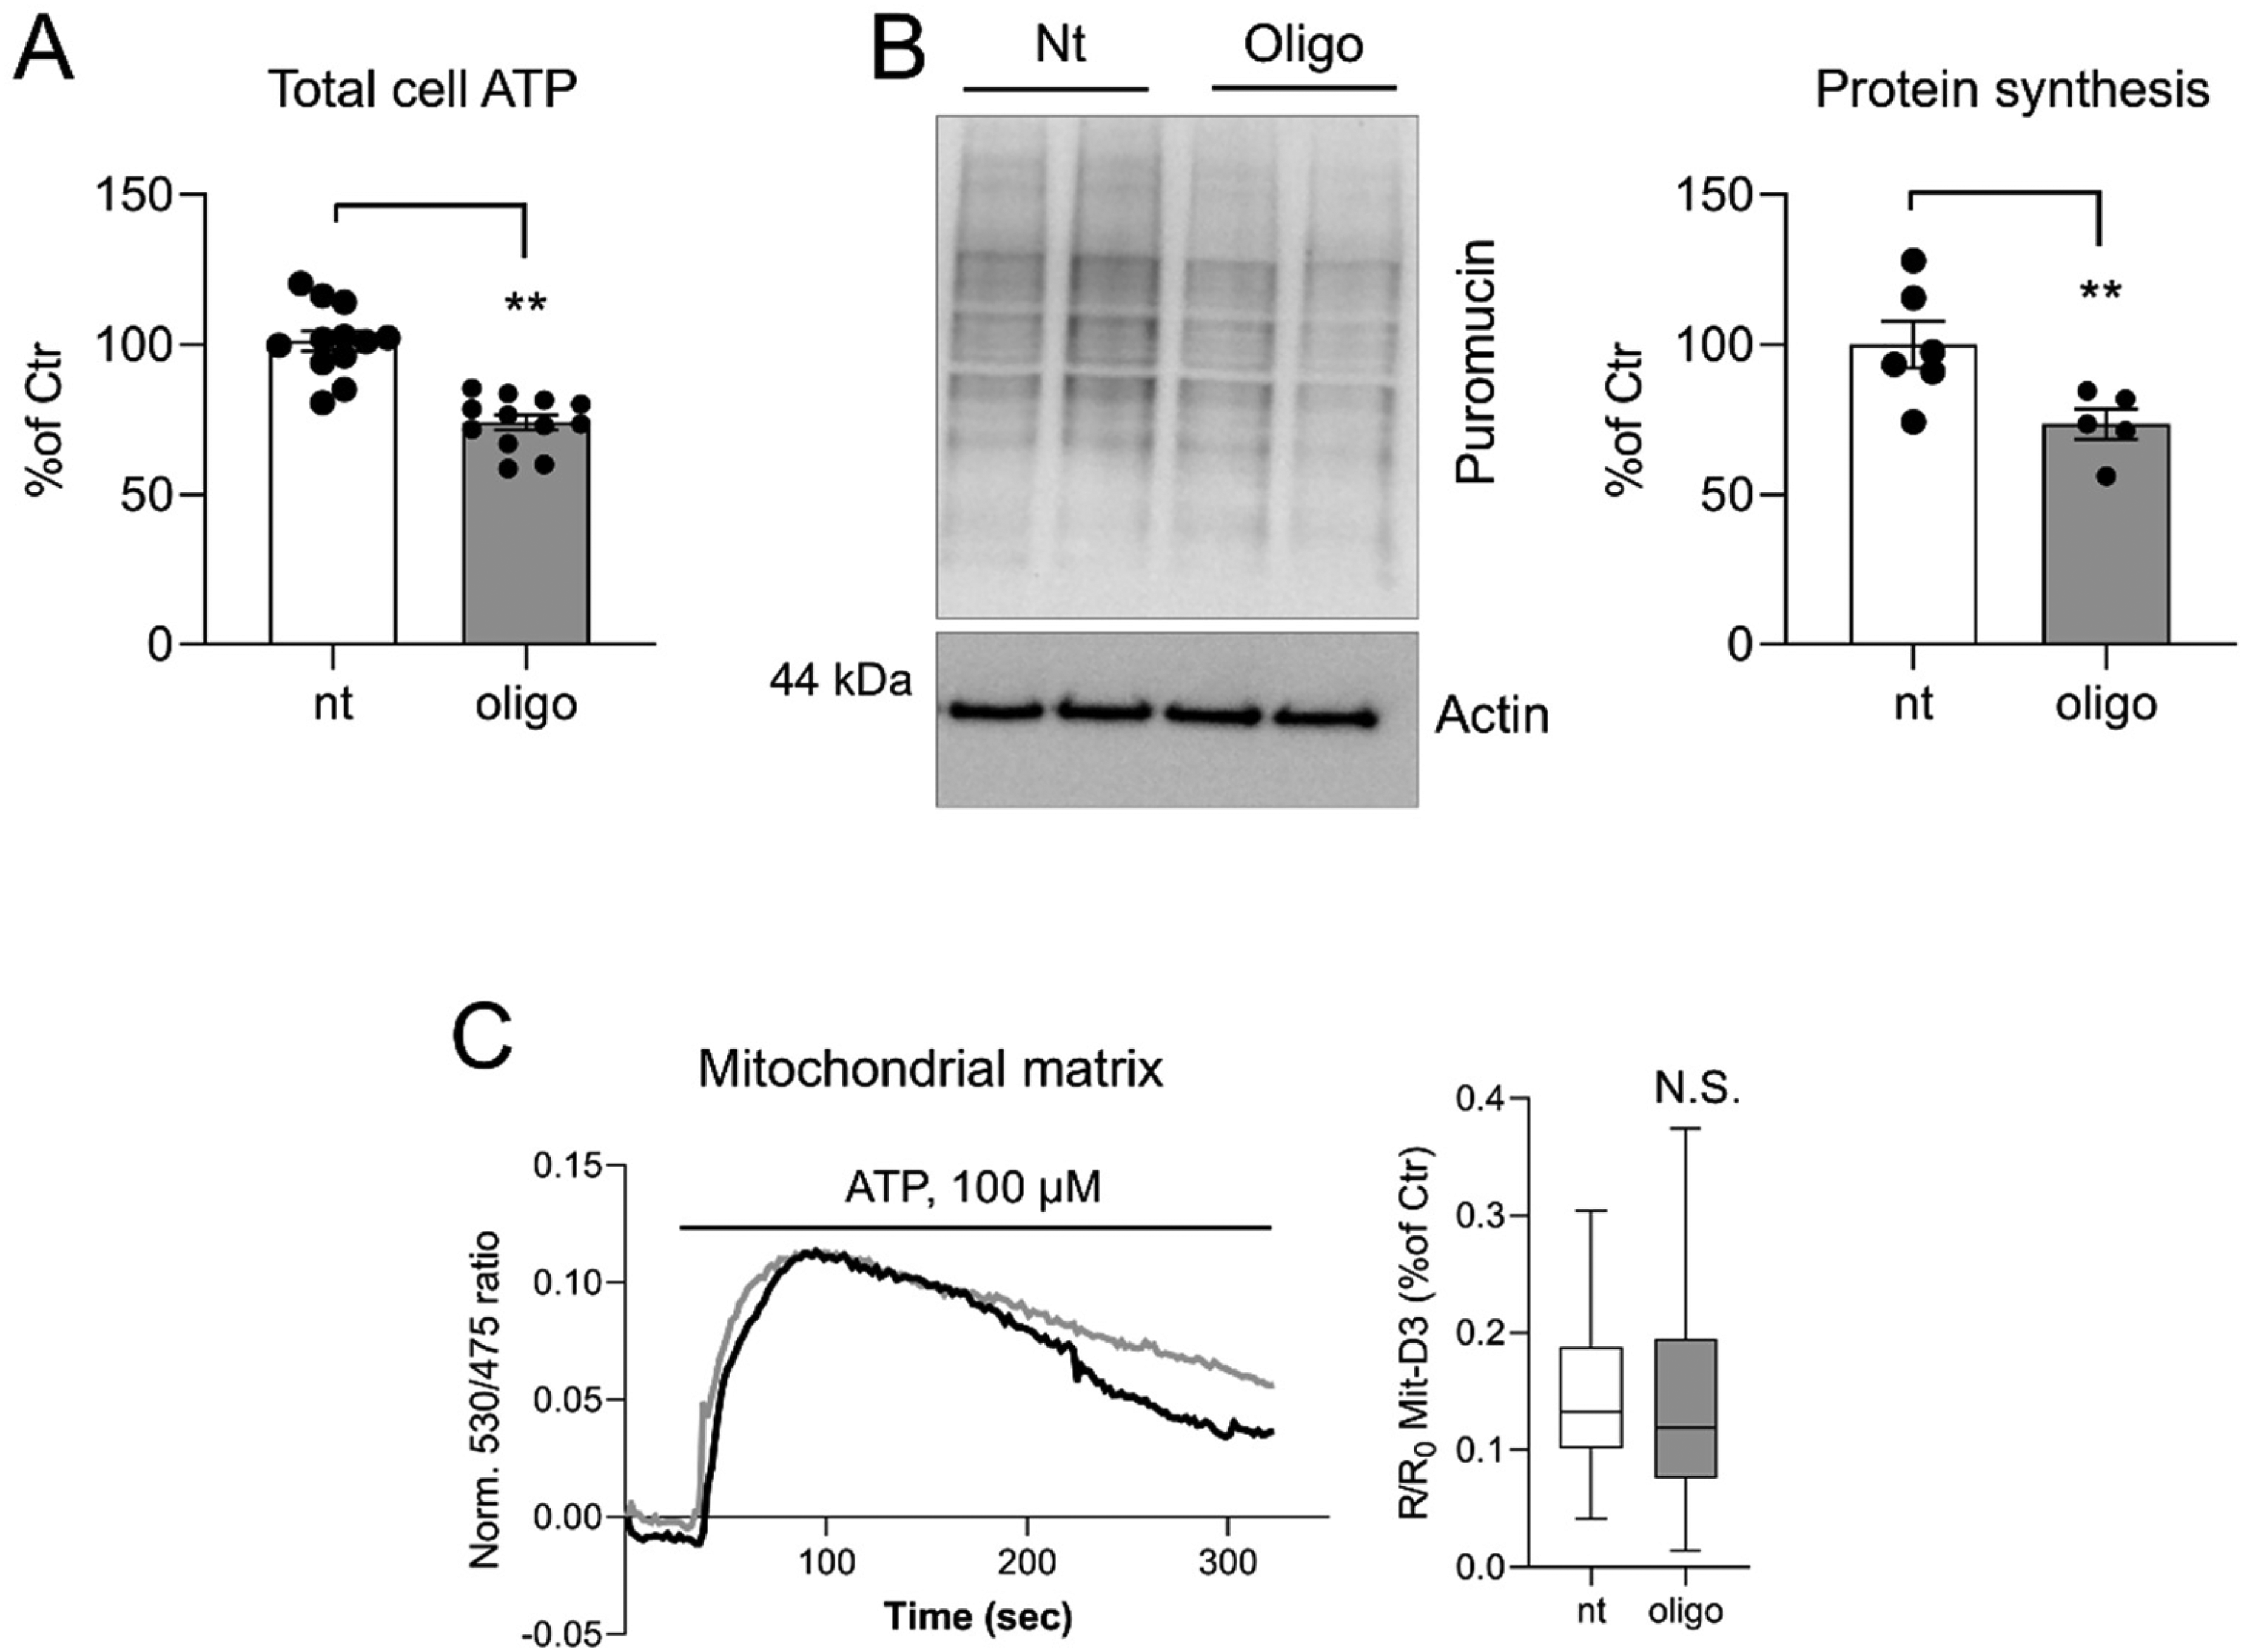
Oligomycin effects on total ATP, protein synthesis and mitochondrial Ca2+ uptake. (A) Total cell ATP detected using ATPlite assay. Data are shown as mean ± SEM from 4 independent experiments performed in triplicate. (D) SUnSET puromycin incorporation assay. Data are shown as mean ± SEM of 3–4 independent experiments. (C) Ca2+ traces and whisker plots of ATP-stimulated responses in the mitochondrial matrix detected using 4mtD3cpv probe. Data were analysed by two-tail unpaired Student's t-test. ** p < 0.01.
Mass Spectrometry Proteomic Analysis
To perform a comprehensive characterization of protein expression alterations in EML-expressing HeLa cells we run untargeted mass spectrometry proteomic analysis (Figure 5A). Three independent cultures were analysed for each of three conditions: HeLa expressing control ER-RFP construct, 5 nm-EML- and 10 nm-EML-expressing HeLa. A total number of 1415 proteins were identified and quantified in ER-RFP (Ctr), 5 nm-EML and 10 nm-EML-expressing cells, respectively (Supplemental Table 1). Of these, 251, 211 and 136 proteins were differentially expressed (DEPs) in 5 nm-vs-Ctr, 10 nm-vs-Ctr and 10 nm-vs-5 nm comparisons, respectively (p < 0.05; no fold change cut off). Applying a cut off of 30%-fold change, 183, 144 and 99 proteins were significantly changed (p < 0.05; cut off ± 1.3-fold change) in 5 nm-vs-Ctr, 10 nm-vs-Ctr and 10 nm-vs-5 nm subsets, respectively (Supplemental Table 2). Two proteins were chosen for validation: TIGAR, a fructose-2,6-bisphosphatase also known as TP53-Induced Glycolysis And Apoptosis Regulator is the most downregulated protein in 10 nm-EML dataset (fold change (FC) = −80.18, p. value (p.v.) = 0.00018), was also downregulated in 5 nm-EML dataset (FC = −1.23, p.v. = 0.0593); and GPX4, a mitochondrial phospholipid hydroperoxide glutathione peroxidase, downregulated in both datasets (FC = −4.23, p.v. = 0.0333 in 5 nm-EML; FC = −20, p.v. = 0.000017 in 10 nm-EML), which was of special interest as it represents a hub for protein-protein network in glutathione metabolism and antioxidant defense. Western blot analysis on independently generated HeLa cell transfectants confirmed the reduction of both proteins in both 5 nm-EML and 10 nm-EML samples (Figure 5B).

Mass spectrometry proteomic and bioinformatic workflow. (A) HeLa cells, transiently transfected with ER-RFP, 5 nm-EML or 10 nm-EML (3 dishes per condition) were lysed and subjected to shotgun mass spectrometry. (B) Validation of changes in protein expression by Western blot. Data are expressed as mean ± SEM from 3–4 independent experiments. ANOVA, followed by Dunnett’s post-hoc test. ** p < 0.01; *** p < 0.001. Differentially expressed proteins (DEPs) were subjected either to single protein location/functional analysis of highly (fold change ≥5) changed DEPs (C), or to Gene Ontology, Pathway and Network analysis of all significantly changed (p. value < 0.05) DEPs (D).
Different strategies were pursued to analyse the datasets: 1) analysis of single highly regulated proteins (Figure 5C) and 2) functional gene ontology, pathway and network analysis of all significantly changed proteins (Figure 5D). Gene ontology (GO) analysis further addressed functions of i) all proteins significantly changed in 5 nm-Ctr and 10 nm-vs-Ctr subsets; ii) commonly regulated DEPs; iii) DEPs present specifically either in 5 nm-vs-Ctr or in 10 nm-vs-Ctr subsets; and differential protein expression 10 nm-EML-expressing vs 5 nm-EML-expressing cells (10 nm-vs-5 nm comparison) (Figure 5D).
Functional Analysis of Highly Dysregulated Proteins
Selected highly dysregulated proteins may significantly impact specific aspects of cell biology and function. Therefore, we filtered protein with FC >±5 (p.v. < 0.05) in two subsets (5 nm-vs-Ctr and 10 nm-vs-Ctr) and, using GeneCards server (https://www.genecards.org/), retrieved information about their intracellular localization and function (Table 1). In 5 nm-vs-Ctr subset, 14 DEPs had FC >±5 (p.v. < 0.05) of which 9 DEPs were upregulated and 5 – downregulated. Expression of 11 DEPs (6 up- and 5 downregulated) changed ≥20 fold. In 10 nm-vs-Ctr subset, 26 DEPs had FC >±5 (p.v. < 0.05) of which 14 DEPs were upregulated and 12 – downregulated. Expression of 24 DEPs (12 up- and 12 downregulated) changed ≥20-fold. One protein, TIGAR (Fructose-2,6-bisphosphatase) was downregulated ≥80-fold. Strikingly, expression of 10 proteins (6 up- and 4 downregulated) (indicated by green background in Table 1, column “Function: Category”) was highly co-regulated in both 5 nm-vs-Ctr and 10 nm-vs-Ctr subsets. To make functional sense of the highly regulated DEPs, we divided them in 9 Functional Categories, according to their principal functions: Bioenergetics, Cell division, Metabolism, RNA processing (including splicing), Protein translation (ribosomal), Protein homeostasis (posttranscriptional modifications), Protein degradation and RedOx balance. Pie charts in Figure 6 show that the functions of proteins highly changed in 5 nm-vs-Ctr subset are limited to Bioenergetics, Cell division, RNA processing, Protein homeostasis and Signaling (Figure 6A). Functions of proteins highly changed in 10 nm-vs-Ctr subset included all nine categories (Figure 6B). 19% and 15% were represented by proteins involved, respectively, in Bioenergetics and Metabolism. Analysis of DEPs highly co-regulated in both 5 nm-vs-Ctr and 10 nm-vs-Ctr datasets showed that functions of commonly-regulated proteins strongly resemble those of 5 nm-vs-Ctr subset (Figure 6C). Significant co-regulation of DEPs in two data subsets suggests i) high quality and robustness of shotgun MS proteomics workflow, and ii) that increased ER-mitochondrial tethering with shortening of the ER-mitochondrial distance ≤5–10 nm results in a strong change in the expression of a subset of proteins. Furthermore, the analysis suggests that the stabilization of ER-mitochondrial interaction at about 10 nm produces a specific pattern of alterations including proteins involved in Metabolism, Protein translation on ribosome, Protein degradation via proteasome and proteins involved in maintenance of RedOx balance.

Functional analysis of highly changed differentially expressed proteins. Curated intracellular location/function analysis of highly changed DEPs (fold change ≥5) from the following comparisons: (A) 5 nm-vs-Ctr; (B) 10 nm-vs-Ctr, and (C) common highly changed DEPs in 5 nm-vs-Ctr and 10 nm-vs-Ctr comparisons. (D) STRING protein-protein network analysis of highly changed DEPs. The most overrepresented STRING clusters were Glutathione metabolism and detoxification of reactive oxygen species (red circles and box) and Deadenylation-dependent mRNA decay and cytoplasmic stress granule (blue circles and box). Overrepresented KEGG pathway was Glutathione metabolism (green circles and box).
Highly Changed Differentially Expressed Proteins (DEPs) with Fold Change (FC) ≥±5.

Colour legend: blue font, p. values and FC for 5 nm-vs-Ctr comparison; red font, p. values and FC for 10 nm-vs-Ctr comparison; red-light background, upregulated DEPs; green-light background, downregulated proteins. In “Cellular location” column: Nuc, nucleus; Cyt, cytoplasm; Mit, mitochondria; PM, plasma membrane; Peroxi, peroxisomes; Cytoskel, cytoskeleton; ER, endoplasmic reticulum.
Network analysis using STRING functional protein association tool (https://string-db.org/) (Szklarczyk et al., 2023) showed that a set of highly regulated proteins interact to each other with a protein-protein interaction (PPI) enrichment p-value = 3.71e-07, suggesting significantly more interactions than expected by chance. STRING identified two functional clusters: i) glutathione metabolism, and detoxification of reactive oxygen species; and ii) deadenylation-dependent mRNA decay, and cytoplasmic stress granule. The most significantly overrepresented KEGG pathway (Kyoto Encyclopedia of Genes and Genomes) was glutathione metabolism (Figure 6D).
Gene Ontology Analysis of Significantly Changed Proteins
Although single yet highly regulated proteins may produce significant impact on selected cellular functions and pathways, even small changes in large groups of proteins involved in a specific pathway may be responsible for global alterations of cellular physiology and functions. To identify such functions, we performed GO and pathway analysis using widely used online tools such as Database for Annotation, Visualization and Integrated Discovery (DAVID) Functional Annotation tool (https://david.ncifcrf.gov/home.jsp) (Huang et al., 2009; Sherman et al., 2022) and STRING tool. The pilot analysis showed that there is no qualitative difference in GO terms retrieved adopting either a 30%-fold change cut off, or using all significantly changed proteins independently of their level of regulation. However, in the second case (no cut off), the significance of Bonferroni multiple comparison test markedly increased. Therefore, to increase the power of bioinformatic analysis we used all significantly changed proteins independently of their fold change: 251 DEPs in 5 nm-vs-Ctr; 211 DEPs in 10 nm-vs-Ctr; and 136 DEPs emerged from 10 nm-vs-5 nm comparison.
First of all, we performed functional analysis of proteins present in 5 nm-vs-Ctr and 10 nm-vs-Ctr datasets (see scheme on Figure 5D-i). DAVID analysis of 251 DEPs in 5 nm-vs-Ctr dataset yielded 127 significantly overrepresented GO terms (Supplemental Figure 3A, B). Most overrepresented selected GO terms, from categories Biological Process include mRNA splicing, via spliceosome, proteasomal protein catabolic process, regulation of cellular amino acid metabolic process. Overrepresented KEGG pathways included proteasome, spliceosome, glutathione metabolism, nucleocytoplasmic transport, endosome, and neurodegenerative diseases amyotrophic lateral sclerosis, Huntington disease and prion disease (Table 2). Clustering of GO terms in functional clusters yielded 14 clusters with at least two significantly overrepresented GO terms. The GO term clusters with highest Enrichment score included proteins involved in i) SUMOylation and ubiquitination; ii) RNA binding and transport; iii) RNA splicing and processing; iv) nucleus, mitochondria, and secretory granule lumen-localized proteins; and v) proteasomal protein degradation (Supplemental Table 3B).
Gene Ontology Analysis of DEPs (P. Value < 0.05) in 5 nm-vs-Ctr Comparison.

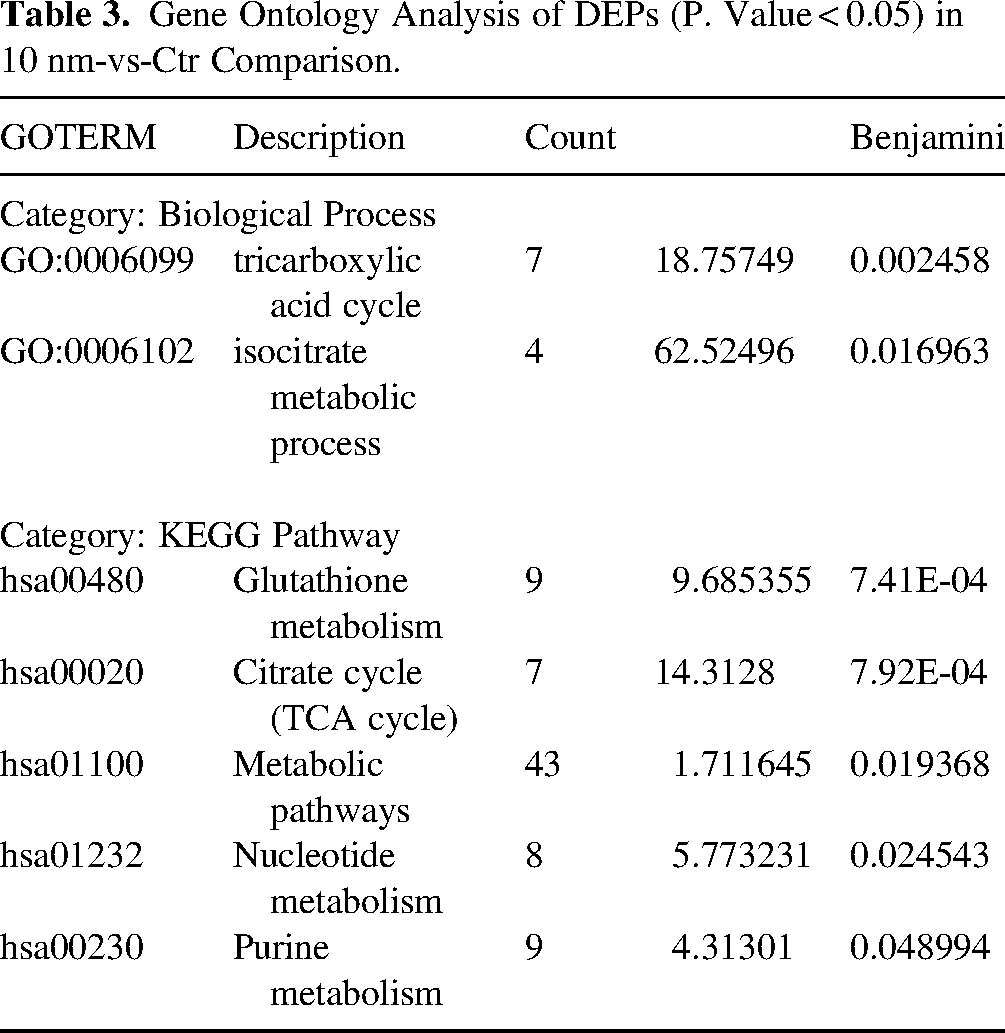
DAVID analysis of 10 nm-vs-Ctr dataset yielded 57 significantly overrepresented GO terms (Supplemental Table 4A). Overrepresented GO terms in Biological Process category, were tricarboxylic acid cycle and isocitrate metabolic process. Molecular Function category included RNA binding, protein binding and cadherin binding. KEGG pathways included glutathione metabolism, citrate cycle (TCA cycle), and metabolic pathways, the latter included 43 of 211 DEPs (Table 3). Functional clustering yielded 6 clusters which grouped proteins i) involved in SUMOylation and ubiquitination; ii) located in mitochondria or secretory granule lumen; iii) nucleotide- and ATP-binding proteins; iv) proteins of tricarboxylic acid (TCA) cycle; and v) proteins involved in protein biosynthesis and translation (Supplemental Table 4B).
Gene Ontology Analysis of DEPs (P. Value < 0.05) in 10 nm-vs-Ctr Comparison.
Analysis of Co-Regulated Proteins
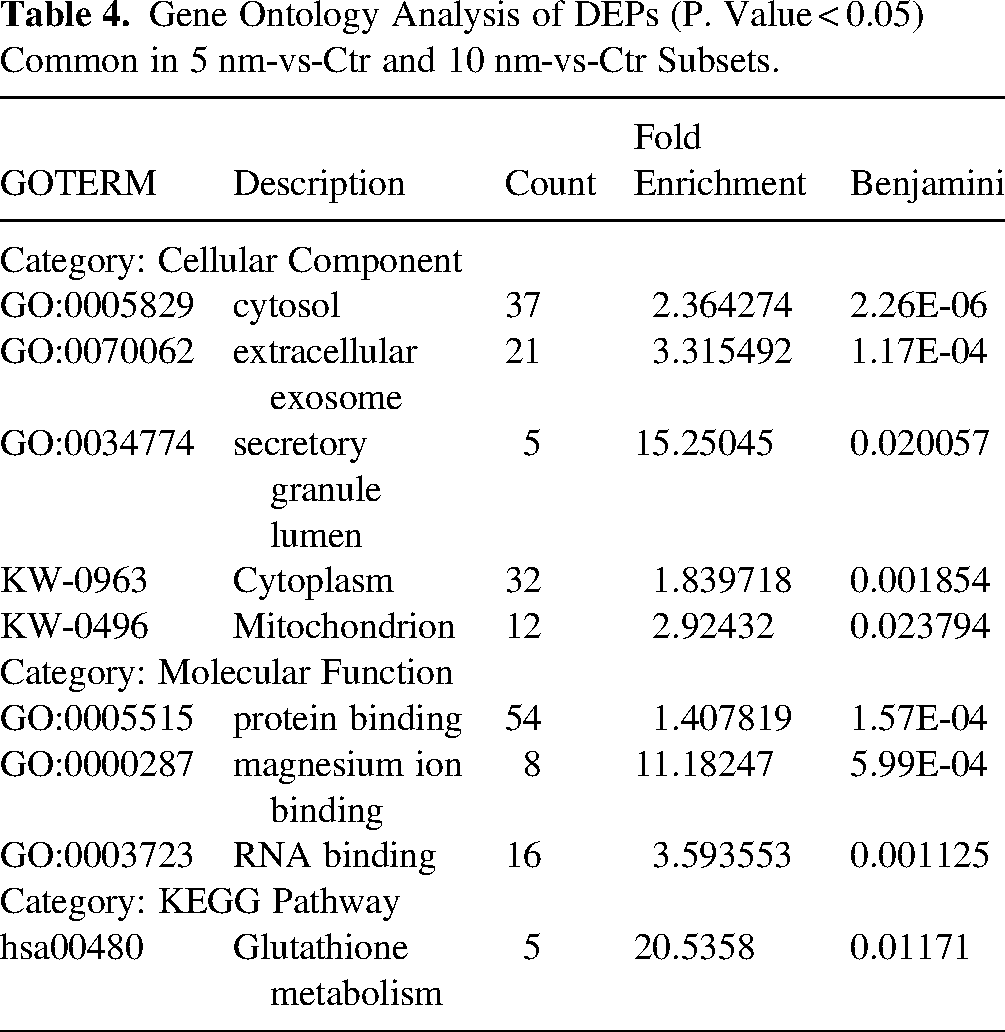
Next, given a high number of co-regulations, we analysed common proteins in 5 nm-vs-Ctr and 10 nm-vs-Ctr subsets (see scheme in Figure 5D-ii). Strikingly, of 65 common proteins, 60 were co-regulated with a high degree of co-regulation (R2 = 0.824) (Figure 7A, B, Supplemental Table 5). GO analysis of 60 co-regulated proteins using DAVID tool returned a limited number of significantly overrepresented GO terms which included secretory granule lumen, magnesium ion binding, RNA binding, Glutathione metabolism, mitochondrion and Ubl conjugation (Table 4, Supplemental Table 6A). Nevertheless, protein network analysis using STRING tool showed PPI enrichment p-value = 0.000979, indicating that network has significantly more interactions than expected by chance and suggesting that co-regulation of these proteins altogether may have a functional significance (Figure 7C). Several nodes in the network are represented by proteins changed ≥± 5-fold, as marked by colored circles (red – upregulated, blue – downregulated proteins), around proteins in Figure 7C, indicate that these highly regulated proteins might alter functions of other proteins in the network.

Analysis of co-regulated proteins in 5 nm-vs-Ctr and 10 nm-vs-Ctr comparisons. Correlation analysis of common DEPs in 5 nm-vs-Ctr and 10 nm-vs-Ctr subsets (A) shows a high degree of co-regulation (B). (C) STRING protein-protein network analysis of common DEPs in 5 nm-vs-Ctr and 10 nm-vs-Ctr subsets. Note that several nodes are represented by highly upregulated (red circles and box) or downregulated (blue circles and box) proteins (fold change ≥5).
Gene Ontology Analysis of DEPs (P. Value < 0.05) Common in 5 nm-vs-Ctr and 10 nm-vs-Ctr Subsets.
Analysis of DEPs Specific for 5 nm-vs-Ctr or 10 nm-vs-Ctr Datasets
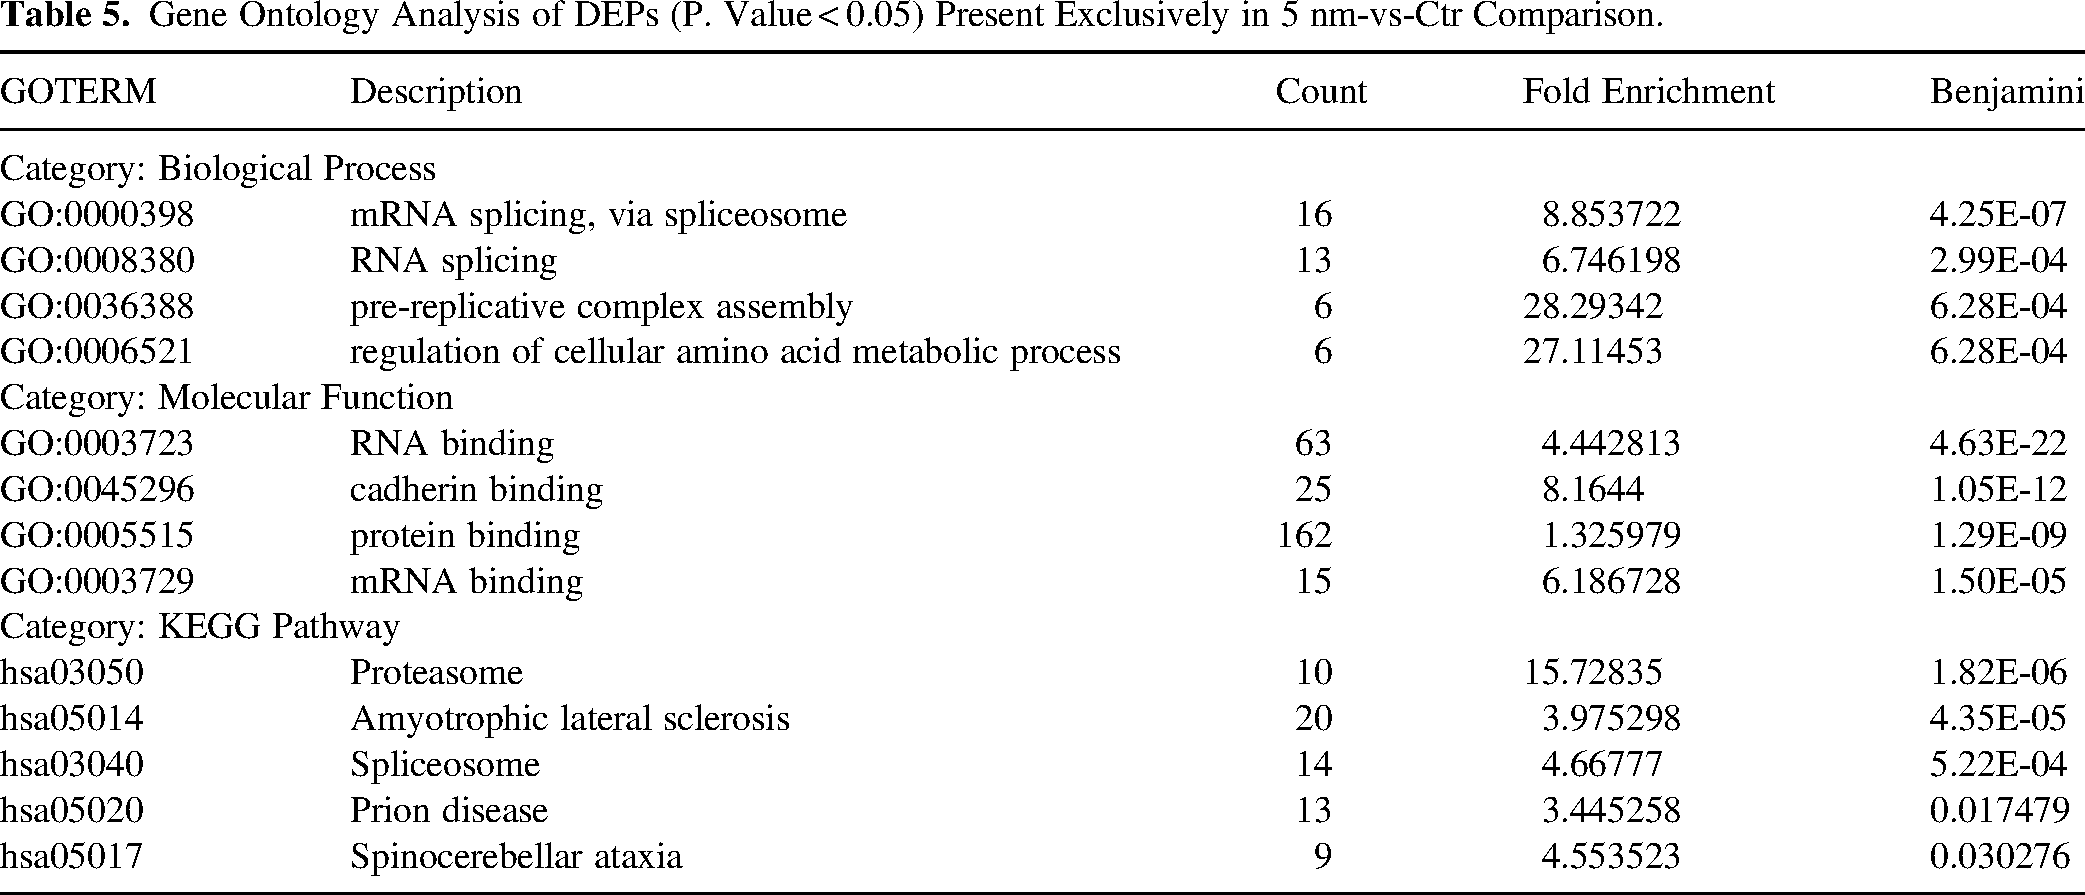
The above-presented analyses indicate that 5 nm-EML and 10 nm-EML-overexpressing HeLa cells display a significant overlap in both specific DEPs and functional clusters of proteins. To investigate, instead, whether there was a differential effect of 5 nm-EML vs 10 nm-EML on protein expression, we pursued two strategies of analysis. First, we analysed DEPs exclusively present either in 5 nm-vs-Ctr dataset (185 proteins, Supplemental Table 7A) or in 10 nm-vs-Ctr dataset (scheme on Figure 5D-iii) (146 proteins, Supplemental Table 7B). GO analysis of DEPs present exclusively in 5 nm-vs-Ctr subset yielded 173 significantly overrepresented GO terms, including the most significantly overrepresented such as mRNA splicing, via spliceosome, pre-replicative complex assembly, regulation of cellular amino acid metabolic process (Biologial Process). KEGG pathways included proteasome, spliceosome and neurodegenerative diseases amyotrophic lateral sclerosis, prion disease and spinocerebellar ataxia (Table 5). DAVID functional clustering yielded 13 clusters with proteins, located in the nucleus and the cytosol, involved in i) RNA binding, splicing and transport; ii) SUMOylation and ubiquitination; and iii) protein degradation via proteasome.
Gene Ontology Analysis of DEPs (P. Value < 0.05) Present Exclusively in 5 nm-vs-Ctr Comparison.
Analysis of DEPs present exclusively in 10 nm-vs-Ctr subset yielded 47 significantly overrepresented GO terms, of which the most overrepresented were Biological Processes translational initiation, protein folding, tricarboxylic acid cycle; Molecular Functions were RNA binding, protein binding, and ATP binding. No overrepresented KEGG pathways emerged. DAVID clustering yielded 5 clusters with the highest Enrichment score which grouped i) nucleotide- and ATP-binding proteins; ii) proteins involved in SUMOylation and ubiquitination; iii) in protein biosynthesis and translation initiation; iv) mitochondrial proteins involved in TCA cycle (Table 6).
Gene Ontology Analysis of DEPs (P. Value < 0.05) Present Exclusively in 10 nm-vs-Ctr Comparison.

Analysis of 10 nm-vs-5 nm Comparison
The second strategy consisted in comparison of quantified proteins between 10 nm-EML and 5 nm-EML-expressing HeLa cells (10 nm-vs-5 nm comparison). The comparison yielded 136 DEPs. Interestingly, most of these DEPs (93/136), were downregulated (expression in 10 nm-EML-expressing cells was significantly lower than in 5 nm-EML-expressors) (Supplemental Table 8). DAVID analysis yielded 46 significantly overrepresented GO terms, of which most overrepresented were Molecular Functions RNA binding, cadherin binding, protein binding, and mRNA binding. Database Interpro (https://www.ebi.ac.uk/interpro/) retrieved terms RNA recognition motif domain and Nucleotide-binding, alpha-beta plait (Table 7). DAVID clustering retrieved four clusters with the highest Enrichment score representing i) proteins involved in SUMOylation and ubiquitination; ii) RNA-binding proteins and ribonucleoproteins; iii) proteins involved in protein biosynthesis and initiation of translation. Alterations in protein expression are summarized in Figure 8.
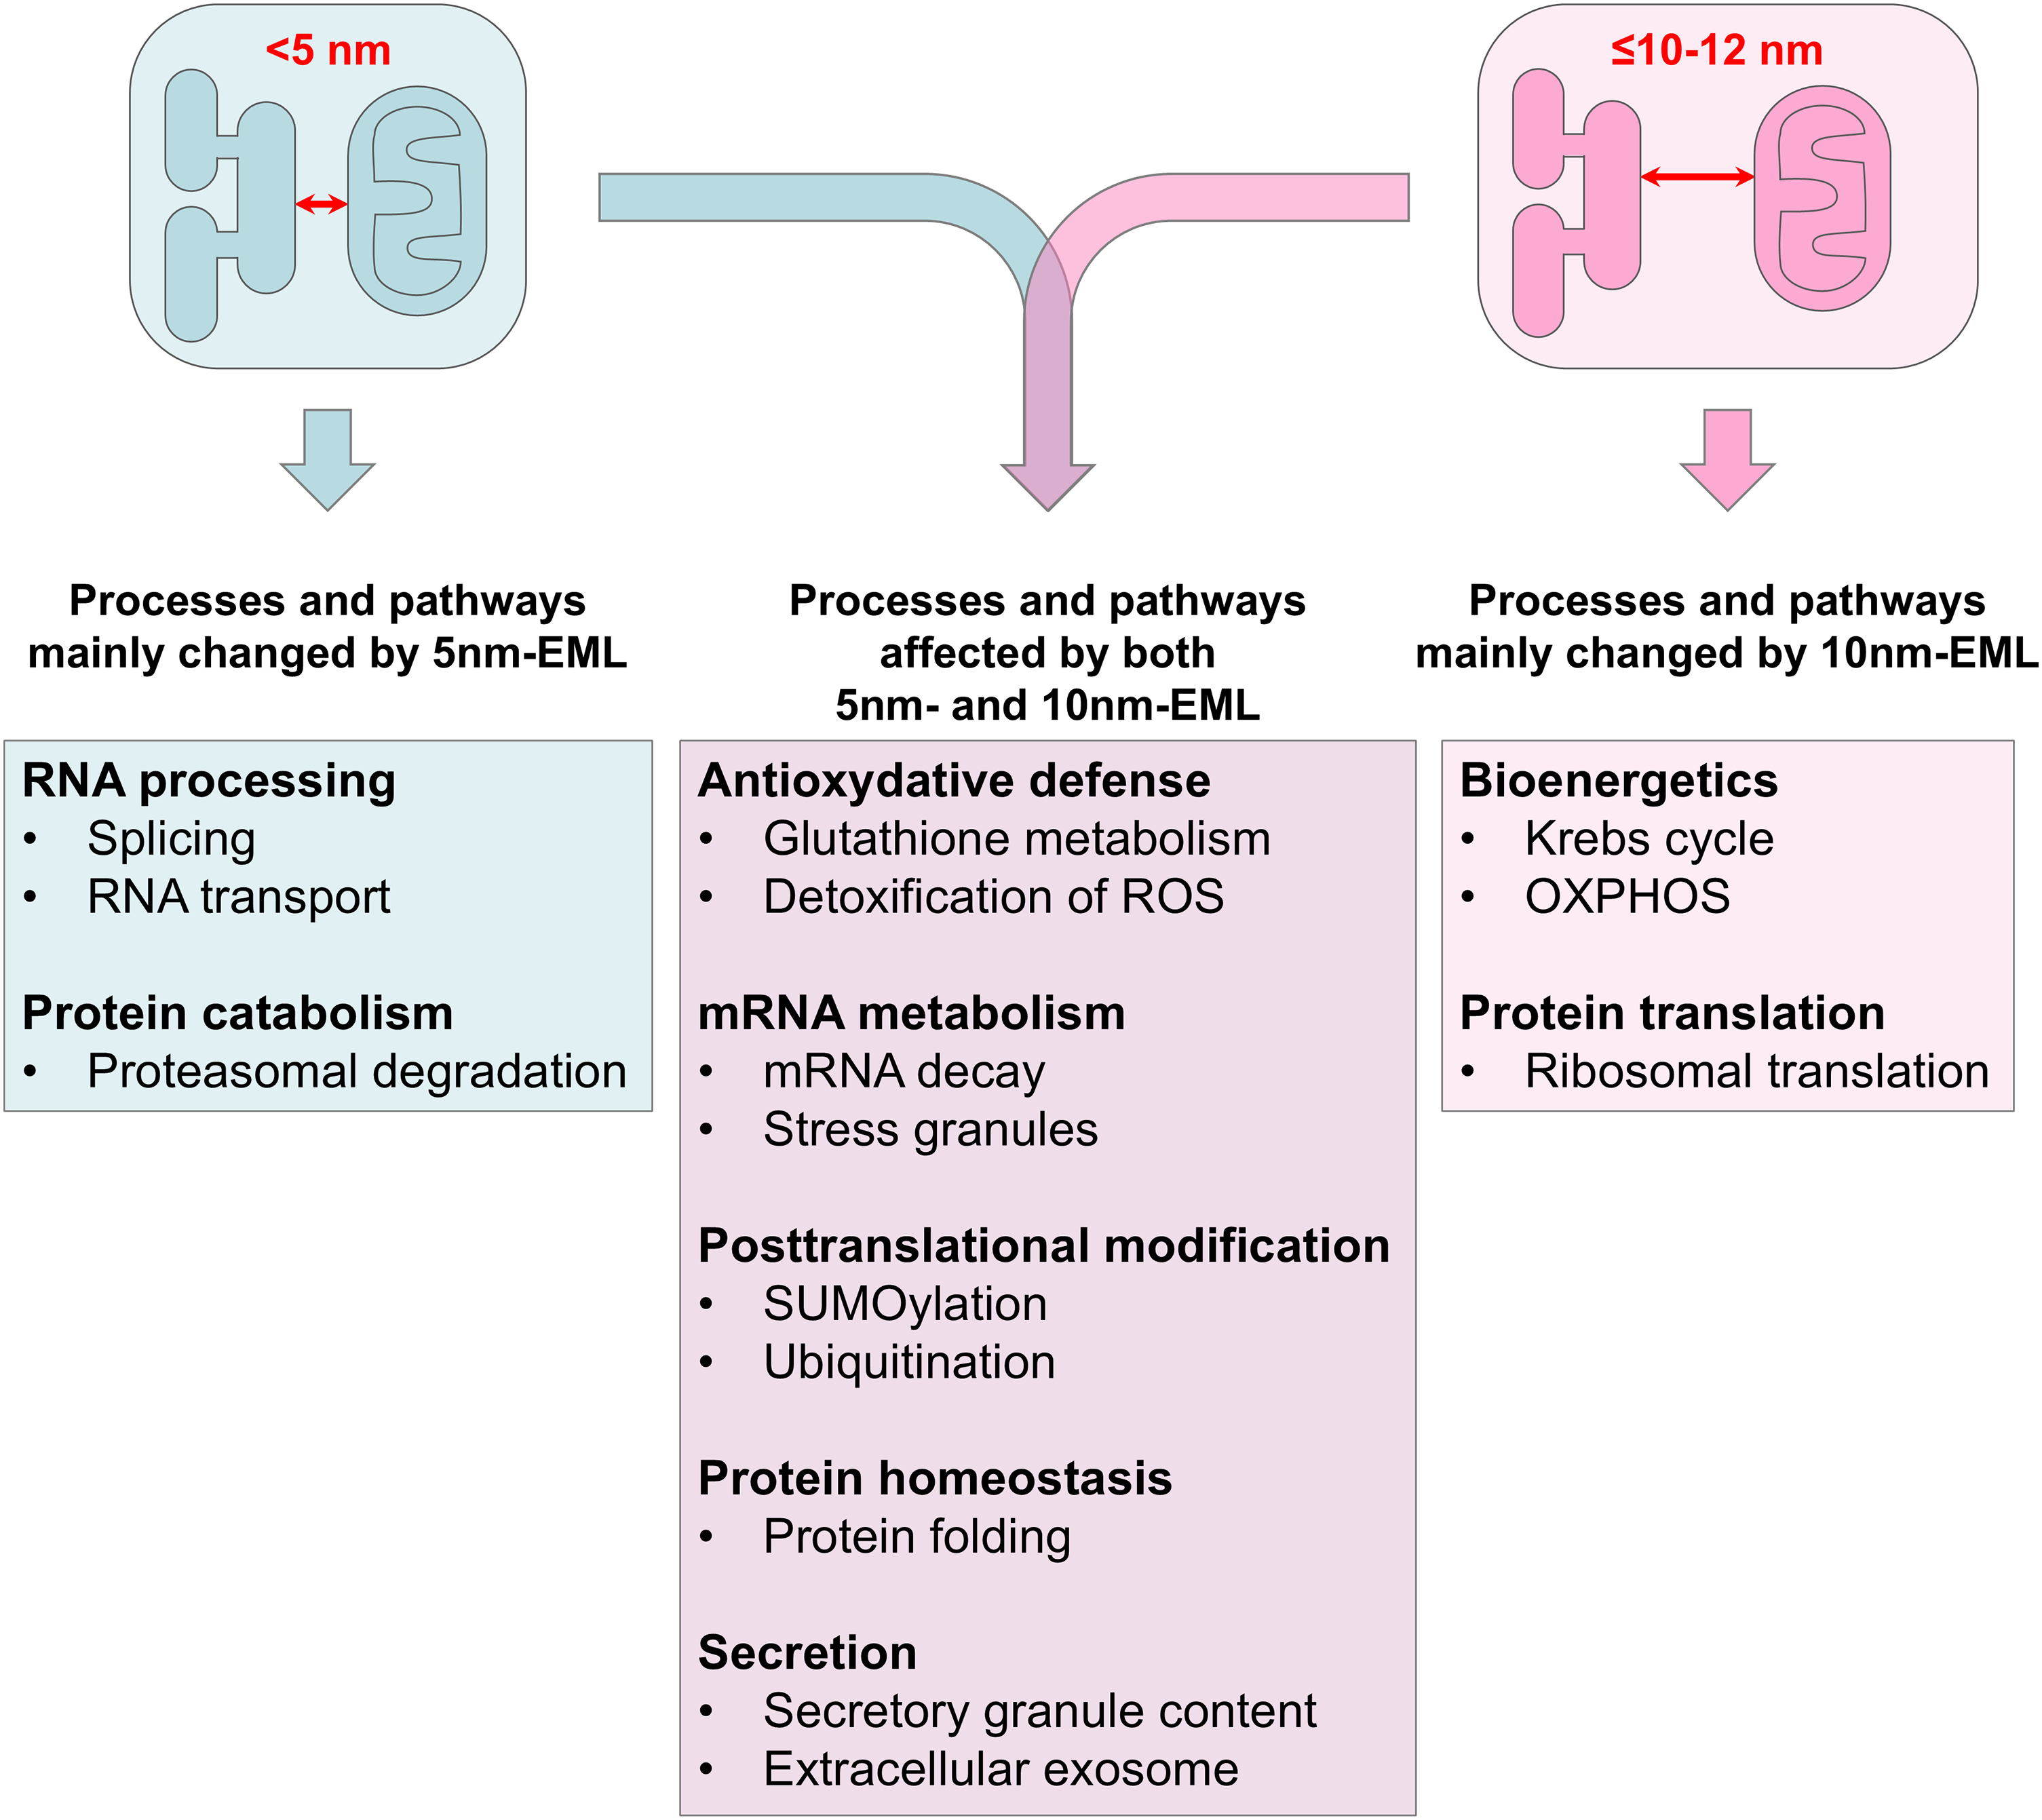
Specific and common functions of DEPs altered in 5 nm-EML and 10 nm-EML-expressing HeLa cells.
Gene Ontology Analysis of DEPs (P. Value < 0.05) Present in 10 nm-vs-5 nm Comparison.

Lipidomic Analysis
Prototypical function of MERCS is the maintenance of lipid homeostasis (Kornmann et al., 2009; Egea, 2021; Sassano et al., 2022). Therefore, we performed mass spectrometry lipidomic analysis. A total of 1206 lipid species were identified and quantified in both 5 nm-EML vs ER-RFP and in 10 nm-EML vs ER-RFP comparisons. Of these, 117 and 209 lipid species were differentially regulated (FC>± 1.3, p.v. < 0.05) in 5 nm-EML and 10 nm-EML-expressing cells, respectively (Supplemental Table 9). The analysis revealed that 5 nm-EML affected mostly fatty acids, phospholipids and sphingolipids, which levels were strongly reduced. Conversely, 10 nm-EML strongly increased amounts of triglycerides (Figure 9A). Analysis of specific lipid classes confirmed strong reduction of fatty acids in both in 5 nm-EML (by about 30%) and in 10 nm-EML dataset (by more than 50%). Phospholipid classes, reduced specifically in 5 nm-EML-expressing cells were bis-(monoacylglycero)-phosphate (BMP), phosphatidylinositol (PI), lyso-alkyl-Phosphatidylcholine (LPC-O) and alkyl-phosphatidylcholine (PC-O). Triglycerides were significantly increased (by about 25%) in 5 nm-EML-expressing cells (Figure 9B). Expression of 10 nm-EML resulted in a significant reduction of sphingomyelin and cholesterol esters classes. Altogether, lipidomic analysis suggests that 5 nm-EML and 10 nm-EML differentially affect lipid homeostasis.

Lipidomic analysis. Dendrogram heatmap of lipid species (A) and quantification of most changed lipid classes (blue headings, phospholipids; red, cholesterol derivatives; green, sphyngolipids) (B) from HeLa cells expressing ER-RFP, 5 nm-EML (5 nm) and 10 nm-EML (10 nm). In (B), data were analysed using one-way ANOVA with multiple comparison test and are expressed as mean ± SD. * p < 0.05; ** p < 0.01; *** p < 0.001.
Discussion
While speaking about processes controlled by ER-mitochondrial interaction, processes such as apoptosis, mitochondrial Ca2+ uptake and bioenergetics, autophagy and transduction of ER stress to UPR are among the most frequently mentioned (Csordás et al., 2018; Barazzuol et al., 2021). Although MERCS include rough ER and accommodate ribosomes (Giacomello and Pellegrini, 2016; Anastasia et al., 2021), their functional interaction with other aspects of protein homeostasis is poorly understood. Recently, in course of a comprehensive characterization of cell dysfunctions in immortalized lines of 3xTg-AD hippocampal astrocytes (WT-iAstro and 3Tg-iAstro cells) (Rocchio et al., 2019), we found that enhanced ER-mitochondrial tethering not only was linked to impaired ER-mitochondrial Ca2+ transfer and mitochondrial dysfunction, but was also linked to alterations of global protein synthesis and degradation (Dematteis et al., 2020; Tapella et al., 2022; Gong et al., 2023). Moreover, using manipulation of ER-mitochondrial interaction by expression of a synthetic ER-mitochondrial linker (10 nm-EML, used in this work), we showed that MERCS alterations may have a causal effect on protein dyshomeostasis (Tapella et al., 2022). Therefore, a deeper understanding of the effects that the enhanced ER-mitochondrial tethering exerts on protein homeostasis is necessary.
With this aim we used an artificial system for the overexpression, in HeLa cells, of synthetic ER-mitochondrial linkers stabilizing the ER-mitochondrial distance at ≤5 nm (5 nm-EML) and ≤10–12 nm (10 nm-EML) (Csordás et al., 2006, 2010). In line with that found in WT-iAstro expressing 10 nm-EML or in 3Tg-iAstro cells, derived from 3xTg-AD mice (Tapella et al., 2022), overexpression of both 5 nm-EML and 10 nm-EML in HeLa cells significantly reduced global protein synthesis rate as detected by a puromycin incorporation assay. Canonical ER stress/UPR pathway postulates that PERK-dependent phosphorylation of eIF2α ribosomal subunit mediates a global protein synthesis shutdown to allow recovery of the proteostatic machinery (Pakos-Zebrucka et al., 2016; Hetz et al., 2020). We previously found that in both WT-iAstro expressing 10 nm-EML and 3Tg-iAstro, p-eIF2α was elevated (Tapella et al., 2022). Similar results were obtained in vivo in hippocampi of symptomatic 3xTg-AD mice (Tapella et al., 2022). Strikingly, in HeLa cells, overexpressing 5 nm-EML and 10 nm-EML, total protein levels of both PERK and eIF2α were dramatically reduced. p-eIF2α tended to increase, suggesting that an enhanced ER-mitochondria interaction may affect the expression of proteins controlling global protein synthesis and UPR activation. Furthermore, in line with a low-grade ER-stress, previously found in 3Tg-iAstro (Dematteis et al., 2020), forced shortening of the ER-mitochondrial distance produced significant induction of UPR genes, in a distance-dependent manner.
ER stress/UPR is a recurrent theme in neurodegeneration, particularly in AD (Hetz and Saxena, 2017; Gerakis and Hetz, 2018; Rahman et al., 2018; Ghemrawi and Khair, 2020; Moradi Majd et al., 2020; Uddin et al., 2020; Ajoolabady et al., 2022). Recently, we suggested that full development of ER stress and execution of UPR occurs at late AD stage, from Braak stage III onward, in association with the development of tau pathology (Lim et al., 2023; Lim and Verkhratsky, 2024). To describe a low-level or selective activation of ER stress/UPR subroutines during long-lasting AD pathogenesis, terms “low-grade” or “chronic” ER stress/UPR have been used. Our results suggest that the enhanced ER-mitochondria tethering may contribute to the development of a low-grade ER stress/UPR (Tapella et al., 2022).
In order to investigate global effect of the enhanced ER-mitochondrial tethering on cellular protein homeostasis, we employed mass spectrometry proteomic analysis of whole cell lysates from cells expressing ER-RFP, 5 nm-EML and 10 nm-EML. Significant co-regulation of proteins between cells expressing the two linkers suggests that there is a set of proteins regulated by the enhanced tethering independently on ER-mitochondrial distance. A set of highly changed DEPs (fold change ≥± 5) was detected in both 5 nm-vs-Ctr and 10 nm-vs-Ctr comparisons, with a subset of proteins with an expression change more than 20-fold. Localization and functional analysis of these proteins, presented in Table 1, suggest that they might be involved in previously AD associated alteration in astrocytes and other cells. Thus, several proteins are related to mitochondrial biogenesis and OXPHOS: NADH-ubiquinone oxidoreductase 75 kDa subunit (NDUS1, a part of ETC), ATPase inhibitor (ATIF1, prevents ATP depletion) and Stomatin-like protein 2 (STML2, regulates cardiolipin metabolism and mitochondrial biogenesis) were highly upregulated, while Cytochrome c-type heme lyase (CCHL, required for cytochrome C maturation) was highly downregulated. Two highly regulated proteins in 10 nm-vs-Ctr comparison involved in antioxidant defense were Glutathione-specific gamma-glutamylcyclotransferase 2 (CHAC2, upregulated) and Phospholipid hydroperoxide glutathione peroxidase (GPX4, highly downregulated), an essential antioxidant peroxidase. A significant set of highly regulated proteins (40%) are involved in RNA processing, splicing, protein translation, folding, secretion and degradation (Table 1), suggesting that enhanced ER-mitochondrial tethering affects all aspects of protein homeostasis. Several highly changed proteins, specifically in 10 nm-vs-Ctr dataset, were involved in glucose metabolism: the most differentially expressed protein, Fructose-2,6-bisphosphatase (TIGAR, downregulated more than 80-fold), regulates glycolysis rate, while another protein, Phosphoacetylglucosamine mutase (AGM1, downregulated ≥20-fold), regulates glucose bioavailability catalyzing both synthesis and degradation of glycogen. Interestingly, through interaction with other proteins, TIGAR was reported to have a number of non-enzymatic functions, including regulation of cell cycle, inflammatory response, and mitochondrial protection (Sinha et al., 2013; Chen et al., 2018; Tang et al., 2021). Of note, the role of TIGAR in AD-associated energetic dysmetabolism and loss of protection against oxidative stress has also been proposed (Katsel et al., 2013). Our results suggest that the above-mentioned alterations may be the effect of an altered ER-mitochondria tethering.
Gene ontology, pathway and network analyses corroborated the analysis of single highly changed proteins. Although many retrieved GO terms and pathways were present in both 5 nm-vs-Ctr and 10 nm-vs-Ctr subsets (Figure 8), By analysing proteins changed specifically in two subsets and in 10 nm-vs-5 nm comparison, it was possible to identify functions affected preferentially by either 5 nm-EML or 10 nm-EML, but also functions shared between both datasets. Strikingly, most of these functions covered the alterations found in 3TG-iAstro or 10 nm-EML-overexpressing WT-iAstro cells, including oxidative and bioenergetic disbalance, dysregulation of protein synthesis and degradation, alterations of protein folding, posttranscriptional modifications and secretion (Dematteis et al., 2020; Tapella et al., 2022; Gong et al., 2023). All these alterations have been described in AD pathogenesis and represent key features of neurodegeneration in general (Markesbery, 1997; Blass et al., 2000; Ding et al., 2005; Thibaudeau et al., 2018; Ionescu-Tucker and Cotman, 2021).
Alterations, previously unrelated to ER-mitochondrial tethering, were represented by RNA processing and splicing in the nucleus, nucleo-cytoplasmic RNA transport, and degradation of mRNA in the cytosol. DEPs involved in these functions were particularly enriched in 5 nm-vs-Ctr dataset (Figure 8). Notably, these alterations have already been described as a part of the pathogenesis of AD and other neurodegenerative diseases, although their mechanisms remain largely unexplored (Ash et al., 2014; Alkallas et al., 2017; Boehringer and Bowser, 2018; Eftekharzadeh et al., 2018; Hsieh et al., 2019; Zuniga et al., 2023).
To confirm that forced tethering at 5 and 10 nm between ER and mitochondria has an effect on the prototypical function of MERCS, that of phospholipid synthesis and homeostasis (Kornmann et al., 2009; Egea, 2021; Sassano et al., 2022), we performed whole cell lipidomic analysis in HeLa cells transiently expressing 5 nm- and 10 nm-EML. Our results not only confirm that correct ER-mitochondrial interaction is fundamental for lipid homeostasis, but also suggest that minimal difference in the tethering distance profoundly affects cellular lipid composition. Our results are also in line with the notion that phospholipid synthesis at MERCS occurs at distances shorter than 5–10 nm (Giacomello and Pellegrini, 2016): we found that the reduction of phospholipid content was stronger in cells expressing 10 nm-EML compared to 5 nm-EML-expressing cells. Conversely, 5 nm-EML expression resulted in a stronger increase in triglyceride species. Nonetheless, all-to-all, our results suggest that enhanced tethering results in a shift from phospholipids to triacylglycerols, a trend found in diabetes linked to obesity and gestation (Furse et al., 2019; Sourianarayanane et al., 2024) as well as in experimental conditions such as feeding of mutant yeasts with trans-fatty acids or treatment of HL-60 cells with triethyl lead chloride (Graff and Lands, 1976; Krug and Culig, 1991).
The cell model used in this study, HeLa cells, presents limitations due to its undifferentiated tumor nature. However, many mechanistic studies, in which overexpression of pathology-relevant proteins was used, were performed using HeLa cells (Calì et al., 2012; Filadi et al., 2018). Moreover, the results on protein expression and synthesis rate, as well as on the effect on ER-mitochondrial Ca2+ transfer obtained on HeLa cells are in line with those obtained on other cell types including primary and immortalized astrocytes (Dematteis et al., 2020; Tapella et al., 2022), hepatocellular carcinoma cells and mouse embryonic fibroblasts (Dematteis et al., 2024). Therefore, our data suggest that the effects on the remodeling of proteostatic machinery and lipid homeostasis, in response to enhanced tethering, represent a general phenomenon, applicable for other cell types and diseases other than the above-mentioned AD. Diseases in which the alterations in ER-mitochondrial tethering have been implicated range from cancer and metabolic diseases to infectious diseases, immune disorders and inflammation (Arruda et al., 2014; Missiroli et al., 2018; Doghman-Bouguerra and Lalli, 2019; Namgaladze et al., 2019; Simoes et al., 2020; Beaulant et al., 2022; Hofstadter et al., 2024).
Altogether, our results suggest that the effects of the enhanced ER-mitochondria tethering may extend far beyond the dysproteostasis framed by canonical ER stress/UPR paradigm, and may include all aspects of RNA and protein homeostasis from RNA processing and splicing to protein secretion and degradation. Dysregulation of other aspects of cellular physiology such as RedOx disbalance and bioenergetic deficit may arise at least in part from alterations in the expression of proteins involved in these functions, including lipid homeostasis. Furthermore, our results suggest that alterations of the ER-mitochondria interaction may underlie many aspects of protein dyshomeostasis during pathogenesis of neurodegenerative and other diseases.
Methods
ER-Mitochondrial Linkers
5 nm-EML and 10 nm-EML, kindly donated by Gyorgy Hajnoczky (Jefferson University, USA), were composed of a monomeric RFP flanked by flexible spacers and by targeting sequences for the cytosolic sides of OMM (AKAP) and ER (UBC6) (Csordás et al., 2006, 2010).
Cell Cultures and Transfection
HeLa (https://www.atcc.org/products/ccl-2) were maintained in complete culture media containing Dulbecco's modified Eagle's medium (DMEM; Sigma-Aldrich, Cat. D5671) supplemented with 10% fetal bovine serum (FBS, Gibco, Cat. 10270), 2 mM L-glutamine (Sigma-Aldrich, Cat. G7513), and 1% penicillin/streptomycin solution (Sigma-Aldrich, Cat. P0781).
For transfection, 1 × 10⁶ cells/well were resuspended in 5 mL of complete DMEM and 5 mL of transfection mix, and plated onto p100 dishes. For the transfection mix, Lipofectamine 2000 (Thermo Fisher Scientific, Cat. 11668-019) and plasmid, in a ratio 1:1, were mixed in Optimem (Gibco, Cat. 11058-021); after 3 h, transfection medium was replaced with complete medium. After 48 h, cells were used for experiments.
Crystal Violet Cell Viability Assay
Crystal violet is a viability assay that discriminates between alive and dead cells in culture by employing a blue/violet dye exclusively binding to DNA and proteins in well-adherent, viable cells. HeLa were plated at a density of 7.5 × 10³ cells/well, and transfected with 5 nm-EML, 10 nm-EML and ER-RFP on 96-well plates. 48 h post-transfection, media was removed, and cells were fixed in methanol at 4 °C. After incubation for 10–20 min with 50 µL/well of 0.1% crystal violet, the dye was carefully removed, and each well was washed with phosphate-buffered saline solution (PBS). Then, plates were allowed to dry for 12 h, and crystal violet was solubilized in 50 µL/well of 30% acetic acid. Lastly, absorbance at 595 nm was measured using Victor3V 1420 multilabel counter (Perkin Elmer).
ATPlite Total Cell ATP Content Assay
Cells were seeded at a density of 7.5 × 10³ cell/well, and transfected with 5 nm-EML, 10 nm-EML and ER-mRFP on 96-well plates. 48 h post-transfection, 30 µL/well of mammalian cell lysis solution were added, and lysis was favored by shaking the plate at 400/500 rpm for 5 min. Then, 30 µL/well of substrate buffer solution (containing Luciferase and D-Luciferin) were added, and the plate was put again at 400/500 rpm for 5 min, protected from light according to manufacturer's instructions (PerkinElmer, Cat. ATPLT-0415). After another 10 min of incubation, luminescence was measured using Victor3V 1420 multilabel counter (Perkin Elmer).
MTT Metabolic Activity Assay
For the MTT (3-(4,5-dimethylthiazol-2-yl)-2,5 diphenyl tetrazolium bromide) assay, HeLa were seeded on 96 wells plates, at a density of 7.5 × 10³, and transfected with 5 nm-EML, 10 nm-EML and ER-RFP. 48 h post-transfection, cells were incubated with MTT stock solution (prepared dissolving MTT powder in Locke1X, 5 mg/mL) at 37 °C for 1 h. After the incubation, media was removed from wells and formazan crystals were resuspended in Isopropanol/HCl 0.1 M. Lastly, absorbance at 570 nm was measured.
Puromycin Incorporation Method (Surface Sensing of Translation, SUnSET)
HeLa cells, expressing ER-RFP, 5 nm-EML or 10 nm-EML were plated (4 × 10⁴ cells/well in 24 w/plate) and incubated with 4 µM puromycin dihydrochloride (Sigma Cat. P8833) (1 h, 37°) supplemented in normal medium at 37 °C with 5% CO2 for 3 h (Schmidt et al., 2009). Subsequently, cells lysates were subjected to Western blot assay.
Western Blot
48 h post-transfection, cells were lysed with lysis buffer (50 mM Tris-HCl (pH 7.4), sodium dodecyl sulfate (SDS) 0.5%, 5 mM EDTA, complemented with protease inhibitors cocktail (PIC, Millipore, Cat. 539133) and phosphatase inhibitor cocktail (Thermo Fisher Scientific, Cat. 78428), and collected in a 1.5 mL tube. Lysates were quantified with QuantiPro BCA Assay Kit (Sigma, Cat. SLBF3463). According to the relative abundance of the protein of interest, 20–40 µg of proteins were mixed with the right amount of Laemmli Sample Buffer 4X (Bio-Rad) and boiled. Then samples were loaded on a 6–12% polyacrylamide-sodium dodecyl sulfate gel for SDS-PAGE. Proteins were transferred onto nitrocellulose membrane, using Mini Transfer Packs or Midi Transfer Packs, with Trans-Blot® Turbo TM (Bio-Rad) according to the manufacturer's instructions (Bio-Rad). The membranes were blocked in 5% skim milk (Sigma, Cat. 70166) for 45 min at room temperature. Subsequently, membranes were incubated with the indicated primary antibody overnight at 4 °C. Anti-β-Actin was used to normalize protein loading.
Goat anti-mouse IgG (H + L) horseradish peroxidase-conjugated (Bio-Rad, 1:5000; Cat. 170-6516,) and Goat anti-rabbit IgG (H + L) horseradish peroxidase-conjugated secondary antibodies (Bio-Rad, 1:5000; Cat. 170-6515,) were used. Detection was carried out with SuperSignalTM West Pico/femto PLUS Chemiluminescent Substrate (Thermo Scientific, Cat. 34578), based on the chemiluminescence of luminol and developed using ChemiDocTM Imaging System (Bio-Rad).
Total RNA Extraction and Real-Time PCR
Total mRNA was extracted from 1.0 × 10^6 cells using TRIzol Lysis Reagent (Invitrogel, Cat. 15596026) according to manufacturer's instruction. First strand of cDNA was synthesized from 0.5–1 µg of total RNA using Im-Prom-II system (Promega, Cat. A3800). Real-Time PCR was performed using iTaq qPCR master mix according to manufacturer's instructions (Bio-Rad, Cat. 1725124) on a SFX96 Real-time system (Bio-Rad). To normalize raw real time PCR data, S18 ribosomal subunit was used. Data are expressed as delta-C (t) of gene of interest to S18 allowing appreciation of single gene expression level. Oligonucleotide primers were as follows: ATF4 (NM_001675.4), forward: GTGGCCAAGCACTTCAAACC, reverse: CCCGGAGAAGGCATCCTC; ATF6 (NM_007348.4), forward: TATCAGTTTACAACCTGCACCCACTA, reverse: GCAAGGACTGGCTGAGCAGA; Xbp1 spliced (Xbp1s, NM_005080.4), forward: GAATGAAGTGAGGCCAGTG, reverse: GAGTCAATACCGCCAGAATC; Herpud1 (NM_014685.4), forward: CTCCAGACAGGGATGTACTA, reverse: TGGAAGAAGAGAGGCAAAG; S18 (NM_011296), forward: TGCGAGTACTCAACACCAACA, reverse: CTGCTTTCCTCAACACCACA.
Shotgun Mass Spectrometry Proteomics
Cell lysates were reduced using 2.5 μL of dithiothreitol (200 mM DTT stock solution) (Sigma) at 90 °C for 20 min, and alkylated with 10 μL of Cysteine Blocking Reagent (Iodoacetamide, IAM, 200 mM Sigma) for 1 h at room temperature in the dark. Trypsin (Promega, Sequence Grade) was added and digestion was performed overnight at 37 °C. Then, peptides digests were desalted on the Discovery® DSC-18 solid phase extraction (SPE) 96-well Plate (25 mg/well) (Sigma-Aldrich Inc., St. Louis, MO, USA) and the samples were ready for the analysis.
Digested peptides were analyzed with a UHPLC Vanquish system (Thermo Scientific, Rodano, Italy) coupled with an Orbitrap Q-Exactive Plus (Thermo Scientific, Rodano, Italy). Peptides were separated by a reverse phase column (Accucore™ RP-MS 100 × 2.1 mm, particle size 2.6 µm). The column was maintained at a constant temperature of 40 °C at a flow rate of 0.200 mL/min. Mobile phase A and B were water and acetonitrile respectively, both acidified with 0.1% formic acid. The analysis was performed using the following gradient: 0–5 min from 2% to 5% B; 5–55 min from 5% to 30% B; 55–61 from 30% to 90% B and hold for one minute, at 62.1 min the percentage of B was set to the initial condition of the run at 2% and hold for about 8 min in order to riequilibrate the column, for a total run time of 70 min. The Mass spectrometry analysis was performed in positive ion mode. The ESI source was used with a voltage of 2.8 kV. The capillary temperature, sheath gas flow, auxiliary gas and spare gas flow were set at 325 °C, 45 arb, 10 arb and 2 respectively. S-lens was set at 70 rf. For the acquisition of spectra, a data-dependent (ddMS2) top 10 scan mode was used. Survey full-scan MS spectra (mass range m/z 381 to 1581) were acquired with resolution R = 70,000 and AGC target 3 × 10⁶. MS/MS fragmentation was performed using high-energy c-trap dissociation (HCD) with resolution R = 35,000 and AGC target 1 × 10⁶. The normalized collision energy (NCE) was set to 30. The injection volume was 3 μL. The mass spectra analysis was carried out using MaxQuant software (version 1.6.14). MaxQuant parameters were set as follow: trypsin was selected for enzyme specificity; the search parameters were fixed to an initial precursor ion tolerance of 10 ppm and MS/MS tolerance at 20 ppm; as fixed modification, carbamidomethylation was set, whereas oxidation was set as variable modification. The maximum missed cleavages were set to 2. Andromeda search engine searched the spectra in MaxQuant against the human uniprot database (02/02/2022). Label free quantification was performed including a match between runs option with the following parameters: protein and peptide false discovery rate was set to 0.01; the quantification was based on the extracted ion chromatograms, with a minimum ratio count of 1; the minimum required peptide length was set to 7 amino acids. T-test was performed with MarkerView software (Sciex, Berlin, Germany).
Bioinformatic Analysis
DAVID gene ontology (GO) analysis Gene ontology (GO) analysis was performed using The DAVID tool v2024q1 (https://david.ncifcrf.gov/). Overrepresented GO terms which passed Benjamini correction (p < 0.05) were considered significant.
STRING (Search Tool for the Retrieval of Interacting Genes/ Proteins) v12.0 online software (https://string-db.org/) was used for prediction of protein-protein interactions and clustering.
Lipidomic Analysis
For lipidomic analysis, cells were extracted using 1 mL of 75:15 IPA/H2O solution, after the addition of 100 μL of CH3OH 5% deuterated standard (Splash Lipidomix®). Then the samples were vortexed for 30 s, sonicated for 2 min, vortexed again for 30 s and then they were incubated for 30 min at 4 °C, under gentle, constant shaking. Subsequently, samples were rested on ice for additional 30 min. To remove debris and other impurities, the samples were centrifuged for 10 min at 3500 g at 4 °C. 1 mL of supernatant was collected and dried using a SpeedVac centrifuge (Labogene). The dried samples were reconstituted in 100 μL of CH3OH containing the internal standard CUDA (12.5 ng/mL). Samples were analyzed with a Vanquish UHPLC system (Thermo Scientific, Rodano, Italy) coupled with an Orbitrap Q-Exactive Plus (Thermo Scientific, Rodano, Italy). Lipid separation was performed using a reversed-phase column (Hypersil Gold™ 150 × 2.1 mm, particle size 1.9 µm) maintained at 45 °C with a flow rate of 0.260 mL/min. Mobile phase A for ESI mode positive consisted of 60:40 (v/v) acetonitrile/water with ammonium formate (10 mmol) and 0.1% formic acid, while mobile phase B was 90:10 isopropanol/acetonitrile (v/v) with ammonium formate (10 mmol) and 0.1% formic acid, while in the negative ESI mode, the organic solvents for both mobile phases were the same as in the positive with the exception of using ammonium acetate (10 mmol) as a mobile phase modifier. The gradient used was as follows: 0–2 min from 30 to 43% B, 2–2.1 min from 43 to 55% B, 2.1–12 min from 55 to 65% B, 12–18 min at 65% to 85% B, 18–20 min at 85% to 100% B; 100% B was held for 5 min, and then the column was allowed to equilibrate to 30% B for another 5 min. The total running time was 30 min. Mass spectrometry analysis was performed in both positive ion (at 3.5 kV) and negative ion (2.8 kV) modes. Data were collected in a data-dependent top 10 scan mode (ddMS2). MS full-scan survey spectra (mass range m/z 80–1200) were acquired with a resolution of R = 70,000 and target AGC of 1 × 10⁶. MS/MS fragmentation was performed using HCD with R = 17,500 resolution and 1 × 10⁵ AGC target. The step NCE was set to 15, 30 and 45. The injection volume was 3 µL. For accurate mass-based analysis, regular Lockmass and interrun calibrations were used. An exclusion list for background ions was generated by testing the same procedural sample for both positive and negative ESI modes. Quality control was ensured by analyzing pooled samples before, at the beginning and at the end of the batches; using blanks to check for residual interference; and using internal standards, directly in plasma or cell samples, which include a series of analyte classes at levels appropriate for the plasma (Avanti SPLASH Lipidomix) and an internal standard (CUDA) prior to liquid chromatography-mass spectrometry (LC–MS) analysis. Raw data acquired from lipidomic untargeted analysis were processed with MSDIAL software (Yokohama City, Kanagawa, Japan), version 4.24. Peaks were detected, MS2 data were deconvoluted, compounds were identified, and peaks were aligned across all samples. For quantification, the peak areas for the different molecular species detected were normalized using the deuterated internal standard for each lipid class. To obtain an estimated concentration expressed in nmol/mL (plasma), the normalized areas were multiplied by the concentration of the internal standard. An in-house library of standards was also used for lipid identification.
Statistical Analysis
Statistical analysis was performed with GraphPad Prism software (Graphpad software Inc., La Jolla, CA). A two-tailed unpaired Student's t-test was used to compare two samples. To compare three or more samples, one-way ANOVA was used, followed by Tukey post hoc test, unless otherwise specified. A p-value < 0.05 was considered statistically significant.
Supplemental Material
sj-xlsx-1-ctc-10.1177_25152564251329704 - Supplemental material for Remodelling of Cellular Protein Homeostasis by Enhanced ER-Mitochondrial Tethering
Supplemental material, sj-xlsx-1-ctc-10.1177_25152564251329704 for Remodelling of Cellular Protein Homeostasis by Enhanced ER-Mitochondrial Tethering by Elisa Tonelli, Justyna Malecka, Elettra Barberis, Camilla Romano, Emanuela Pessolano, Maria Talmon, Armando A Genazzani, Claudio Casali, Marco Biggiogera, Marcello Manfredi, Laura Tapella, Dmitry Lim and Giulia Dematteis in Contact
Supplemental Material
sj-xlsx-2-ctc-10.1177_25152564251329704 - Supplemental material for Remodelling of Cellular Protein Homeostasis by Enhanced ER-Mitochondrial Tethering
Supplemental material, sj-xlsx-2-ctc-10.1177_25152564251329704 for Remodelling of Cellular Protein Homeostasis by Enhanced ER-Mitochondrial Tethering by Elisa Tonelli, Justyna Malecka, Elettra Barberis, Camilla Romano, Emanuela Pessolano, Maria Talmon, Armando A Genazzani, Claudio Casali, Marco Biggiogera, Marcello Manfredi, Laura Tapella, Dmitry Lim and Giulia Dematteis in Contact
Supplemental Material
sj-xlsx-3-ctc-10.1177_25152564251329704 - Supplemental material for Remodelling of Cellular Protein Homeostasis by Enhanced ER-Mitochondrial Tethering
Supplemental material, sj-xlsx-3-ctc-10.1177_25152564251329704 for Remodelling of Cellular Protein Homeostasis by Enhanced ER-Mitochondrial Tethering by Elisa Tonelli, Justyna Malecka, Elettra Barberis, Camilla Romano, Emanuela Pessolano, Maria Talmon, Armando A Genazzani, Claudio Casali, Marco Biggiogera, Marcello Manfredi, Laura Tapella, Dmitry Lim and Giulia Dematteis in Contact
Supplemental Material
sj-xlsx-4-ctc-10.1177_25152564251329704 - Supplemental material for Remodelling of Cellular Protein Homeostasis by Enhanced ER-Mitochondrial Tethering
Supplemental material, sj-xlsx-4-ctc-10.1177_25152564251329704 for Remodelling of Cellular Protein Homeostasis by Enhanced ER-Mitochondrial Tethering by Elisa Tonelli, Justyna Malecka, Elettra Barberis, Camilla Romano, Emanuela Pessolano, Maria Talmon, Armando A Genazzani, Claudio Casali, Marco Biggiogera, Marcello Manfredi, Laura Tapella, Dmitry Lim and Giulia Dematteis in Contact
Supplemental Material
sj-xlsx-5-ctc-10.1177_25152564251329704 - Supplemental material for Remodelling of Cellular Protein Homeostasis by Enhanced ER-Mitochondrial Tethering
Supplemental material, sj-xlsx-5-ctc-10.1177_25152564251329704 for Remodelling of Cellular Protein Homeostasis by Enhanced ER-Mitochondrial Tethering by Elisa Tonelli, Justyna Malecka, Elettra Barberis, Camilla Romano, Emanuela Pessolano, Maria Talmon, Armando A Genazzani, Claudio Casali, Marco Biggiogera, Marcello Manfredi, Laura Tapella, Dmitry Lim and Giulia Dematteis in Contact
Supplemental Material
sj-xlsx-6-ctc-10.1177_25152564251329704 - Supplemental material for Remodelling of Cellular Protein Homeostasis by Enhanced ER-Mitochondrial Tethering
Supplemental material, sj-xlsx-6-ctc-10.1177_25152564251329704 for Remodelling of Cellular Protein Homeostasis by Enhanced ER-Mitochondrial Tethering by Elisa Tonelli, Justyna Malecka, Elettra Barberis, Camilla Romano, Emanuela Pessolano, Maria Talmon, Armando A Genazzani, Claudio Casali, Marco Biggiogera, Marcello Manfredi, Laura Tapella, Dmitry Lim and Giulia Dematteis in Contact
Supplemental Material
sj-xlsx-7-ctc-10.1177_25152564251329704 - Supplemental material for Remodelling of Cellular Protein Homeostasis by Enhanced ER-Mitochondrial Tethering
Supplemental material, sj-xlsx-7-ctc-10.1177_25152564251329704 for Remodelling of Cellular Protein Homeostasis by Enhanced ER-Mitochondrial Tethering by Elisa Tonelli, Justyna Malecka, Elettra Barberis, Camilla Romano, Emanuela Pessolano, Maria Talmon, Armando A Genazzani, Claudio Casali, Marco Biggiogera, Marcello Manfredi, Laura Tapella, Dmitry Lim and Giulia Dematteis in Contact
Supplemental Material
sj-xlsx-8-ctc-10.1177_25152564251329704 - Supplemental material for Remodelling of Cellular Protein Homeostasis by Enhanced ER-Mitochondrial Tethering
Supplemental material, sj-xlsx-8-ctc-10.1177_25152564251329704 for Remodelling of Cellular Protein Homeostasis by Enhanced ER-Mitochondrial Tethering by Elisa Tonelli, Justyna Malecka, Elettra Barberis, Camilla Romano, Emanuela Pessolano, Maria Talmon, Armando A Genazzani, Claudio Casali, Marco Biggiogera, Marcello Manfredi, Laura Tapella, Dmitry Lim and Giulia Dematteis in Contact
Supplemental Material
sj-xlsx-9-ctc-10.1177_25152564251329704 - Supplemental material for Remodelling of Cellular Protein Homeostasis by Enhanced ER-Mitochondrial Tethering
Supplemental material, sj-xlsx-9-ctc-10.1177_25152564251329704 for Remodelling of Cellular Protein Homeostasis by Enhanced ER-Mitochondrial Tethering by Elisa Tonelli, Justyna Malecka, Elettra Barberis, Camilla Romano, Emanuela Pessolano, Maria Talmon, Armando A Genazzani, Claudio Casali, Marco Biggiogera, Marcello Manfredi, Laura Tapella, Dmitry Lim and Giulia Dematteis in Contact
Footnotes
Acknowledgements
Advanced microscopy facility, Center for Allergic and Autoimmune Diseases, CAAD, Università del Piemonte Orientale.
Data Availability
After acceptance all row data and datasets will be available from the corresponding author upon request.
Declaration of Conflicting Interests
The authors declared no potential conflicts of interest with respect to the research, authorship, and/or publication of this article.
Ethical Approval and Informed Consent Statements
Nothing to declare.
Funding
This work has following funding: EMBO short-term fellowship ASTF9854 (GD); CRT Foundation grant 1393-2017 (LT). This publication is part of the project PNRR-MCNT2-2023-12377363, which has received funding from NextGeneration EU - Ministry of Health - M6C2 2.1, CUP C13C24000440007 (LT, DL). This publication is part of the project PRIN 2022 PNRR with code P2022R43RA, which has received funding from NextGeneration EU - MUR - M4C2 1.1, CUP C53D23008500001 (ET, DL).
ORCID iDs
Supplemental Material
Supplemental material for this article is available online.
References
Supplementary Material
Please find the following supplemental material available below.
For Open Access articles published under a Creative Commons License, all supplemental material carries the same license as the article it is associated with.
For non-Open Access articles published, all supplemental material carries a non-exclusive license, and permission requests for re-use of supplemental material or any part of supplemental material shall be sent directly to the copyright owner as specified in the copyright notice associated with the article.