
Abstract
Psychological scientists are increasingly acknowledging the importance of transparency for research integrity. In the present study, we examined one important facet of transparency: providing enough information about measures so that readers can evaluate aspects of construct validity. With a focus on social and personality psychology, we explored how often authors in one journal report a scale name, citation, example item, number of items, and reliability coefficient and how often authors provide access to the study’s materials. We also investigated how measurement-reporting practices have changed from 2010 to 2020, the decade encompassing the start of the “credibility revolution” in psychology. Across two samples, we coded 506 Social Psychological and Personality Science articles (N = 425 articles with at least one questionnaire measure; N = 1,198 questionnaire measures). Overall, ≈31% of measures were reported with a name, ≈53% were reported with a citation, ≈66% were reported with an example item, ≈76% were reported with the number of items, and ≈78% of multiitem measures included some reliability information; ≈22% of measures were a single item, and 46% were ad hoc. We did not detect any apparent changes in the reporting practices examined from 2010 to 2020 in either sample except for an increase in the availability of materials over time. Therefore, the replication crisis may have motivated increased access to studies’ materials in recent years but otherwise does not seem to be associated with more transparent reporting of measurement information for questionnaires in brief social-and-personality-psychology articles.
Keywords
Psychological measures attempt to quantify unobservable attributes called “constructs.” Construct validity represents the extent to which the numerical data from a specific instantiation of a measure reflects a person’s true level of the construct of interest (Clark & Watson, 2019; Cronbach & Meehl, 1955). Although researchers often use slightly different conceptualizations of construct validity, all agree that construct validity is crucial to establishing valid inferences from the specific measurements researchers use to the broader psychological constructs they draw conclusions about. However, authors of journal articles are not consistently required to report important details about their measures, which can lead to inconsistencies in reporting practices that result in an incomplete picture of the construct validity of many published measures used in social and personality psychology (Flake et al., 2017). In the present study, we assessed the extent to which measurement-reporting practices are transparent in the field and how these practices have changed since the beginning of the “credibility revolution” in psychology. In particular, we examined how often social-and-personality-psychology articles in one journal report several characteristics of measures that are useful for assessing construct validity, how often authors provided access to the study’s materials, and whether these practices changed from 2010 to 2020.
Construct Validity
Psychological research relies on interpretations of measurements with a high degree of construct validity to accurately describe, explain, and predict humans’ thoughts, feelings, behaviors, and experiences. With poor construct validity, scores do not accurately reflect the construct of interest, and any resulting research claims are substantially undermined (Loevinger, 1957). Ideally, the time, effort, and written output dedicated to evaluating and conveying the construct validity of measures would be commensurate with its foundational importance. Unfortunately, evidence for the construct validity of many widely used questionnaire measures in social and personality psychology remains questionable (Hussey & Hughes, 2020), and little attention has been paid to construct validity in the limitations sections of social-and-personality-psychology journal articles (Clarke et al., 2023).
This “measurement schmeasurement” attitude (Flake & Fried, 2020) contributed to the shoddy research that gave rise to the replicability crisis in psychology. Back in 2011, an influential article showed that many published psychological findings could be false positives (Simmons et al., 2011), and soon after, researchers began suggesting concrete improvements to research methods that could enhance scientific progress (Asendorpf et al., 2013). Metascience has since become a burgeoning research area in psychology with vital importance to the ongoing credibility revolution, or concerted efforts to improve the quality of psychological science (Vazire, 2018). Despite reform efforts to improve the credibility of the field, measurement-related issues have garnered relatively little attention (Flake & Fried, 2020; but for a notable example connecting measurement concerns with the reform movement, see Higgins et al., 2024).
Indicators of Construct Validity
There is no single indicator of construct validity; “construct validity cannot generally be expressed in the form of a single simple coefficient” (Cronbach & Meehl, 1955, p. 300). Despite attempts to quantify construct validity into a single number (for one such effort, see Westen & Rosenthal, 2003), there is no well-established method for briefly conveying the construct validity of a measure. Instead, there are various characteristics that can convey information about construct validity, including item-level analysis, factor structure, and convergent and discriminant validity (Clark & Watson, 2019; Loevinger, 1957; Westen & Rosenthal, 2003). 1 Despite their importance, these indicators are rarely reported in empirical studies of social-and-personality-psychology constructs (e.g., ≈9% of multiitem scales were reported with a factor analysis in a systematic review by Flake et al., 2022), and they are unlikely to be reported in brief journal articles when scale validation is not the main aim of the study. Therefore, in the present study, we instead focus on measurement characteristics that are relatively easy to report, that we believe are fairly commonly reported (or at least not very rare), and that have been examined in previous metaresearch (e.g., Flake et al., 2017). These characteristics include scale name, citation, example items, number of items, and reliability coefficients. Information provided by these characteristics is wholly insufficient for thoroughly assessing construct validity, but they comprise the “lower effort” details about measures that can be reported by authors. Details that require more effort (e.g., item-level analysis, factor structure, convergent/divergent validity) are unlikely to be included when these basic characteristics are missing.
Two such basic characteristics are the presence or absence of a name of the measure and/or relevant citation(s). Measures presented with a name and/or citation are likely to have been used previously, which increases the likelihood—but, of course, does not guarantee—that they have some validity evidence (Flake et al., 2017). More realistically, providing a name and citation makes it easier for readers to find and critically examine prior evidence for validity (Flake et al., 2022). Including a citation to existing validity evidence is really the bare minimum for preexisting measures because it puts the burden on readers to go look for such evidence on their own. Ideally, authors would provide a brief summary of existing evidence for their chosen measures, including citations for further reading. Although researchers often translate or otherwise modify preexisting measures to align with their specific research questions (Flake et al., 2022), having a citation increases transparency by providing some background on where the measure has been previously used and whether it was modified for the present study. Indeed, tracking down undisclosed (or underdisclosed) modifications is easier when there is a name and/or source.
Another step authors can take to help readers evaluate the construct validity of their measures is to include specific example items. Exact items help readers evaluate quality and structure and whether items appear, at face value, to be reflective of the construct of interest. In addition, authors can report the specific number of items in a measure. The number of items is helpful for assessing construct validity because readers can see whether the measure is likely to contain enough items to capture the breadth of the construct of interest. 2 In social and personality psychology, multiitem questionnaires are often preferred to shorter scales, but there are constructs for which single-item measures may be appropriate (e.g., for the process of validating a single-item self-esteem measure, see Robins et al., 2001). The number of items in a scale is central to the scale’s internal consistency, an aspect of reliability that is relevant to validity.
Reporting reliability coefficients gives readers a sense of how noisy the measure is. Some reliability coefficients, such as Cronbach’s alpha or coefficient omega, capture the extent to which items on a scale statistically hang together (i.e., internal consistency), whereas other coefficients, such as test–retest reliability, capture the extent to which scores on the measure at one time relate to scores on that same measure at a subsequent time (during a time period when true scores are presumed to have stayed the same). Although reliability coefficients do not, on their own, ensure the validity of a measure (Hussey & Hughes, 2020), many psychometricians argue that reliability is necessary for validity (e.g., Cronbach, 1951). Therefore, reliability can provide evidence for or against construct validity. For example, if the measure is sum scored (and therefore, the authors’ goal was to use an internally consistent measure) and scale reliability is low, there are problems with the validity of that measure (McNeish, 2024). Because internal consistency can vary widely across samples, it is important to report reliability for the present sample in all studies to indicate that the measure is working as expected in each particular sample.
Other measurement characteristics suggest that there may be limited or even poor evidence of construct validity, and these characteristics should also be transparently reported so that readers can bring the necessary skepticism to interpreting results. For example, authors may develop their own measures (also known as ad hoc or “on the fly” measures) rather than using previously validated measures. Many ad hoc measures fall into the category of what Anvari et al. (2024) called “‘bastard’ measures of uncertain pedigree, conceived with limited planning and released into the literature without much commitment.” When authors create and use measures whose validity has not been previously examined and do not provide evidence of the validity of those measures themselves, readers get little information about the extent to which those measures reflect the construct of interest (Flake & Fried, 2020). Although researchers may need to develop their own measures for a variety of reasons (e.g., no measure exists to capture the construct of interest or existing measures are too long), ad hoc measures used without concurrent evidence of construct validity present a threat to construct validity.
Beyond reporting basic measure characteristics, authors can also make it easier for readers to assess construct validity by publicly sharing materials, including complete scales and scoring procedures, in an online supplement or a public repository (e.g., OSF). Publicly posting the full questionnaire provides direct access to some of the coded measurement-reporting practices (e.g., number of items, example items). Other measurement practices are useful, in part, insofar as they lead the reader to be able to access the full scale (e.g., scale name, citation), so open materials streamline that process. To incentivize material sharing, several journals have adopted “Open Materials” badges or requirements to share materials (Nosek et al., 2015). Psychological Science articles earning Open Materials badges increased from 15% in 2014 to 57% in 2021 (Bauer, 2022), and materials sharing is now required at the journal (Hardwicke & Vazire, 2024). The growth of Open Materials badges was shallower than growth in Open Data badges, indicating that some authors may be less willing to share their materials than they are their data (Bauer, 2022). However, this pattern may be specific to particular research areas based on different norms (e.g., around copyrighting scales) given that Open Materials badges are more common than Open Data badges at Clinical Psychological Science (Howard et al., 2024).
Transparent Measurement-Reporting Practices
Readers of psychology articles should critically interrogate the validity of inferences in articles they read, including construct validity (i.e., the validity of inferences about what measures are measuring). In the present study, we examined whether published psychology articles provide some basic information that readers can use to evaluate the evidence for construct validity of questionnaire measures, but we did not engage with the veracity of that evidence (e.g., we did not check a citation to confirm that the cited study provided relevant validity evidence). However, transparently reporting measurement characteristics is one step in the right direction to ameliorating quality uncertainty that erodes trust in psychological research (Vazire, 2017). Not reporting measurement characteristics leads to unsubstantiated claims, and unsubstantiated claims are uninterpretable (Flake & Fried, 2020; Higgins et al., 2025). Back in 1955, Cronbach and Meehl acknowledged the importance of transparent reporting about construct validity: The proper goals in reporting construct validation are to make clear (a) what interpretation is proposed, (b) how adequately the writer believes this interpretation is substantiated, and (c) what evidence and reasoning lead him to this belief. Without (a) the construct validity of the test is of no use to the consumer. Without (b) the consumer must carry the entire burden of evaluating the test research. Without (c) the consumer or reviewer is being asked to take (a) and (b) on faith. (p. 297)
Sixty-five years later, Hussey and Hughes (2020) warned social and personality psychologists that a pattern of underreporting measurement characteristics may represent widespread hidden invalidity: “Is the underreporting of tests of structural validity a mere nuisance, insofar as these measures are in fact valid, or, more troublingly, is there an abundance of invalid measures hiding in plain sight (i.e., hidden invalidity)?” (p. 176). Transparency about measures is even more important now given widespread measure proliferation across psychology (Anvari et al., 2024).
When researchers selectively report details about measures in a way that favors their interpretation (e.g., failing to disclose that they created a measure ad hoc), they are engaging in questionable measurement practices (Flake & Fried, 2020). Routinely publishing articles with little to no validity evidence can lead to justified skepticism about the research literature (Munafò et al., 2017; Vazire, 2017) and may contribute to the ongoing credibility crisis. Moreover, lack of measurement transparency makes it harder for readers to assess evidence of “schmeasurement” (Flake & Fried, 2020) and for researchers to conduct close replications of previous studies. By failing to provide important information about measures, inadequate measurement-reporting practices threaten the process of building and correcting science.
Several empirical studies have evaluated measurement-reporting practices in social and personality psychology (for an overview of study details, see Table 1), although they examined a substantially smaller and often more specialized sample of articles compared with the present study and did not examine change over time. These prior studies indicate that there is room for improved transparency. First, Flake et al. (2017) found that in 35 Journal of Personality and Social Psychology (JPSP) articles published in 2014, 53% of the questionnaire measures were accompanied by a citation, 7% were explicitly ad hoc, and the other 40% stated no source. A specific number of items was reported for 81% of the questionnaire measures; 30% of those scales had only a single item. Seventy-seven percent of the multiitem questionnaire measures were accompanied by some reliability coefficient, and the vast majority of those coefficients were Cronbach’s alpha. In 2020, Shaw et al. (2020) investigated measurement-reporting practices from the 28 original and replication studies used in Many Labs 2 (Klein et al., 2018) and found that the original studies frequently did not provide important information about construct validity; only 19% of item-based scales included a citation, and no validity evidence was cited for 71% of questionnaire measures (Shaw et al., 2020). Finally, examining the measures used in the 100 original studies from the Reproducibility Project: Psychology (Open Science Collaboration, 2015), Flake et al. (2022) found that 29% of questionnaires were accompanied by a citation and that 50% had only a single item; among multiitem measures, 61% reported a reliability coefficient. Overall, existing research on measurement-reporting practices suggests that many psychology articles contain inadequate information for readers to be able to assess the evidence of construct validity for key measures.
Comparison of Empirical Studies of Measurement-Reporting Practices in Psychology

Note: RPP = Reproducibility Project: Psychology.
The Present Study
In the present study, we examined the prevalence of various measurement-reporting practices and open materials in brief social-and-personality journal articles published in the journal Social Psychological and Personality Science (SPPS) from 2010 to 2020. In addition to extending previous empirical studies on this topic (Flake et al., 2017, 2022; Shaw et al., 2020), we used Flake and Fried’s (2020) “questions to promote transparent reporting of measurement practices” (p. 459) to help us decide which variables to code. In particular, scale name and citation speak to “Why and how did you select your measure?”; example items, number of items, single-item measure, and reliability speak to “How did you quantify your measure?”; and the ad hoc appraisal captures whether “you create[d] a measure on the fly.” We conducted our study in two samples, with Sample 2 being an internal direct replication of Sample 1. For both samples, we preregistered our research questions (Sample 1: https://osf.io/v7pwa; Sample 2: https://osf.io/bq2dj). 3
Research Question 1: prevalence of measurement-reporting practices
What is the prevalence of various measurement-reporting practices (i.e., scale name, citation, example items, number of items [and whether it is a single-item measure], reliability, use of ad hoc measures) and the availability of open materials in social-and-personality-psychology articles? This descriptive analysis provides an overview of the patterns of reporting practices in the literature and forms the basis for the inferential analyses in the subsequent research questions. We did not have any specific hypotheses.
Research Question 2: change in measurement-reporting practices over time
How have measurement-reporting practices and materials availability changed, on average, from 2010 to 2020 in social-and-personality-psychology articles? Although we could not test causal mechanisms, we suspected that the renewed attention toward measurement during the replication crisis and credibility revolution (Vazire et al., 2022) might have influenced how researchers report measurement details. If this assumption is accurate, we would expect to see an increase in transparent measurement practices over time. However, given the limited empirical evidence on this topic, we did not preregister any hypotheses.
Research Question 3: association between reporting practices and materials availability
How are measurement-reporting practices associated with materials availability? More specifically, are articles that include study materials more or less likely to have certain measurement-reporting practices? We had reason to believe this association could go in either direction. On the one hand, researchers who share materials openly may value transparency and therefore be more likely to also engage in other transparent reporting practices (e.g., reporting the number of items, reliability). On the other hand, researchers may reason that posting materials decreases the need to fully report details of their measures in the article itself. Again, the limited extant research meant we did not have any specific hypothesis about the association. We omitted this research question for our Sample 2 preregistration, but we nevertheless present the results for both samples for the sake of consistency.
The present study extends prior research in multiple ways (for an overview of how the present study compares with prior work, see Table 1). First, we examined 506 journal articles across a range of social-and-personality topics, which extends prior studies that examined a maximum of 100 articles (Flake et al., 2022) and articles in specific subgroups (e.g., from Many Labs 2; Shaw et al., 2020). Second, we coded a broad range of measurement characteristics that are useful for assessing construct validity and the prevalence of materials availability, which extends prior work that analyzed a subset of these practices. Third, we coded articles published every year from 2010 to 2020 and examined change over time, which has not been examined in previous studies. In addition, the decade from 2010 to 2020 was a period of tremendous methodological introspection in the field of psychology because of the replication crisis and the associated open-science movement and credibility revolution. This period included specific (but relatively little) attention to measurement practices (e.g., Flake et al., 2017). Although foundational articles highlighting the importance of construct validation have been around for many decades (e.g., Cronbach & Meehl, 1955; Loevinger, 1957), renewed attention to construct validity in the context of a broader push for greater transparency and fuller reporting of methods might have motivated researchers to improve measurement-reporting practices. We cannot speak to the causes of any observed changes with our observational research design, but we can examine whether there is a change over time consistent with this possibility.
Method
Across two samples, we examined 506 SPPS articles published between 2010 and 2020 (253 articles per sample). This study builds on an ongoing project, Surveying the Past and Present State of Published Studies in Social and Personality Psychology (SPPSPSSPP; for a full description, see Schiavone & Vazire, 2023), and thus, some of our design decisions were influenced by the goal of making our data set connect with the existing data for that project. We coded the presence of several measurement characteristics that are useful for assessing construct validity and whether authors provided access to study materials. All project materials, including the preregistrations, codebook, data files, and analysis scripts, are available on OSF: https://osf.io/cwf6m/. We report all deviations from the preregistrations in the main text and detail these deviations on OSF (https://osf.io/cwf6m/).
Samples
We initially decided to code 253 articles (23 per year between 2010 and 2020) for L. D. Khong’s honors thesis (Sample 1). Once the thesis was submitted, we decided to conduct an internal replication by coding another 253 articles that had not been previously coded (Sample 2). We chose SPPS as the journal from which to code articles given its coverage of social-and-personality-psychology research and to align with the ongoing SPPSPSSPP project. There is a conflict of interest with a subset of these articles for S. Vazire, who served as an associate editor of SPPS from 2013 to 2015 and as the editor-in-chief of SPPS from 2015 to 2019.
For each SPPS article, one study was randomly selected (if the article had more than one study). The randomly selected study was Study 1 for 68.4% of articles (Sample 1) and 61.3% of articles (Sample 2), Study 2 for 21.7% of articles (Sample 1) and 23.3% of articles (Sample 2), and Studies 3, 4, or 5 for 9.8% of articles (Sample 1) and 15.5% of articles (Sample 2). Across both samples, we coded 47% of articles published in SPPS from 2010 to 2020. All articles were coded by a single coder except for a subset of 60 articles that were coded by two coders to estimate reliability (see below).
We defined a questionnaire measure as a self- and/or informant-report measure that had a closed response scale (e.g., Likert type, binary), not including demographic variables. Tests with a right or wrong answer were not counted as questionnaire measures, and neither were manipulation or attention checks. In Sample 1, 210 of the 253 studies (83%) had at least one questionnaire measure, and the remaining 43 studies (17%) had no questionnaire measures. In Sample 2, 215 of the 253 studies (85%) had at least one questionnaire measure. In total, there were 558 questionnaire measures in Sample 1 (measures per study: M = 2.66, SD = 1.61) and 640 questionnaire measures in Sample 2 (measures per study: M = 2.97, SD = 1.86).
Pilot testing
All coding was completed using Qualtrics. Before coding any articles, we developed a codebook. To test and improve this codebook, we performed two rounds of pilot tests, each on a set of articles published in SPPS between 2015 and 2017 that were randomly sampled. All four authors participated as coders in the pilot tests. For the first round of pilot testing, we randomly sampled six articles and coded all the questionnaire measures across all studies. For the second round of pilot testing, we randomly sampled 10 articles and coded only the first study for each because the follow-up studies often contained the same questionnaire measures as the first study. Following the completion of each round of pilot testing, all four coders met to discuss any uncertainties or disagreements regarding the coding process and made modifications to the codebook when necessary. The final codebook is included on the project OSF page. Of the piloted articles, two were also randomly selected and included as part of Sample 1.
Coding
The Qualtrics surveys used for data entry are available at https://osf.io/78nj2 (Sample 1) and https://osf.io/d3kmh (Sample 2). In Sample 1, L. D. Khong was the coder on 60% of articles (all of which were articles in which the randomly selected study was the first study), and K. M. Lawson was the coder on the remaining 40% of all articles, including all articles for which the randomly selected study was not the first, because coding the subsequent studies required more expertise, as we discovered in piloting. In Sample 2, K. M. Lawson coded 80% of articles, and S. Vazire coded 20% of articles. All measurement-reporting practices were coded for one randomly selected study in an article at the level of the measure; materials availability was coded at the level of the article. We set the Qualtrics survey to limit the coding to eight questionnaire measures per study. At the measure level, coders indicated the absence (“no”) or presence (“yes”) of seven variables (scale name, citation, example item, number of items, single-item measure, reliability, ad hoc measure). In addition to the no/yes options, two variables also included a third response option: The ad hoc variable included “Can’t tell,” and the single-item variable included “I don’t know” as options. These third options were included only for the two variables for which no/yes identification was sometimes unclear during piloting, and these values were excluded in the analyses (i.e., recoded as missing data). Coders also provided additional details for some variables. Specifically, if there was a scale name, coders provided the reported scale name in a text box, and if there was a citation, coders recorded the citation in a text box. If reliability information was reported for a given measure, coders also selected the types of reliability reported (i.e., “alpha/Cronbach’s alpha,” “omega,” “simple correlation,” “test-retest reliability,” “something else”). Aligned with Flake et al. (2017), coders focused on measure details presented in the method sections, although they also read into the results in case reliability coefficients were presented there.
At the article level, coders selected (a) whether the authors stated that information about instruments, measures, or materials was available in the supplemental materials and (b) whether the authors stated that open materials were publicly available online. As preregistered, these two variables were combined into a single “materials availability” variable that was coded as “yes” if either of the two variables were coded as “yes.” To allow readers to quickly and easily consult the measurement practices coded by our team for a particular article, we uploaded a spreadsheet on OSF that includes the article name, author(s), and coded variables for each measure of the randomly selected study (https://osf.io/83g2b).
For 30 articles from both Sample 1 and Sample 2, a second coder coded the articles to allow us to estimate intercoder reliability based on percentage agreement. Sample 1 agreement ranged from 79.0% to 100% (between L. D. Khong and K. M. Lawson), and Sample 2 agreement (between K. M. Lawson and S. Vazire) ranged from 82.0% to 100% (for the pairwise percentage agreement for each variable, see Table 2). Disagreements in the coded data for articles coded by multiple coders were resolved by discussing the issues until both coders unanimously agreed.
Intercoder Percentage Agreement for Each Variable

Note: These intercoder percentage agreements were calculated based on codings from two coders on a subsample of 30 articles in each sample.
Statistical analyses
Analyses were conducted in RStudio using R (Version 4.2.3 Patched; R Core Team, 2023). For the inferential analyses, we used the lme4 (Bates et al., 2015) and lmerTest packages (Kuznetsova et al., 2017) to perform logistic regressions and multilevel logistic regressions with random intercepts.
Results
Research Question 1: prevalence of measurement-reporting practices
Table 3 shows the frequency (n) and proportion (%) of measures that include scale name, citation, example items, number of items (and whether it was a single-item measure), reliability coefficient, and whether the measure was ad hoc. Reassuringly, the descriptive results are similar in both samples, which provides a check on the reliability and robustness of our results.
Prevalence of Measurement-Reporting Practices
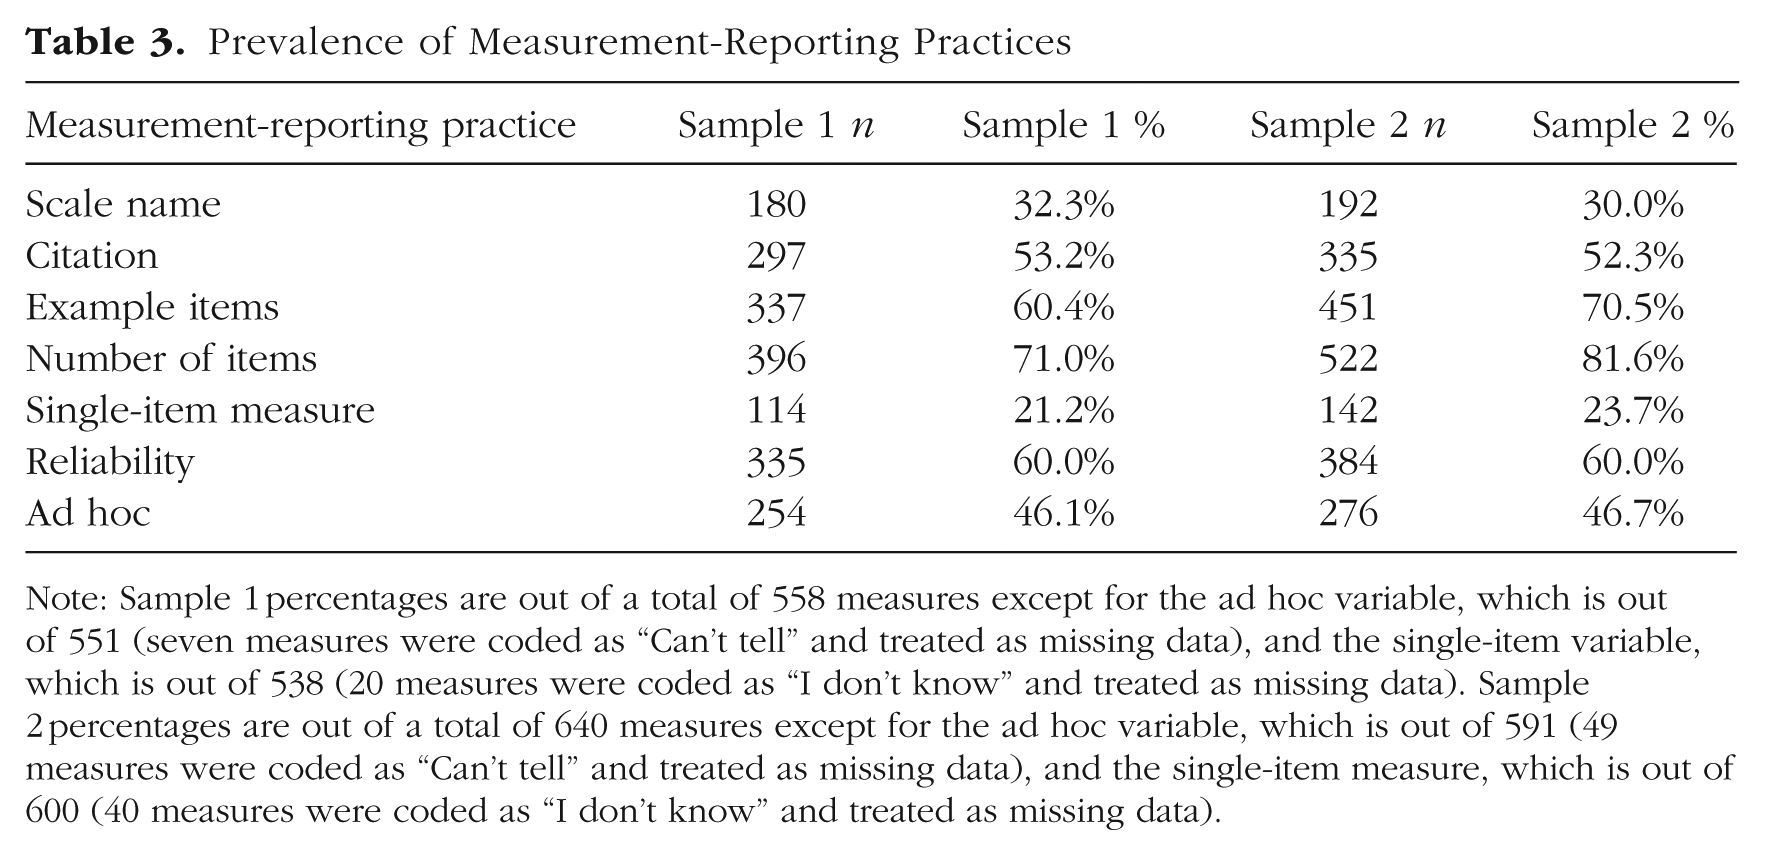
Note: Sample 1 percentages are out of a total of 558 measures except for the ad hoc variable, which is out of 551 (seven measures were coded as “Can’t tell” and treated as missing data), and the single-item variable, which is out of 538 (20 measures were coded as “I don’t know” and treated as missing data). Sample 2 percentages are out of a total of 640 measures except for the ad hoc variable, which is out of 591 (49 measures were coded as “Can’t tell” and treated as missing data), and the single-item measure, which is out of 600 (40 measures were coded as “I don’t know” and treated as missing data).
The most commonly reported measurement characteristic was the number of items in the scale (Sample 1: 71.0%; Sample 2: 81.6%), followed by example items (Sample 1: 60.4%; Sample 2: 70.5%). Reliability was also frequently reported; Table 3 shows the results for all measures (60.0% in both samples), but the prevalence of reliability information was even higher for the subset of measures that had multiple items. 4 Of the multiitem measures, reliability was reported for 75.7% of measures in Sample 1 and 79.7% of measures in Sample 2. Of the measures that included a reliability coefficient, 90.4% in Sample 1 and 87.0% in Sample 2 were Cronbach’s alpha. Test–retest reliability was reported for only one measure in either sample. Between one-fifth to one-quarter of measures were single-item measures (Sample 1: 21.2%; Sample 2: 23.7%), and reliability was rarely reported for these measures—seven times in Sample 1 (6.1% of single-item measures) and 13 times in Sample 2 (9.1% of single-item measures).
Approximately one-third of the measures in our sample reported a scale name (Sample 1: 32.3%; Sample 2: 30.0%), which suggests that these measures had been previously created and in an ideal world, validated. However, scale names are not evidence of the construct validity of a measure; the scale name does not necessarily tell readers about a measure’s contents or what construct it actually captures (more likely, the name captures what the creators intended to measure), and just because measures have the same name does not mean that they are the same measure (for examples of different scales that share the same name, see Elson et al., 2023). In addition, it is common for existing measures not to have formal names (i.e., names that would traditionally be capitalized in text and might have an accompanying acronym, such as the Rosenberg Self-Esteem Scale [RSES]; Rosenberg, 1965), which is supported by the fact that a much greater percentage of measures in our sample—more than half—included a citation. Finally, authors may have modified existing measures but still used the same scale name when describing the modified measure.
About half of measures were accompanied by a citation (Sample 1: 53.2%; Sample 2: 52.3%). Similar to a scale name, the presence of a citation does not ensure anything about there being evidence supporting the validity of a measure. Based on our coding procedures, we cannot speak to whether the reference cited is relevant to the measure’s validity. Even if the cited article is relevant and purports to provide evidence for the measure’s validity, that evidence may not be very good or very relevant. But even with this incredibly low bar to reach—the mention of any citation in the discussion of a measure—almost half of articles did not cite anything about their measures.
Most of the other half of measures were coded as ad hoc (Sample 1: 46.1%; Sample 2: 46.7%). The “ad hoc measure” category does not include measures that were modified from their original version, so these findings suggest that a large proportion of measures in this population have little or no validity evidence reported. A tiny minority of measures—1.3% from Sample 1 and 2.2% from Sample 2—were coded as both having a citation and being ad hoc. 5 The fact that having a citation and being ad hoc measures were near opposites could be a consequence of how our coders adjudicated between whether measures were ad hoc. Anecdotally, authors rarely explicitly stated that they used ad hoc measures, and instead, coders had to use heuristics when deciding whether a measure was ad hoc. The most useful heuristic was whether there was an accompanying citation; therefore, absence of a citation and a measure being deemed ad hoc likely did not capture two distinct things—which is likely why prior studies operationalized them as two sides of the same coin in their coding schemes (e.g., Flake et al., 2017).
For the reported availability (at the article level) of supplemental materials that discuss measures and open materials, see Table 4. The majority of articles in both samples (74%) did not report supplemental measure materials or open materials on an online repository.
Prevalence of Materials Availability

Note: The variable “any materials availability” is a count of all articles coded as having supplemental materials, open materials, or both. Sample 1 percentage was calculated out of 210 articles. Sample 2 percentage was calculated out of 215 articles.
Research Question 2: change in measurement-reporting practices over time
To investigate the change in measurement-reporting practices and materials availability over time, we conducted separate logistic regressions for each reporting practice. Recall that as preregistered, the two materials-availability variables (supplemental materials and open-materials link) were combined into a single materials-availability variable that was coded as “yes” if either of the two variables were coded as “yes.” This variable was the only article-level reporting practice, and we examined it by conducting a logistic regression with publication month as the continuous predictor and materials availability as the binary outcome. For the measure-level reporting-practice variables, measures were nested within articles. We conducted a separate multilevel logistic regression for each measure-level variable with measure (Level 1) nested within article (Level 2). For each model, the measure-level variable was the binary outcome, publication month was the continuous predictor, and we included a random intercept shared by measures nested within the same article (DOI). In all of these regressions, the predictor (time) was operationalized as the number of months the article was published after January 2010. We report the expected value based on the logistic regression model of a measure in January 2010 being accompanied by each measurement-reporting practice and compare this value with the probability of a measure in December 2020 being accompanied by that reporting practice. To aid meaningful interpretation of these trends, we also report the expected date of 90% adherence given the current estimated rate of change (i.e., At the current estimated rate of improvement, how many years would it be until 90% of SPPS articles report a given measurement practice?). These analyses estimating date of 90% adherence were suggested by a reviewer and were therefore not preregistered.
Regression results are shown in Table 5 (for graphical representations of the results, see Figs. 1 and 2). Most variables did not show a change over time. However, materials availability significantly increased from 2010 to 2020 in both Sample 1 (B = 0.032, 95% confidence interval [CI] = [0.021, 0.044], p < .001) and Sample 2 (B = 0.029, 95% CI = [0.019, 0.040], p < .001). The effect size for this finding was substantial: There was only a 3% to 5% probability of an SPPS article published at the beginning of 2010 having some kind of open materials, and this probability increased to 63% to 65% at the end of 2020. At this estimated rate of change, 90% of SPPS articles would include materials availability sometime in 2025. An important factor to consider when interpreting these findings is that when S. Vazire became editor-in-chief of SPPS in 2015, she published an editorial that included the statement, “We encourage authors to make use of resources such as the Open Science Framework for making materials, data, and code publicly available” (Vazire, 2016; published online on September, 29, 2015). Although openly sharing materials was not a requirement for publication in SPPS, this statement along with other changes (e.g., requiring authors to disclose all measures relevant to the variables of interest) may have affected authors’ behavior with respect to sharing materials. S. Vazire’s term as editor-in-chief ended in 2019, and articles accepted by that team continued to be published into 2020.
Regressions With Time Predicting the Prevalence of Measurement-Reporting Practices and Materials Availability

Note: For the first seven rows, analyses consisted of a multilevel logistic regression with measures nested within articles. For the last row (“Materials Availability,” a combination of the two article-level variables related to materials availability), the analysis consisted of a logistic regression because materials availability was coded at the level of the article. The “Outcome Probability” represents the probability that the outcome category is present in a measure (or in an article, in the case of materials availability) in January 2010 versus December 2020. Time to 90% adherence uses the logistic regression model to predict the date when 90% adherence is predicted to be achieved based on the trend from 2010 to 2020. The model with example items for Sample 1 did not converge, and we do not report the results because model nonconvergence indicates that the results are not trustworthy. CI = confidence interval.
Time-to-adherence values for single-item measures and ad hoc measures report time to 10% adherence because reducing the prevalence of these practices is more desirable. p-values below .05 are bolded.

Change in the probability of materials availability over time.
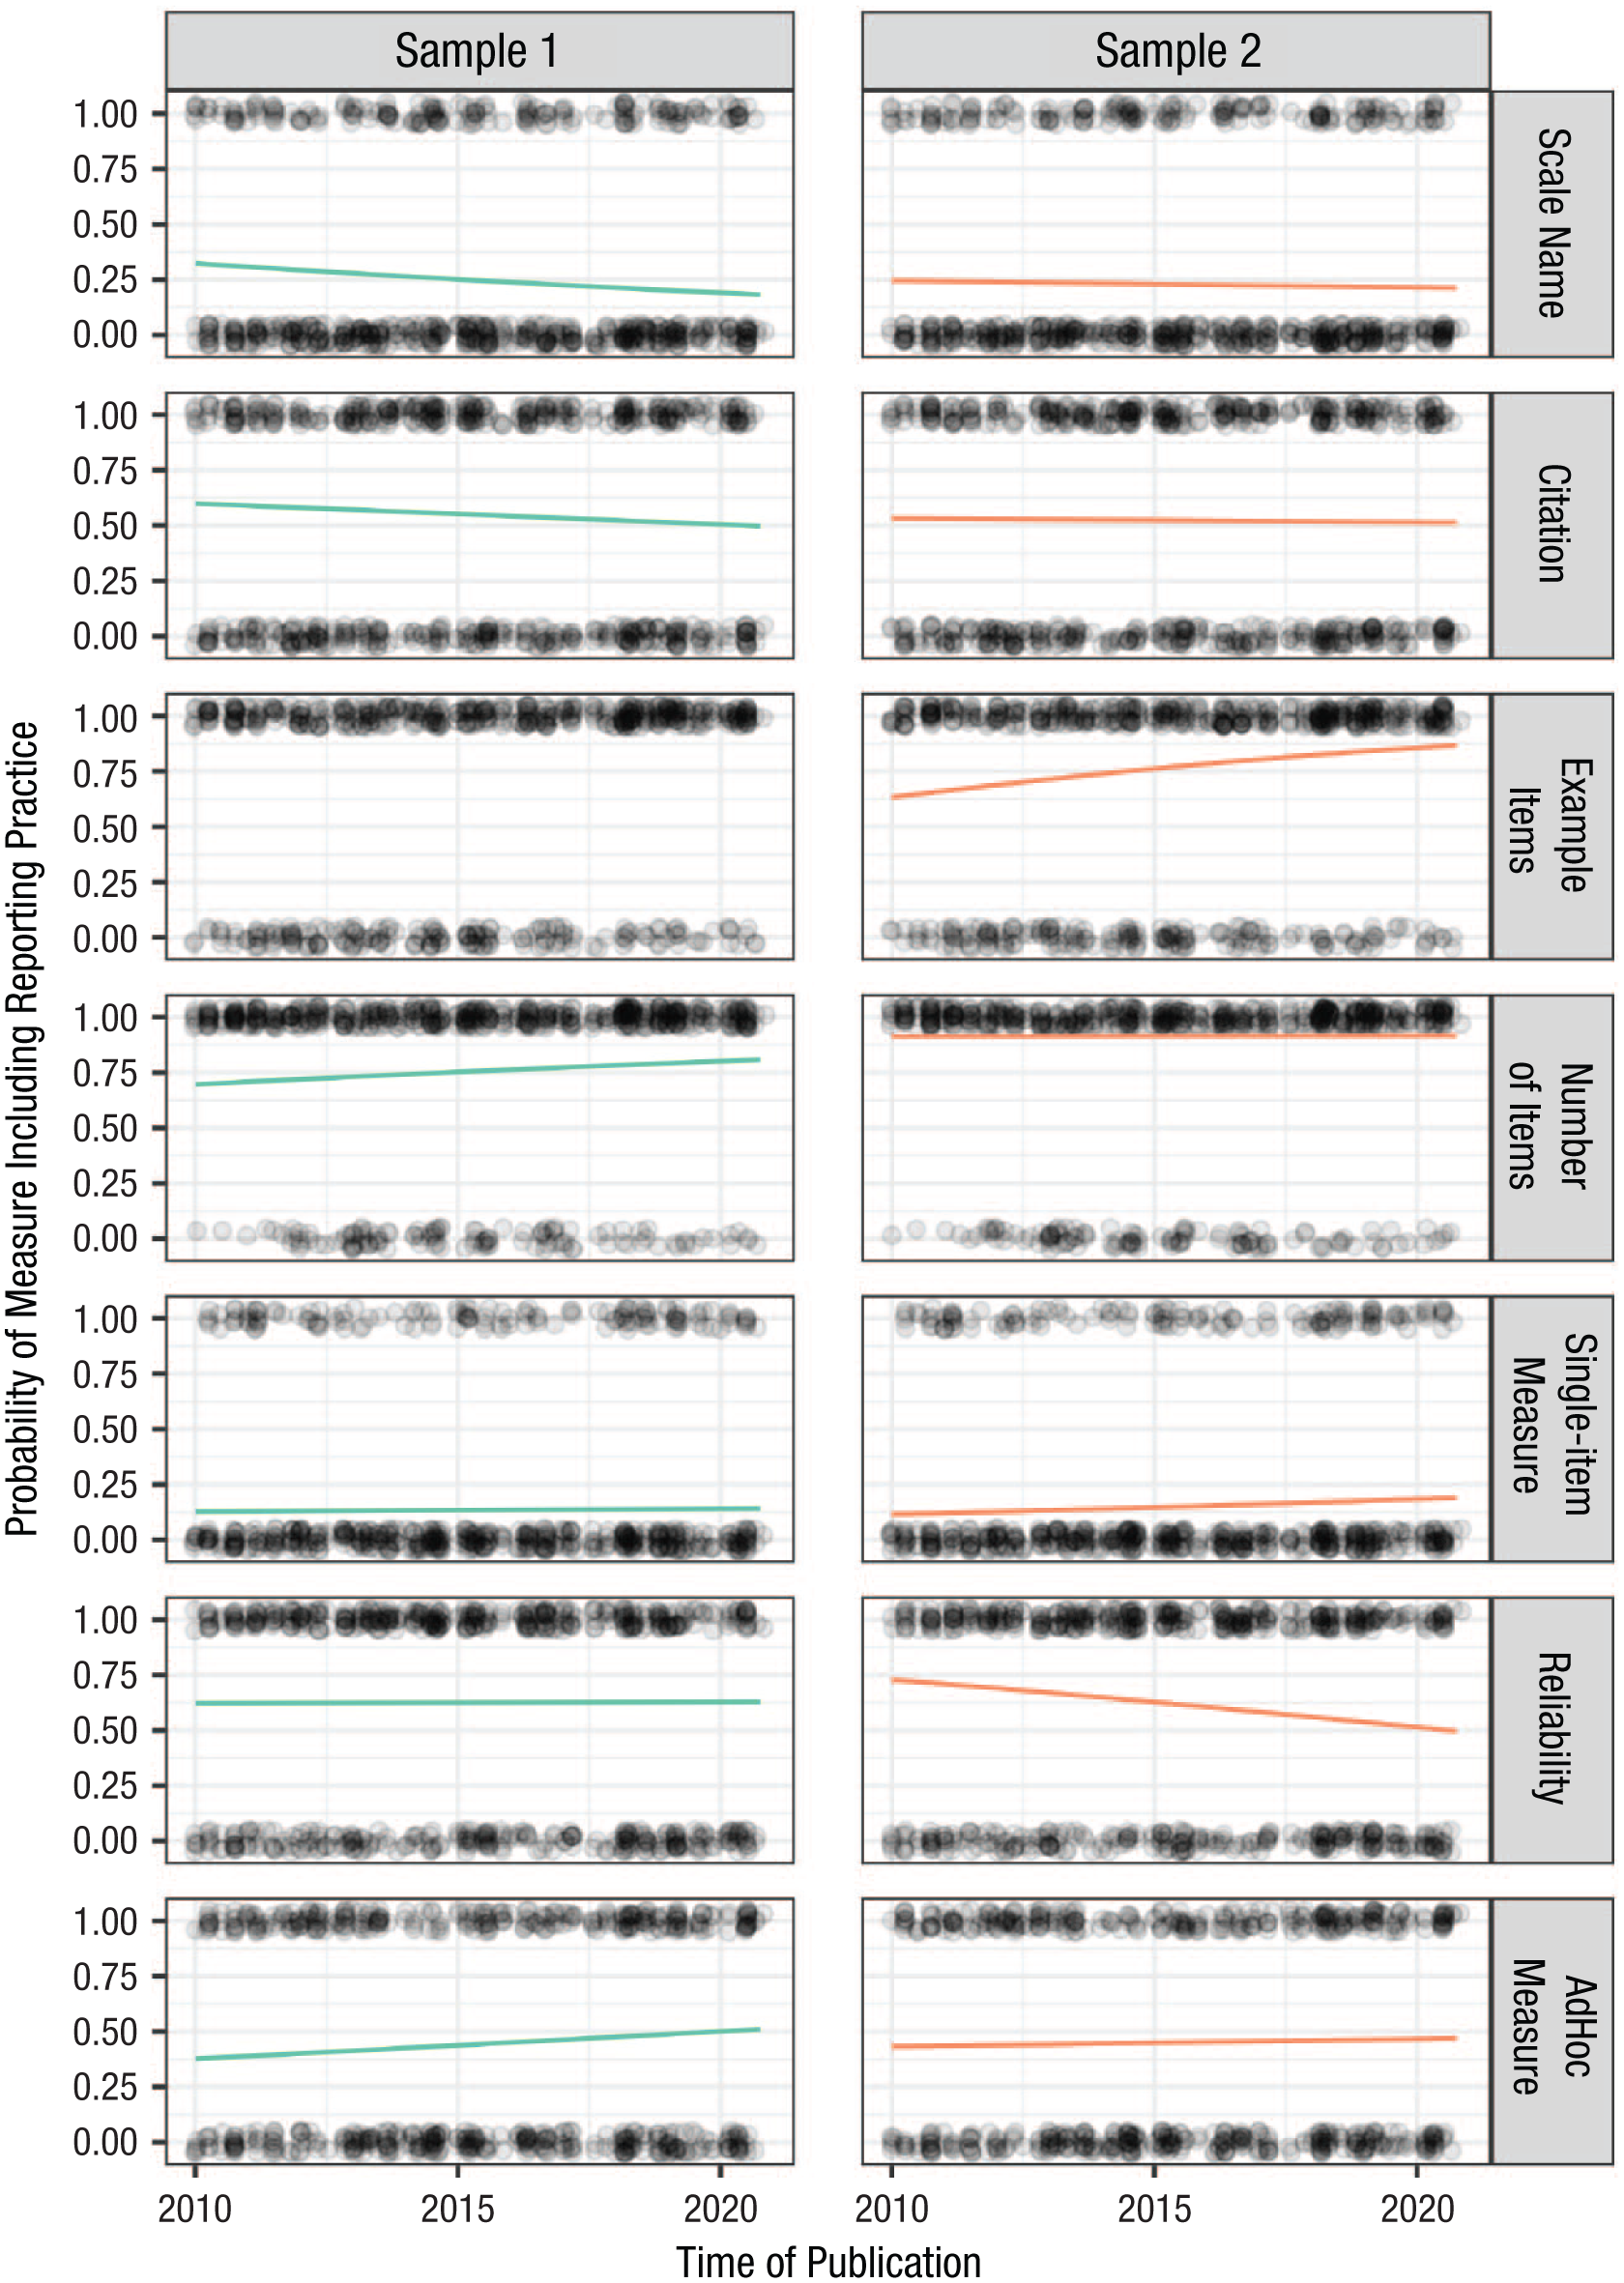
Changes in the predicted probability of measurement-reporting practices over time. Lines represent the predicted probability for each outcome according to each model that was fit.
Although we did not preregister this analysis, we also looked at the two individual variables that were combined to create the materials-availability variable. The estimated prevalence based on the model showed increases in the availability of measure details in supplemental materials over time (January 2010: p = .06 vs. December 2020: p = .34) but not as drastic a change as the increase in the estimated availability of materials in an open repository over the same period (January 2010: p = .001 vs. December 2020: p = .50). Because the primary open repository—the OSF—was founded in 2012, it was much more difficult to post materials to a repository in 2010 or 2011. However, these data indicate that there was relatively widespread adoption of the OSF across the decade, suggesting that it may be easier or preferable for authors to publicly share materials online rather than in supplemental materials.
In addition, the change over time for example items was significant for Sample 2 (B = 0.011, 95% CI = [0.002, 0.019], p = .016), suggesting a higher probability of a measure in 2020 being accompanied by an example item compared with a measure in 2010. At this estimated rate of change, 90% of SPPS articles would include example items by May 2023. However, there is reason to be cautious of this finding; the model examining change over time for example items did not converge for Sample 1, so we have no evidence that this finding is robust.
None of the other measurement-reporting practices showed significant changes from 2010 to 2020. We did not preregister inferential criteria for interpreting null results (e.g., smallest effect sizes of interest), which we now regret. Keeping this in mind, we can look at the 95% CIs and the consistency of results across the two samples and attempt a cautious, post hoc analysis of these findings. The estimated rate of change from the nonpreregistered analyses suggests that 90% of SPPS articles would report number of items by 2034, according to the results of Sample 1, and was already during the study period in Sample 2. Less optimistically, the reporting of measurement reliability would occur for only 90% of SPPS articles in 700 years according to the estimated rate of change from Sample 1, and it would never be achieved in Sample 2. Likewise, given that the estimated rate of change is in the wrong direction, the reporting of scale names and citations would never reach 90% adherence, and the use of ad hoc measures and single-item measures would never reach 90% adherence to “best” practices (i.e., not using ad hoc or single-item measures). Although all of the results replicated across both samples in terms of direction and significance, there is variability in effect sizes between Sample 1 and Sample 2, so caution should be taken when interpreting these findings.
Research Question 3: association between reporting practices and materials availability
To examine the association between each measurement-reporting practice and materials availability, we performed separate multilevel logistic regressions for each measurement-reporting practice (for results, see Table 6) with materials availability as the binary predictor and the reporting practice as the binary outcome and measures (Level 1) nested within articles (Level 2). We included a random intercept shared by measures nested within the same article (DOI). As for the previous research question, the materials-availability variable was a combination of the supplemental-materials variable and the open-materials-link variable. However, we could have reversed the predictor and outcome; unlike traditional regression models, we did not have a clear predictor or outcome.
Multilevel Logistic Regressions for Measurement-Reporting Practices (Outcome) and Materials Availability (Predictor)

Note: Materials availability (article level) is the predictor in each analysis. “Outcome Probability” is the probability of authors reporting the outcome measurement characteristics given that they do not or do make their materials publicly available. CI = confidence interval; OR = odds ratio, which was calculated by taking the exponent of B (log odds). p-values below .05 are bolded.
Overall, there was not much evidence of an association between materials availability and measurement-reporting practices—we did not find many differences in measurement-reporting practices between articles with or without materials available. Figure 3 shows the descriptive differences in measurement-reporting practices across materials availability. Among the 14 results, scale name was significantly more likely to be reported when materials were not available in Sample 1 (B = −1.10, 95% CI = [−1.94, −0.28], odds ratio [OR] = 0.33, p = .009), and number of items was more likely to be reported when materials were not available in Sample 2 (B = −1.13, 95% CI = [−2.32, −0.25], OR = 0.32, p = .013). The result for scale name may be driven by authors being less likely to openly share named (and perhaps more likely, copyrighted) measures. However, we are wary of interpreting these effects because the effect did not replicate between samples (in the sense of a significant result being obtained in both). We are also reluctant to interpret the nonsignificant results as evidence of absence because of likely low power stemming from having an unbalanced dichotomous predictor and inconsistent results across samples. Overall, we do not have enough evidence to say whether authors are more likely to report specific details about their measures when materials are or are not available, although we can rule out large differences.
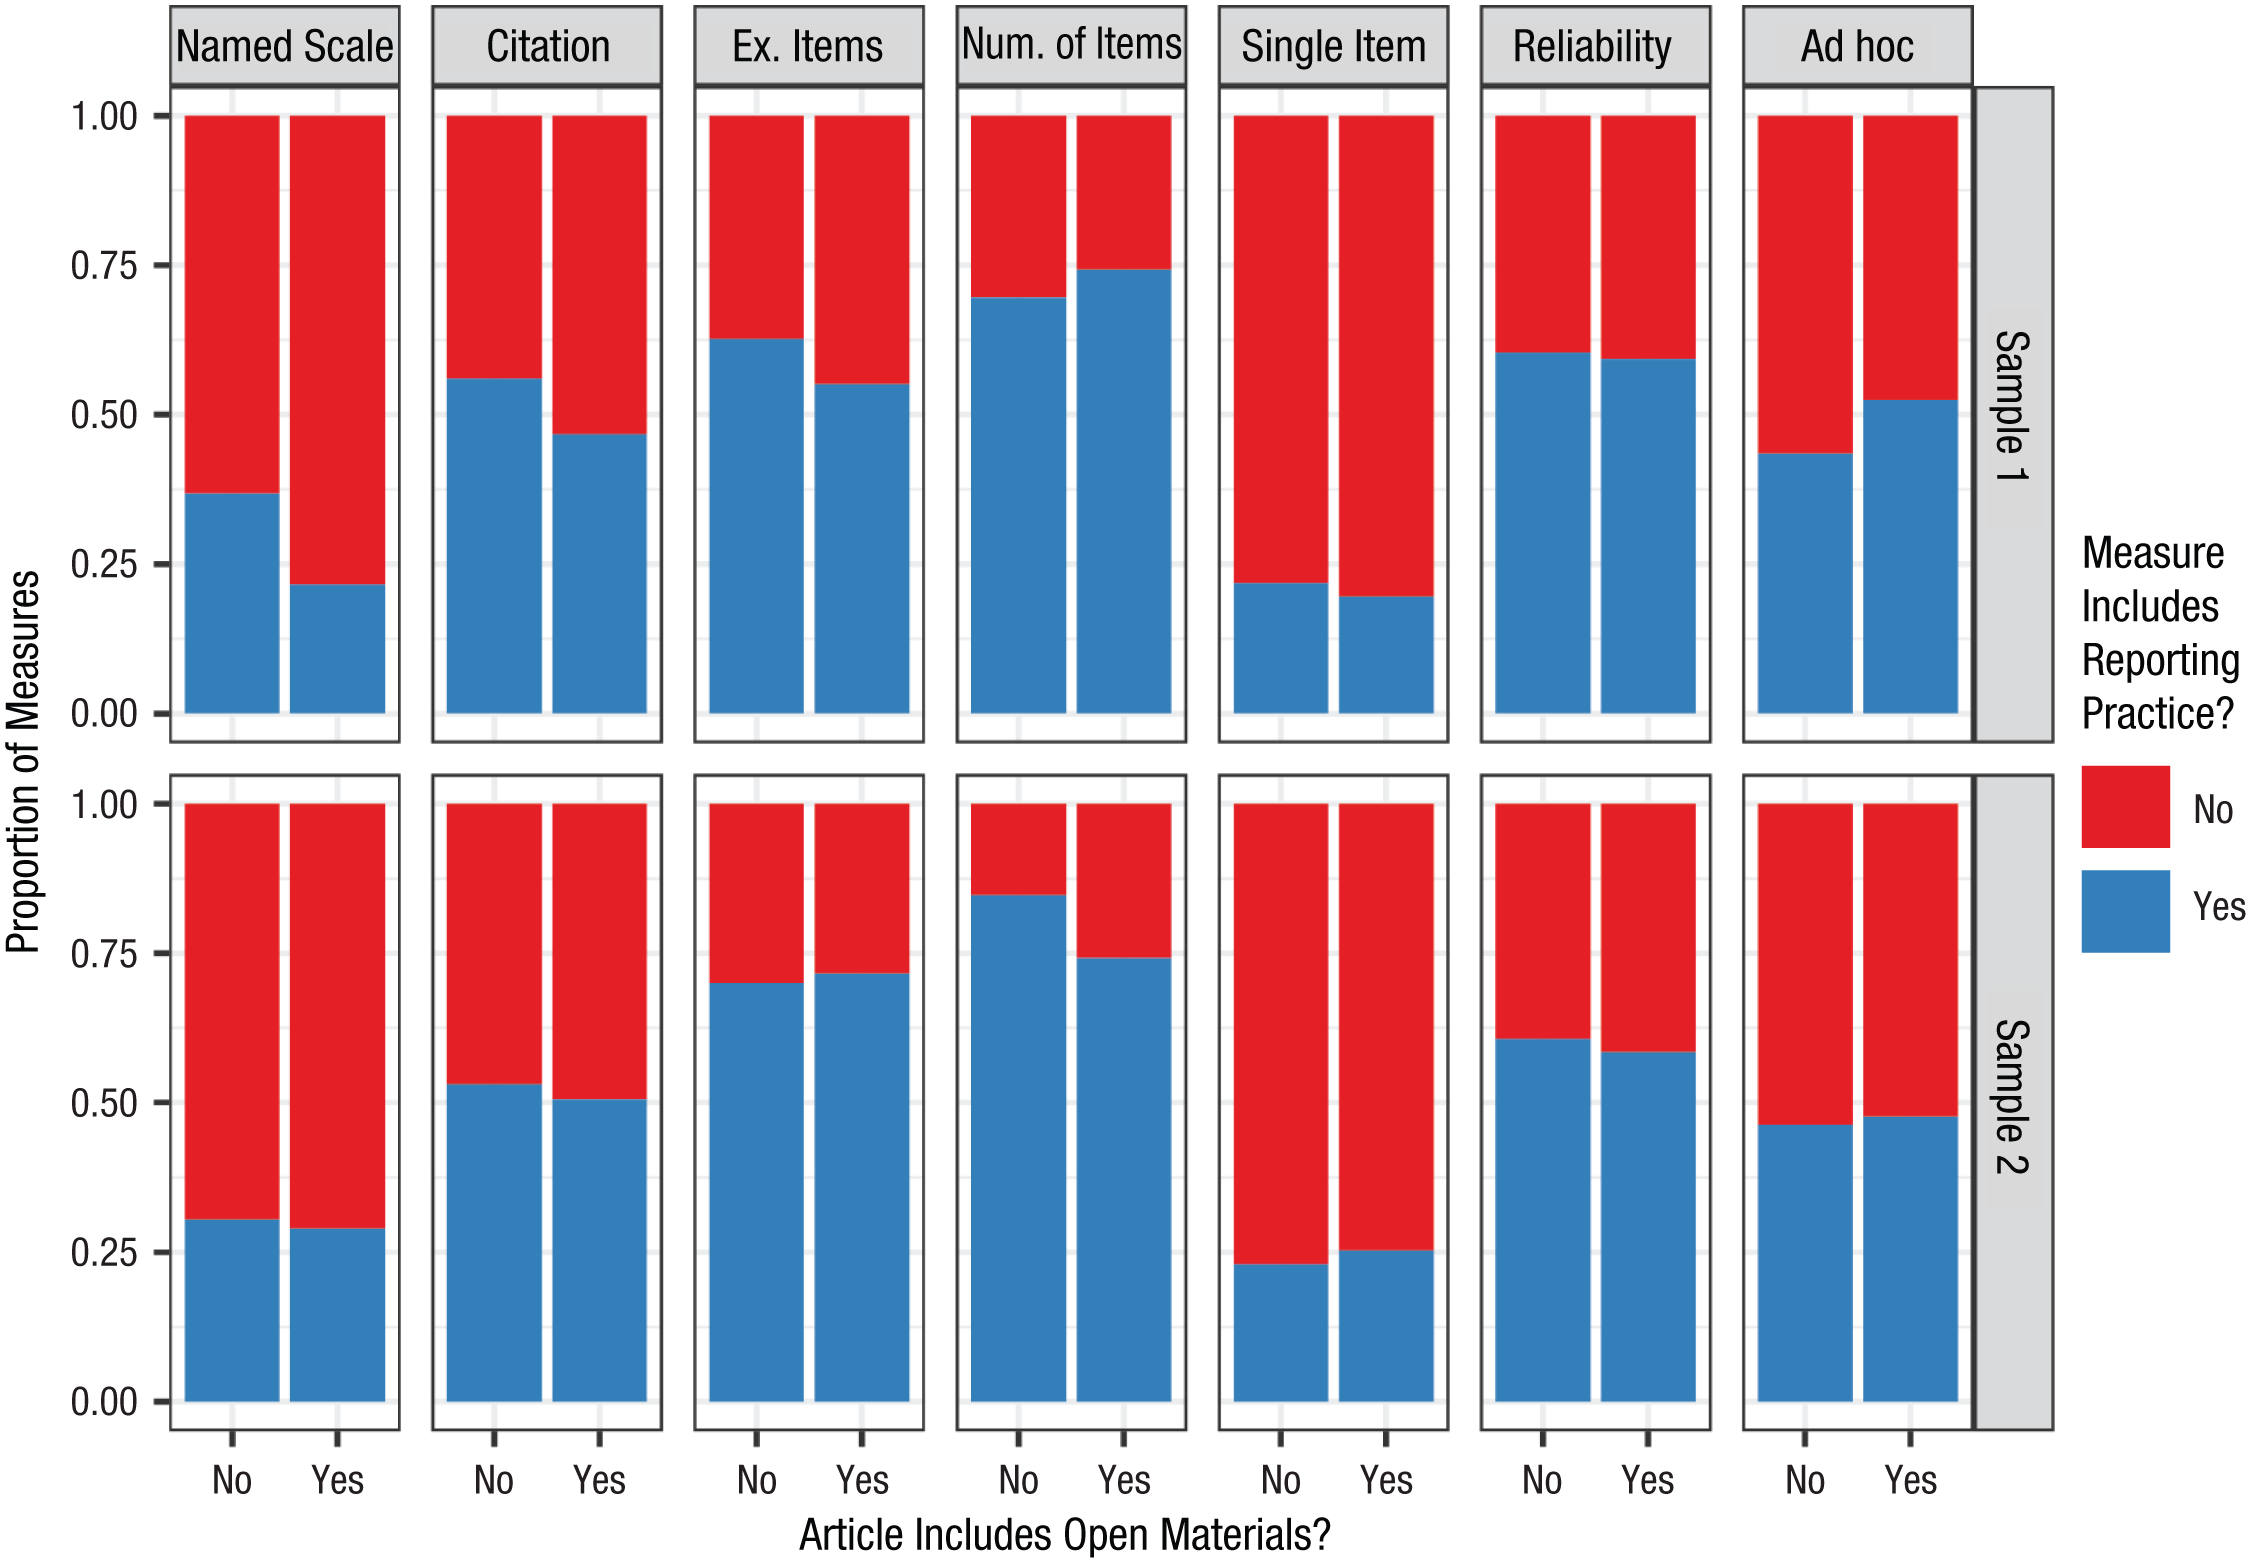
Differences between proportion of measures with reporting practices separated by open materials.
Discussion
In the present study, we examined measurement-reporting practices in 506 social-and-personality-psychology journal articles published in SPPS between 2010 and 2020. SPPS has a strict 5,000 word limit, which may result in limited space for authors to describe and justify each measure in detail. However, even in brief articles, it is important that quantitative psychological studies communicate information about measures for readers to weigh the strength of evidence for construct validity when interpreting findings. Given the journal’s word limit, we chose which measurement-reporting practices to code based on their brevity, straightforwardness, and likelihood of being used to communicate evidence of construct validity (e.g., as demonstrated in previous studies, such as Flake et al., 2022); none of the measurement practices we coded require a great deal of technical expertise or many words to report.
Before discussing the results in more detail, we must reiterate some limitations of our study, most notably that the measurement-reporting practices we examined do not capture all aspects of construct validity (in fact, many of the characteristics we coded do not convey direct evidence of construct validity evidence at all); nor did we verify the veracity of validity evidence provided by authors. Psychologists have long lamented that demonstrating the construct validity of a particular measure instantiation is a difficult task, and the measurement-reporting practices we coded are wholly insufficient for capturing construct validity in all of its complexity (Loevinger, 1957). Indeed, “construct validity can be established only by convergence of several lines of evidence” (Loevinger, 1957, p. 685), and we not only missed entire lines of evidence (e.g., factor structure, convergent and discriminant validity) but also examined each reporting practice in isolation rather than studying their convergence. In addition, construct validity pertains to interpretations of measurements rather than measures in and of themselves (Clark & Watson, 2019). Providing broad evidence for the construct validity of a measure in general does not necessarily support its use in a particular sample (Messick, 1995). Moreover, most of the coded measurement-reporting practices, besides the presence of a citation and perhaps scale name, highlight the empirical and quantitative aspects of construct validation instead of the equally important theoretical aspects (Alexandrova & Haybron, 2016). We also did not confirm the accuracy of any measurement-reporting practice when coding them; for example, we did not check whether a given citation referenced a study reporting construct-validity evidence for the stated measure; we merely coded whether the citation was present. For all of these reasons, our results likely provide a higher-end estimate compared with genuine, complete, high-quality evidence supporting construct validity of the measures in social-and-personality articles. Finally, we reiterate that S. Vazire has a major conflict of interest with and vested interest in this research because she was an associate editor (2013–2015) and then editor-in-chief (2015–2019) of the journal we examined, SPPS. With these relevant caveats in mind, we next dive into our findings.
Prevalence of measurement-reporting practices
Citations are a potentially useful indicator of construct validity, but they put most of the burden on readers to find and evaluate. Ideally, citations point readers to a specific location (i.e., another article or report) that the authors believe provides information about the strength and quality of construct-validity evidence for a measure, although citations may also simply provide credit to test creators. The percentage of measures with a citation in our study (Sample 1: 53%; Sample 2: 52%) is nearly identical to the percentage reported by Flake et al. (2017) 6 and substantially higher than the 19% reported in Shaw et al. (2020). Finding that just more than half of measures include a citation leads to a disappointing flipside; almost half of measures lacked any reference to prior work that could provide evidence supporting their construct validity.
Although increasing the prevalence of measures accompanied by a citation pointing to construct-validity evidence is important, the field must be cautious that requiring this kind of validity evidence (e.g., through journal policies or reviewer checklists) could result in what Hussey and Hughes (2020) labeled “v-hacking” (for “validity-hacking”). Because many social-and-personality measures have not been subjected to substantial tests of validity and authors are strongly motivated to conclude that their measures are valid, simply requiring a citation could lead researchers to engage in negligent or malicious citation practices, such as including a citation to an article that does not provide validity evidence for the measure or to an article that the authors have not read (for a discussion about problems stemming from poor citing decisions, see Lawson et al., 2025). Moreover, the cited article may present weak evidence of construct validity (or even evidence that undermines the validity of the measure) or evidence of validity for the measure when used for different purposes or in different populations to the authors’ own use. For example, a systematic scoping review by Higgins et al. (2024) found that 63% of studies reported neither calculated nor cited validity evidence for the Reading the Mind in the Eyes Test, and those that did cite a relevant study often included a validation study with significant limitations. And as mentioned above, authors may modify existing measures, rendering the citation to the original measure partially (or wholly) irrelevant. However, none of these issues should be a reason to shy away from strongly encouraging authors to include a suitable citation to previous evidence of validation when such evidence exists. Future studies should evaluate the quality and relevance of evidence for construct validity provided in these cited articles, and researchers should validate commonly used measures so there is sufficient validity evidence to cite.
A majority of measures included at least one example item, which means that readers could evaluate the face validity of at least one item. 7 As far as we know, no previous studies of measurement-reporting practices in social and personality psychology have coded the presence of example items; the present study provides a fairly high estimate of this reporting practice. The fact that reporting example items was among the most common measurement-reporting practices in our study is perhaps unsurprising because it is quite simple to implement—it involves merely copying an item from the existing study materials into the article.
The most common measurement-reporting practice in our study was reporting the number of items in the measure. Of the measures for which coders could discern the number of items on the scale, just more than 20% of measures contained only a single item, which is slightly lower than estimates from previous studies (e.g., Flake et al., 2017, reported 30% single-item measures). This disparity could be due, in part, to our focus on measures that were central to the authors’ research questions rather than variables that were incidentally measured. In a subsequent article by Flake et al. (2022), so-called “secondary” measures more often included only a single item (63%) compared with “primary” measures (39%).
Of all of the multiitem measures in our sample, the majority were accompanied by some kind of reliability coefficient. This prevalence is on par with what was reported by Flake et al. (2017) and higher than what was found by Flake et al. (2022). By and large, Cronbach’s alpha was the most commonly reported reliability coefficient. Although the field’s overwhelming reliance on Cronbach’s alpha is unsurprising, it is concerning based on its documented limitations (Flake et al., 2017; Hussey & Hughes, 2020; Sijtsma, 2009). Only one single measure that we coded included a test–retest reliability coefficient. This finding is concerning given that test-retest reliability is most aligned with the colloquial notion of reliability (i.e., the extent to which a measure produces similar estimates across multiple instantiations when the true score has not changed). This near-ubiquitous omission may be because most SPPS studies are cross-sectional, making it harder to administer the same measure twice without participants remembering their answers, or it may be a by-product of exclusively coding questionnaire measures in the present study, in which test–retest reliability is higher compared with cognitive-behavioral measures (e.g., for a comparison of test–retest reliabilities of self-report vs. behavioral tasks assessing self-regulation, see Enkavi et al., 2019). Still, the lack of attention to test–retest reliability is concerning.
Overall, the prevalence rates of various measurement-reporting practices in the present study suggest that many measures in published social-and-personality-psychology articles are not accompanied by even minimal attention to construct validity. Given the widespread acknowledgment of the importance of construct validity and the relative ease of reporting the characteristics coded in the present study, why is the field so far from 100% adherence to these fairly basic measurement-reporting practices?
In 2020, Hussey and Hughes identified two systematic barriers motivating poor reporting of evidence related to construct validity. First, there are many researcher degrees of freedom in selecting and adapting measures, and because of the lack of strong norms around measurement-reporting practices, researchers may simply not realize that transparency about measures is important. These assumptions are reinforced when authors have articles published while omitting important details; reviewers and editors are not enforcing the expectation that transparent measurement-reporting practices are the default. Second, there are few incentives for practicing transparent science (and little appreciation for transparency around construct validity, in particular), and researchers may have uncertainty and fear about how transparently reporting their measures may affect the credibility of their conclusions (Hoekstra & Vazire, 2021). In particular, authors may worry that being transparent about measurement practices could lead others to detect (or perceive) threats to the construct validity of their measures (e.g., low internal consistency when the use of the measure requires a high level of internal consistency). Our findings cannot provide insight into why prevalence rates are not higher; however, we can show whether the practices shifted during the decade containing the onset and subsequent fallout of the credibility revolution in social and personality psychology.
Little change in measurement-reporting practices over time
Only one measurement-reporting practice changed significantly from 2010 to 2020 in both of our samples: materials sharing. The increase in openly shared materials at the article level across the decade was substantial in magnitude. However, we coded only whether articles mentioned that additional measure information was included somewhere else and did not confirm the claim that the reported information was actually available. This relatively low bar for articles being deemed as having “open materials” means that we likely overestimate the proportion of articles with actually available, correct, usable, and complete materials (Hardwicke et al., 2024; Kidwell et al., 2016). Increasing the presence of open materials is vitally important given the challenges associated with obtaining materials from authors. In one field experiment, economists sent 200 emails asking for promised supplementary information to be sent on request (Krawczyk & Reuben, 2012); they found that only 64% of the authors responded to the email and that only 44% delivered the requested materials. Therefore, openly sharing materials is an impactful step in the right direction.
Structural improvements and changing norms in the field were both likely drivers of the substantial uptick in materials sharing. In particular, norms around openness and transparency changed in social and personality psychology, even at journals, such as SPPS, that do not hand out badges for open-science practices. In particular, former SPPS Editor-in-Chief S. Vazire explicitly encouraged open materials in her 2015–2016 editorial. Therefore, despite not awarding badges, hopeful SPPS authors may have recognized that sharing materials was preferred by the journal, leading to increases in transparent measurement-reporting practices starting in 2016. Sharing materials—especially survey items from questionnaire measures—is also an accessible entry-level open-science practice (Howard et al., 2024). Conversely, fears surrounding measurement reporting could explain why years into the credibility revolution, there were still many articles without open materials; for example, researchers may have created a measure themselves and want to retain this intellectual property, fearing that sharing it openly will benefit others without acknowledging their hard work. Or authors may be wary of sharing potentially copyrighted measures out of fear of legal ramifications.
Given the widespread notoriety and presumed impact of the replicability crisis on methods and practices in social and personality psychology, we were somewhat surprised that no other measurement-reporting practice showed meaningful changes from 2010 to 2020. Although we cannot rule out small to medium effects, we can rule out large effects, and given the base rates of the measurement-reporting practices we examined, the lack of significant change is unlikely to be due to floor or ceiling effects (except possibly for number of items). Instead, it seems authors did not dramatically change their measure-level reporting practices from 2010 to 2020. This finding, although somewhat disappointing, is a step toward fully reckoning with the replicability crisis and taking stock of whether the field’s science is actually improving rather than assuming it must be the case (Schiavone & Vazire, 2023).
Implications, suggestions, and future directions
Even with substantial evidence accumulated in social and personality psychology that more attention should be paid to measurement (e.g., Flake & Fried, 2020), few changes were apparent in SPPS as of 2020. The present study does not provide insight into why authors do or do not report measure details. For example, authors who engage in transparent measurement-reporting practices could be doing so after the fact (when writing up their manuscripts) because they believe the journal expects it rather than as a result of careful, critical thought during the design stage of their research. In our study, both phenomena would look the same even though the implications for the actual validity of measures used would be dramatically different. Ultimately, researchers should aim to improve construct validity, not just the transparency of measurement-reporting practices. However, if even basic evidence regarding construct validity is not being reported, it is difficult for researchers, as a field or as readers of individual articles, to assess the validity of measures used.
Given the relative methodological ease and few professional barriers to engaging in the simple transparent measurement-reporting practices we studied here, the ongoing stagnation in transparency could be due to neglected consideration of measurement across psychology. As Bauer (2022) demonstrated at Psychological Science, openly sharing data saw a much steeper increase between 2014 and 2021 compared with the increase of openly sharing materials despite authors presumably feeling less “ownership” over their materials compared with their data. We point readers to the existing work highlighting the importance of construct validity (Clark & Watson, 2019; Cronbach & Meehl, 1955; Loevinger, 1957) and identifying strategies to improve measurement-reporting practices (Flake et al., 2017; Flake & Fried, 2020; Shaw et al., 2020). In addition, we urge social and personality psychologists to remember that construct validation is “not only continuous (a matter of degree, not a categorical distinction between valid and invalid) but continual (a perpetual, self-refining process)” (Westen & Rosenthal, 2003, p. 609). Therefore, the process of establishing construct validity is never finished and should be at the forefront of social and personality psychologists’ minds in all of the work they do. Unfortunately, construct-validity efforts seem to take a backseat compared with some other methodological issues. In a systematic study of limitations reported in SPPS articles (Clarke et al., 2023), very few limitations were related to construct validity, and those limitations that were deemed relevant to construct validity were a mix of idiosyncratic or vague concerns. In fact, the authors shared that “the most striking result was that only 3 articles (fewer than 1% of articles) reported a limitation related to the ad hoc nature of their measures” (Clarke et al., 2023, p. 888). Given the field’s current tendency to bypass vital engagement with measurement issues, researchers may need to focus on ensuring baseline expectations through formal guidelines.
One simple formal rule that journals could adopt immediately is requiring authors to publicly share all materials used in their studies with exceptions clearly identified (TOP Level 2 for research-materials transparency). Beyond that, journals could consider adopting formal guidelines regarding what measurement-related information authors must report in their articles, such as those provided by the Standardization of Behavior Research (SOBER) guidelines for measurement. In particular, part of the comprehensive reporting from SOBER includes the declaration to “report all of the items, stimuli, instructions, procedural parameters or other measurement characteristics used in a study” (Elson et al., 2023). Although some scholars have expressed concerns about the SOBER guidelines in terms of standardizing measurement and restructuring variability (Iliescu et al., 2024), there is promise in the call for standardizing some aspects of reporting details about measures. Some of the variables assessed in the present study, including number of items, example items, and reliability coefficients, could be reported for every measure (except for the case of ad hoc, single-item measures administered only once, for which there will be no corresponding reliability coefficient). For previously validated measures, citations should direct readers to a key scale-validation study (ideally, multiple validation studies or at least one with a similar sample); ad hoc measures should be explicitly identified as such.
Although we believe these practices are relatively low-hanging fruit for improving the transparency and completeness of measurement reporting, formalizing them into a checklist carries the risk of communicating that they are sufficient for valid measurement. We worry that a checklist for transparent measurement reporting may come to replace deep, critical thinking about construct validity. The message that has been repeated to psychologists for more than 70 years—that construct validity is both extraordinarily vital to consider and very difficult to meaningfully assess and convey—still rings true today. However, increased transparency about what aspects of construct validity authors did or did not examine is one small, approachable step. Moreover, requiring public sharing of materials (with exceptions when warranted) would also help readers assess some aspects of measurement validity for themselves.
Conclusion
In the present study, we examined measurement-reporting practices across 1,198 measures reported in 506 SPPS articles between 2010 and 2020. We found base rates for measurement-reporting practices that were similar to those previously reported in less comprehensive prior studies and that there was little improvement in measurement-reporting practices from 2010 to 2020 aside from increases in materials sharing. We replicated our findings across two samples with almost identical designs. Together, these results indicate that increased attention to measurement reporting has not necessarily translated to better reporting practices. Additional efforts are needed to increase readers’ ability to evaluate the construct validity of measures used in social-and-personality-psychology research.
Footnotes
Acknowledgements
We thank Wendy Higgins for feedback on an earlier draft of this article and Mijke Rhemtulla for advice on some of the statistical analyses. Any errors and omissions are the responsibility of the author team. Partial results from this article were submitted in fulfillment of author L. D. Khong’s honors thesis research project at the University of Melbourne. Openly accessible materials, data, analysis code, and preregistrations are available on the project OSF page: ![]() . Annotated references conveying why each particular work was cited and providing transparency about the citing process can also be found on OSF.
. Annotated references conveying why each particular work was cited and providing transparency about the citing process can also be found on OSF.
Transparency
Action Editor: Pamela Davis-Kean
Editor: David A. Sbarra
Author Contributions
Katherine M. Lawson and Julia G. Bottesini contributed equally to this manuscript and hold co-first authorship.