
Abstract
Pretesting survey items for interpretability and relevance is a commonly recommended practice in the social sciences. The goal is to construct items that are understood as intended by the population of interest and test if participants use the expected cognitive processes when responding to a survey item. Such evidence forms the basis for a critical source of validity evidence known as the “response process,” which is often neglected in favor of quantitative methods. This may be because existing methods of investigating item comprehension, such as cognitive interviewing and web probing, lack clear guidelines for retesting revised items and documenting improvements and can be difficult to implement in large samples. To remedy this, we introduce the response-process-evaluation (RPE) method, a standardized framework for pretesting multiple versions of a survey. This iterative, evidence-based approach to item development relies on feedback from the population of interest to quantify and qualify improvements in item interpretability across a large sample. The result is a set of item-validation reports that detail the intended interpretation and use of each item, the population it was validated on, the percentage of participants that interpreted the item as intended, examples of participant interpretations, and any common misinterpretations to be cautious of. We also include an empirical study that compares the RPE method with cognitive interviewing in terms of the quality of data gathered and the resources expended. Researchers may find that they have more confidence in the inferences drawn from survey data after engaging in rigorous item pretesting.
Keywords
Survey questionnaires are widely used throughout the human sciences and in social life to gain information about people’s thoughts and behaviors. Such surveys are often composed of a collection of declarative statements or closed-ended questions followed by fixed sets of response options. A core requirement for the validity of inferences based off of responses to such surveys is that the cognitive processes employed by individuals when responding to survey items are consistent with the intentions of the items’ designers—that is, that individuals respond to survey items in the way they do for the expected reasons and not, say, because they have misunderstood the item, object to its formulation, or cannot find a response option that adequately reflects their desired response (AERA et al., 2014; Launeanu & Hubley, 2017).
Unsurprisingly, guidelines for the construction of survey questionnaires strongly emphasize both the importance of extensively vetting items for clarity and coherence and then evaluating the cognitive-response processes actually employed by respondents when responding to these items (e.g., Gehlbach & Brinkworth, 2011; Krosnick, 1999; Presser, Couper, et al., 2004; Wilson, 2005). In general, this cannot be done simply by looking at survey responses themselves because once results are collected, there is no way to discern why any given person chose the selected responses; some form of open-ended contact with respondents is usually required, such as through cognitive interviews (CIs; Castillo-Díaz & Padilla, 2013; Gehlbach & Brinkworth, 2011; Leighton, 2017; Lundmann & Villadsen, 2016; Messick, 1995; Padilla & Benítez, 2014). CIs typically use semistructured interview protocols in which participants are encouraged to either “think aloud” while responding to a survey item or respond to questions about their thought processes (Padilla & Benítez, 2014; Priede & Farrall, 2011). Follow-up probes are often used to gain additional information about distinct phases of the process of responding to an item, such as initial comprehension of the item, recall of relevant information, judgment concerning the question being asked, and selection of the best response option from those provided (Tourangeau, 1984).
However, despite their clear value, CIs are time- and resource-intensive and require skill sets not always well represented among quantitatively oriented social scientists (Castillo-Díaz & Padilla, 2013; Launeanu & Hubley, 2017). A less resource-intensive and more streamlined alternative to traditional cognitive interviewing that has gained popularity in recent years is web probing (see e.g., Behr et al., 2017; Edgar et al., 2016; Fowler & Willis, 2020), which often employs the same sorts of probing questions used in CIs but in an open-ended survey format administered online, usually through crowdsourcing platforms, such as MTurk and Prolific. A clear disadvantage of web probing relative to CIs is that it generally precludes the kinds of reciprocal dialogue characteristic of interviews in which the interviewer can, for example, ask follow-up questions if an interviewee’s response is unclear or brings up an unexpected point. The main advantage is, of course, that it is simply easier; information can be gathered, organized, and standardized more quickly and easily (Edgar et al., 2016; Fowler & Willis, 2020). The online nature of web probing often also makes it possible to reach a wider participant pool, which could help researchers target specific populations and understand how item interpretations may vary across different demographics (Edgar et al., 2016). Web probing generally provides the opportunity to gather data from much larger samples, with the usual attendant advantages, such as more stable quantitative estimates and the ability to apply statistical analyses (Behr et al., 2017; Edgar et al., 2016; Meitinger & Behr, 2016). In addition, in at least some respects, the anonymity and lower perceived stakes of an online setting relative to in-person interviews may be a feature rather than a bug, so to speak: Participants may be more likely in such a setting to behave similarly to how they actually would when responding to typical surveys, reducing the potential impact of social-desirability bias (Krumpal, 2013; Tourangeau & Yan, 2007) and increasing the chance they would comfortable giving honest feedback and that the method would accurately flag items likely to be misread or misunderstood by reactively low-effort responders (Bowling et al., 2021).
Yet despite the widely recognized importance of evaluating cognitive-response processes for survey design, evidence of this nature is still rarely reported in reports of survey-instrument construction in many major academic journals (Cizek et al., 2008; Fowler & Willis, 2020; Hubley et al., 2014; Peterson et al., 2017). Part of the reason is surely the cost—even web-based methods require a nontrivial commitment of time and resources and all the more so if multiple rounds of revision and retesting are required, as is a common recommendation (Peterson et al., 2017; Ryan et al., 2012; Willis, 2005). Another important factor is the lack of widely accepted reporting frameworks for investigations of response processes; more generally, it can be difficult to find clear guidance or precedent for reporting important features of item-level validity, such as the intended interpretation of an item, the rationale for its inclusion in a scale or questionnaire, common misinterpretations, the characteristics of the population in which it was tested, and the percentage of respondents that understood the item as intended. Indeed, it is often noted that existing pretesting protocols are typically too vague to reproduce reliably and that they lack the guidelines necessary to be implemented successfully (Hilton, 2017; Presser, Couper, et al., 2004). A third factor, at the risk of some cynicism, is simply that it is generally not necessary to present this kind of evidence to get published (Castillo-Díaz & Padilla, 2013; Launeanu & Hubley, 2017; Maul, 2017); indeed, it seems common for reports of instrument construction and validation to emphasize quantitative forms of evidence (e.g., estimates of reliability, results of factor analysis, and correlations with other variables; Barry et al., 2014; Chinni & Hubley, 2014; Cizek et al., 2008; Flake et al., 2017; Hubley et al., 2014) despite the demonstrated fact that these techniques can return positive results even when respondents cannot understand items at all (Maul, 2017) or are attending to only surface-level features of the words used in the item stems (Arnulf et al., 2014, 2018).
In the spirit of anticynicism, the balance of the present article is dedicated to presenting a novel method designed to address these gaps. We begin by demonstrating how to use the method on items with a dichotomous response option, and we include a discussion about items with polytomous response options in the Appendix in the Supplemental Material available online. We offer advice and guidance for researchers who wish to employ the method and end with an empirical comparison with cognitive interviewing. Our hope is that testing the interpretation of items in the population of interest will become a fundamental part of instrument validation in psychology.
The Response-Process-Evaluation Method
The response-process-evaluation (RPE) method is a standardized framework for pretesting multiple versions of survey items and generating individual-item-validation reports (Wolf et al., 2022). 1 It turns CIs into metasurveys—surveys about survey items—employing web probes to develop and validate items in an iterative fashion. 2 When used on a crowdsourcing platform, researchers can quickly gain insights into the interpretability of survey items, make revisions when necessary, and retest item interpretability with a new sample of respondents. This process is repeated sequentially until the final version of each item is constructed (or the item is removed from the instrument because of nonconvergence in shared meaning across participants). The result is a set of item-validation reports that detail the intended interpretation of each item, the population on which it was validated, the percentage of participants that interpreted the item as intended, and any common misinterpretations.
Like CIs and web probes, the RPE method uses probes that prompt participants to explain two aspects of their response process: their interpretation of the item and the rationale for the response option they selected. These probes are designed to elicit evidence that enables researchers to evaluate the extent to which the item was understood as intended or might warrant a testable revision. The probes are administered in a metasurvey in which participants respond to open-ended questions about a subset of survey items rather than completing the entire survey in full. For example, participants might be asked to restate the item in their own words (paraphrase probe), define a key word or phrase in the item (comprehension probe), and explain why they selected a particular response option (category-selection probe; Behr et al., 2017; Willis, 2005).
Participants provide written responses to these probes, which are subsequently evaluated by researchers and coded as either “understood,”“likely understood,”“likely not understood,”“not understood,” or “not enough information.” Each response is coded holistically, combining information from all the probes to make an overall decision for each participant and each item. If participants do not give a meaningful response to the probes for an item, for example, by refusing to answer or responding with nonsense, their response is coded as “nonresponse” (Behr et al., 2017) and excluded from the data set. We found that approximately 5% of the responses from American participants on MTurk were unusable. 3
Data are collected in batches of five participants and coded by at least two trained subject-matter experts that are clear on the intended interpretation of each item and the intended use of the survey instrument. After a batch of responses is coded, researchers meet to compare their codes and discuss how well each item appears to be functioning. Survey items that are coded as understood or likely understood by the researchers are readministered to another batch of five participants to collect more data. Items that are coded as likely not understood or not understood are either revised and then readministered to a new batch of five participants, retested to collect more data, or removed from the survey. If an item has an unusually high number of not-enough-information codes, then probes should be revised or additional probes should be added to the next batch of data collection to reduce ambiguity. This process is repeated iteratively until the final version of the item has been evaluated an adequate number of times (each version of the item is referred to as an “iteration”). In our experience, we began to see less variation and lower return on investment after 20 responses to the final version of the item; this number is slightly higher than the five to 15 participants recommended in CIs (see e.g., Peterson et al., 2017). Thus, we tentatively recommend that the final version of each item be evaluated 20 times and be considered validated 4 when it is coded as understood or likely understood at least 80% of the time. However, we encourage researchers to consider using (a) larger samples to statistically demonstrate that values exceed this threshold, and (b) higher validation thresholds (e.g., 90%), depending on the nature of the research. For a visual representation of the RPE method, see Figure 1.
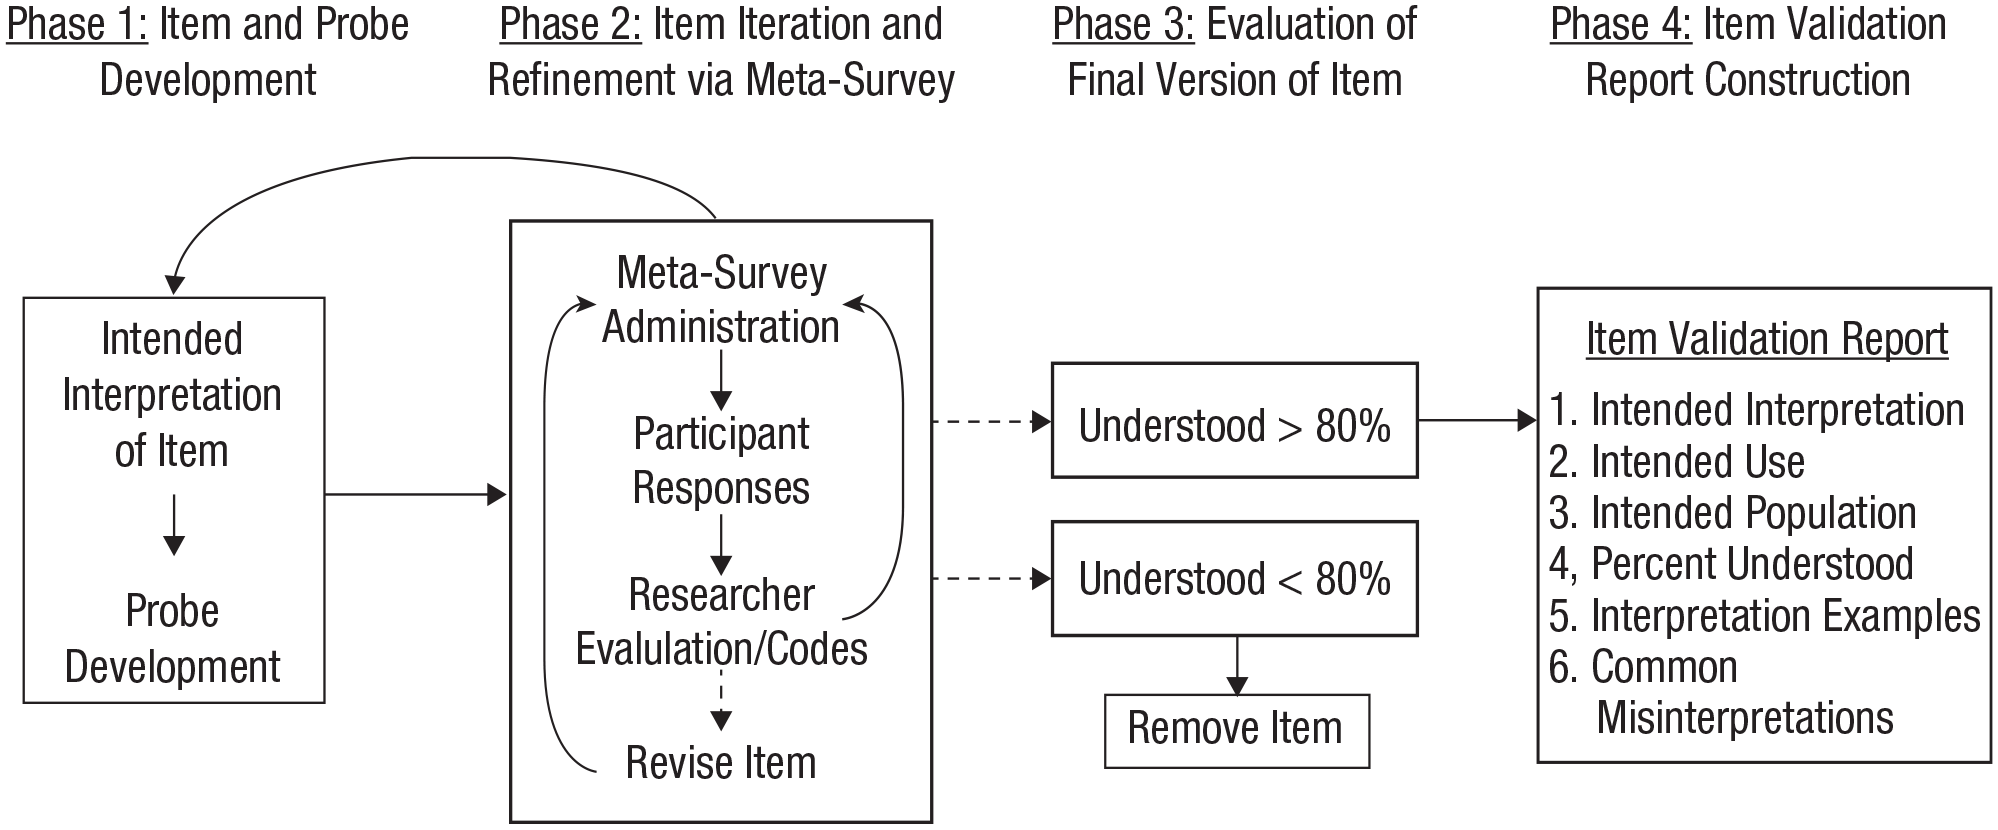
A visual representation of the response-process-evaluation method. Each metasurvey is administered to a “batch” of five participants (Phase 2), and the final version of each item is evaluated at least 20 times (Phase 3).
If items are written to reflect a construct with (especially) ontologically subjective or culturally specific elements (e.g., depression, resilience), it may be helpful to include an “experiential-relevance” probe that queries the extent to which participants agree that (a) the survey item is relevant for that construct and (b) the construct has been adequately covered by the set of survey items (Peterson et al., 2017). Querying this from participants essentially invites them to contribute to the development of the survey instrument by producing evidence of validity based on the test content (e.g., the relevance of the test items from the experience or perspective of the participants). This type of validity evidence is often gathered by consulting subject-matter experts or relevant literature (AERA et al., 2014; Lissitz, 2009; Sireci, 1998), but this does not guarantee that the items are relevant to participants. If researchers intend to use the survey instrument to make cross-cultural comparisons or administer the survey to participants with diverse cultural backgrounds, then the entire RPE process should be repeated using participants from relevant backgrounds to ensure it is cross-culturally sound (for more information, see Taves et al., 2023; Wolf et al., 2022).
We developed the framework of the RPE method to create a well-documented, evidence-based approach to item development and incorporate participants into the item-revision process. 5 The strength of the method lies in its unique ability to (a) revise and retest items iteratively until the final version of an item is reached and (b) create user-friendly item-validation reports that make it easier to judge the adequacy of a survey item for a particular purpose and borrow items for use in other studies. In the next section, we walk through the validation process for one survey item and witness how feedback from the population of interest helps revise the item and clarify the concept of interest.
Using the RPE Method
To demonstrate the RPE method, we use an item from the Inventory of Nonordinary Experiences (INOE) that was recently validated for English-speaking Americans and Hindi-speaking Indians on the crowdsourcing platform MTurk. The INOE comprises 38 close-ended “experience” items in which participants respond “yes” or “no” to whether they have had a specific experience, for example, “I have had the experience of being aware that I was dreaming while asleep.” If participants respond affirmatively, they are asked a series of close-ended follow-up questions about that experience, such as “Overall, how much of an impact has this experience had on your life?” The items are intended to be understood by a lay population, and the instrument is intended to be used to compare the frequency and appraisal of nonordinary experiences across the two cultural groups. In practice, this item was validated concurrently for both English-speaking Americans and Hindi-speaking Indians with a cross-cultural team of researchers. For simplicity, we elect to demonstrate the validation process only for English-speaking Americans, but the process can be expanded to validate items simultaneously in multiple languages. Readers that are interested in detail about the cross-cultural validation process are referred to Taves et al. (2023).
Many of the original items on the INOE were adapted from or inspired by existing scales in the literature about religious, paranormal, or psychotic experiences because these experiences are often considered to be extraordinary, unusual, or rare. The INOE research team wanted to include a survey item about nonordinary experiences of love or compassion because these two emotions are often cultivated by religious traditions (e.g., “God’s love”). Love and compassion were combined into one item because the two terms are often combined colloquially and because the research team felt the terms were similar. The first iteration of the survey item was “I have had an experience of love or compassion that stood out from all other such experiences” (Table 1). Note that participants should respond affirmatively only if the experience stood out (i.e., was distinctive or particularly memorable) relative to other such experiences. In addition, note that a clear definition of “love or compassion” and an intended interpretation was not included when we first began the validation process for this item.
The First Iteration of the Love or Compassion Item and Corresponding Instructions

We used five probes to capture each participant’s response process (Table 2). To better replicate the survey-taking experience, participants first responded to the item itself (response probe). Next, they were asked to define the key terms in the item (comprehension probe), followed by paraphrasing the entire item in their own words (paraphrase probe). We found that it was necessary to include the comprehension probe along with the paraphrase probe for this item because without the comprehension probe, participants would sometimes paraphrase “only love and compassion” and mistakenly omit the “stood out” part of the item. These two probes would sometimes yield redundant information if participants defined love and compassion as part of their response to the paraphrase probe. There were two versions of the category-selection probe; the version participants saw was triggered by their response to the survey item. If they selected yes, they were asked to briefly describe the experience; if they selected no, they were asked to give an example of such an experience. We asked the no respondents for examples to confirm that they could imagine what such an experience would be like, which helped to confirm that they had not had one. The last probe they responded to was an optional catch-all probe in which they were invited to share any other feedback they had. These probes were developed through trial and error in which the order and wording of each probe was modified until it elicited the information necessary to determine if the item was understood as intended.
The Probes Used in the Metasurvey

To determine metasurvey length, we tested how long it took us to respond to all of the probes for one item and came up with an average of 3 min. In an effort to reduce participant burnout, we elected to administer metasurveys with an average of three items per survey (i.e., each metasurvey would take approximately 9 min to complete) and paid minimum wage proportional to the amount of time the survey was expected to take. Metasurvey length and compensation is an important consideration with surveys that are composed of mostly open-ended items because open-ended survey items have a much higher cognitive burden than close-ended survey items (Dillman et al., 2014; Tourangeau et al., 2000). We added an additional minute to the survey-completion time to compensate participants for the time spent responding to demographic items that were used to ensure that (a) important subgroups were represented in data collection and (b) any misinterpretations were not consistent across groups. Responses were collected in batches of five, meaning that the research team coded responses from five participants at once. We kept all the items and probe responses in the metasurvey in the same coding file so that we could see if a participant consistently gave low-effort or nonsensical responses throughout the metasurvey (at which point, we would consider removing them; Moss, 2018).
A sample of responses from the first two batches of data for the first iteration of the survey item are presented in Table 3. Three of the participants selected yes, and one participant selected no when responding to the item “I have had an experience of love or compassion that stood out from all other such experiences.” When reading through the first participant’s responses, we noticed that the participant’s responses to the comprehension and paraphrase probes seemed in line with what we intended but that the participant’s self-description as a “compassionate person” with “intense feelings of love all of the time [italics added]” when responding to the category-selection probe indicated that the participant did not recall a particular instance that “stood out” when responding. 6 This led us to code the participant’s overall response as not understood even though the responses to the comprehension and paraphrase probes were good. If we had used only one probe to pretest this survey item, it would have been difficult to evaluate the participant’s response process and determine if the participant understood the item as intended.
A Sample of Responses From the First Two Batches of Data for the First Iteration of the Love and Compassion Item
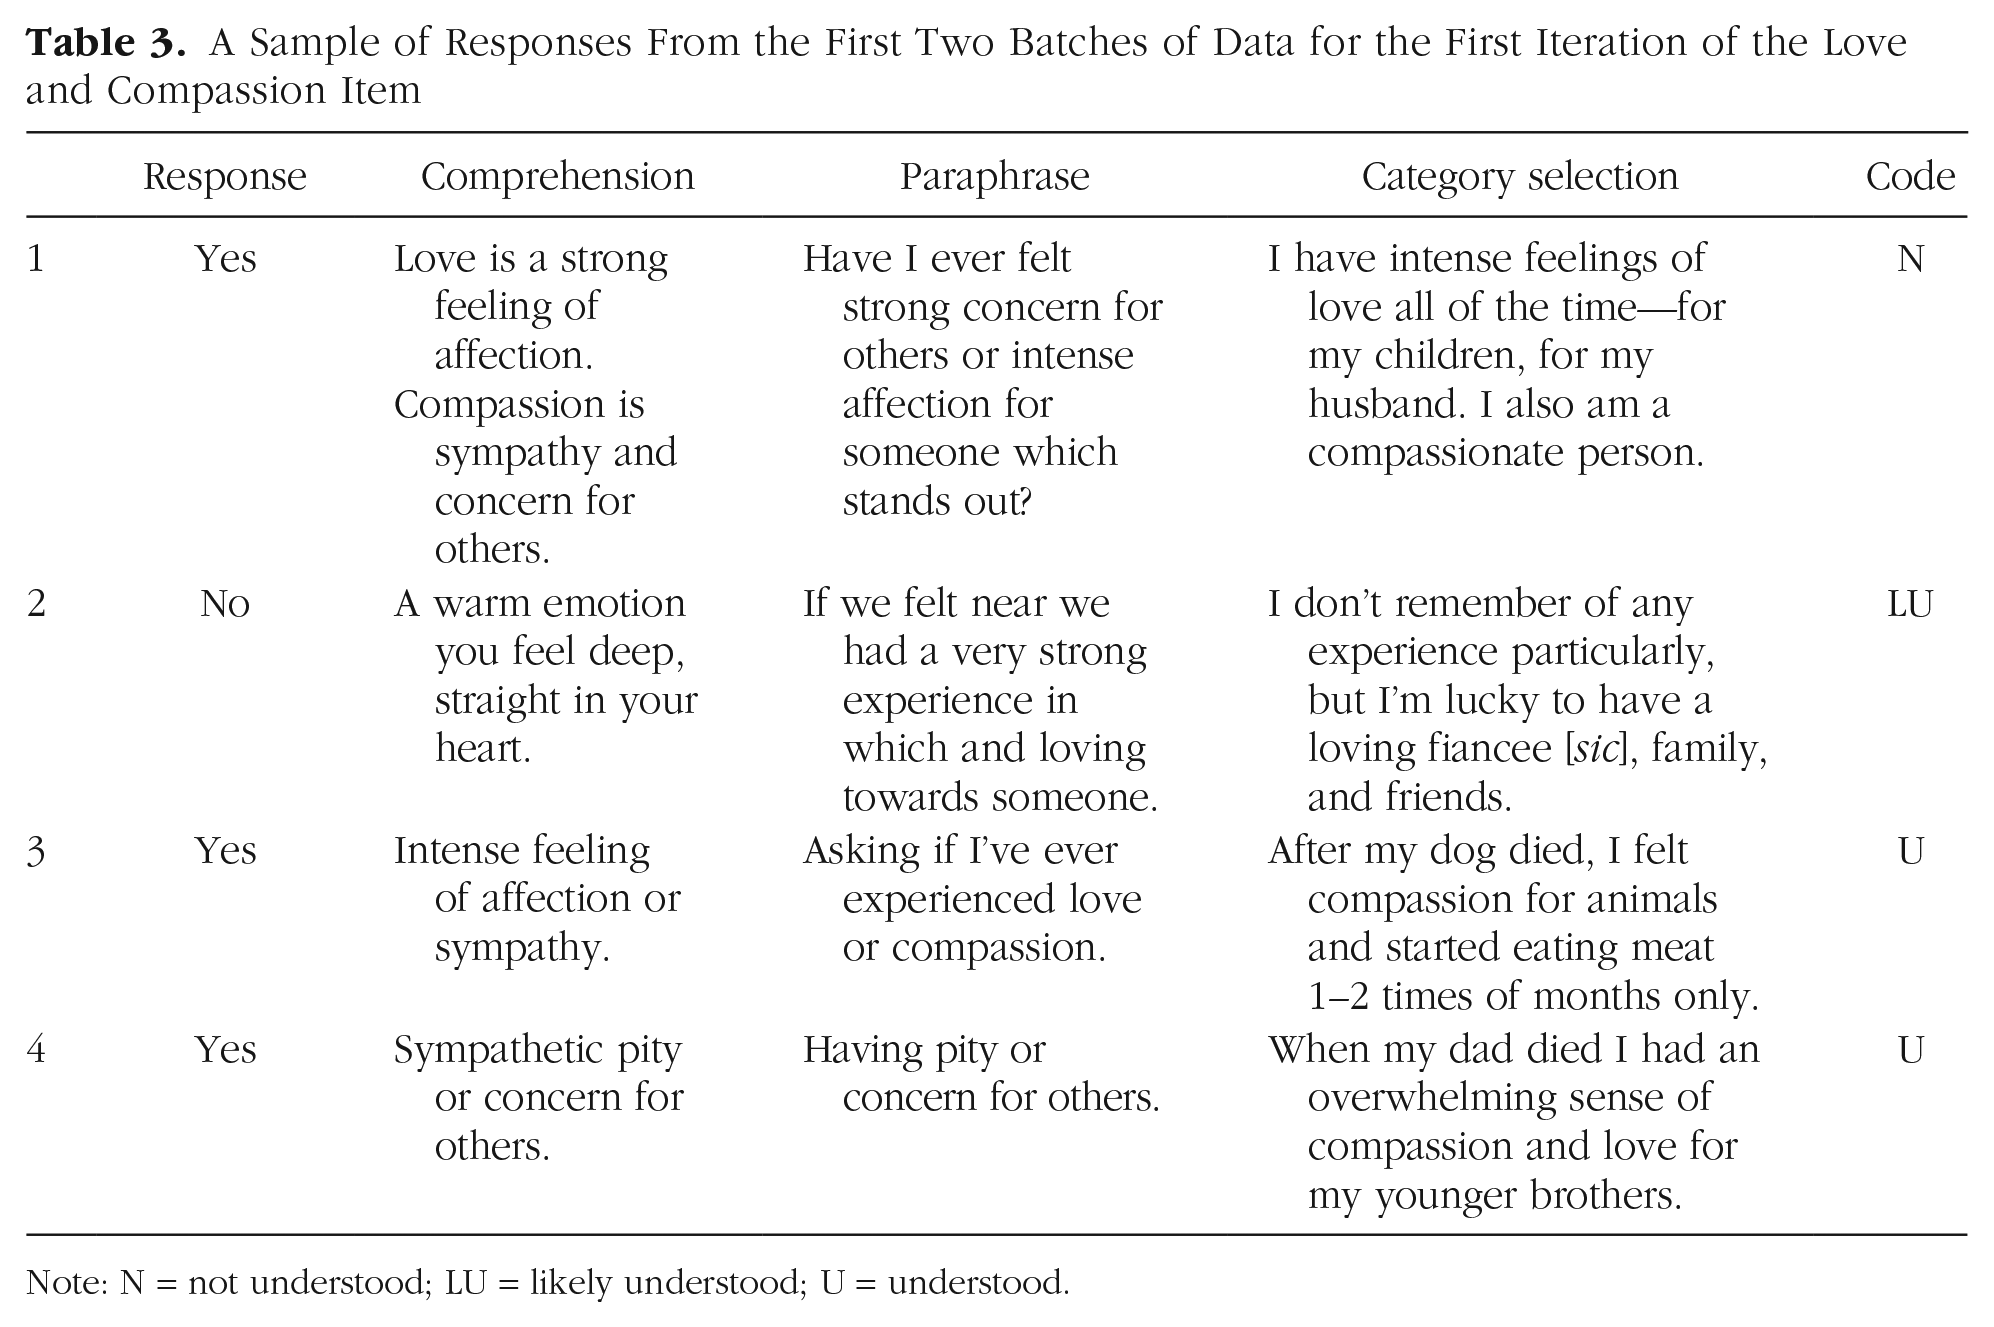
Note: N = not understood; LU = likely understood; U = understood.
The second participant was coded as likely understood because although the participant’s response to the comprehension probe was vague, the participant’s response to the category-selection probe was exactly in line with what we intended (i.e., the participant selected no when responding to the item because the participant did not remember a specific moment that stood out despite feeling loving feelings for people close to the participant). Comparing the first and second participants yields a classic case of multifinality, for example, the idea that participants can use the same cognitive processes when responding to an item but select different response options (Lundmann & Villadsen, 2016). Both participants described themselves as having loving relationships, but the first participant used this as a justification to respond yes to the item, and the second participant chose to respond no. The third and fourth participants were both coded as understood; although they did not properly paraphrase the “stood out” aspect of the item, their “yes” responses combined with a clear memory of a meaningful experience of compassion in their responses to the category-selection probe made it clear to us that they both understood the item as intended.
When discussing the responses to the first two batches of data, we find that two things became clear: (a) Compassion and love were two distinct emotions that should probably not be combined into the same item, and (b) we needed to clearly delineate the intended interpretation of the item to ensure that coders were on the same page. The first point arose upon reading the responses and noticing that the second participant described only feelings of love and that the fourth participant described only feelings of compassion. We worried that participants might mistakenly focus on either love or compassion when reading the item and therefore end up using very different cognitive processes when responding. The second point arose from lively debates during our team coding-review meetings in which it became clear that although the definitions of love and compassion seemed self-evident, our disagreements on how the responses should be coded indicated that an unambiguous intended interpretation would streamline the validation process. Thus, we split the item into two items and added intended interpretations for both (see Table 4).
Intended Interpretation of Each Survey Item

For the sake of brevity, we continue the demonstration of the RPE method by presenting data only from the second and final iterations of the compassion item. In the second iteration, we decided to simply remove the word “love” and otherwise retain the same structure for the item stem. Thus, the second iteration of the compassion item read “I have had an experience of compassion that stood out from all other such experiences.” For a sample of responses to the second iteration of the compassion item, see Table 5.
Responses to the Probes for the Second Iteration of the Compassion Item
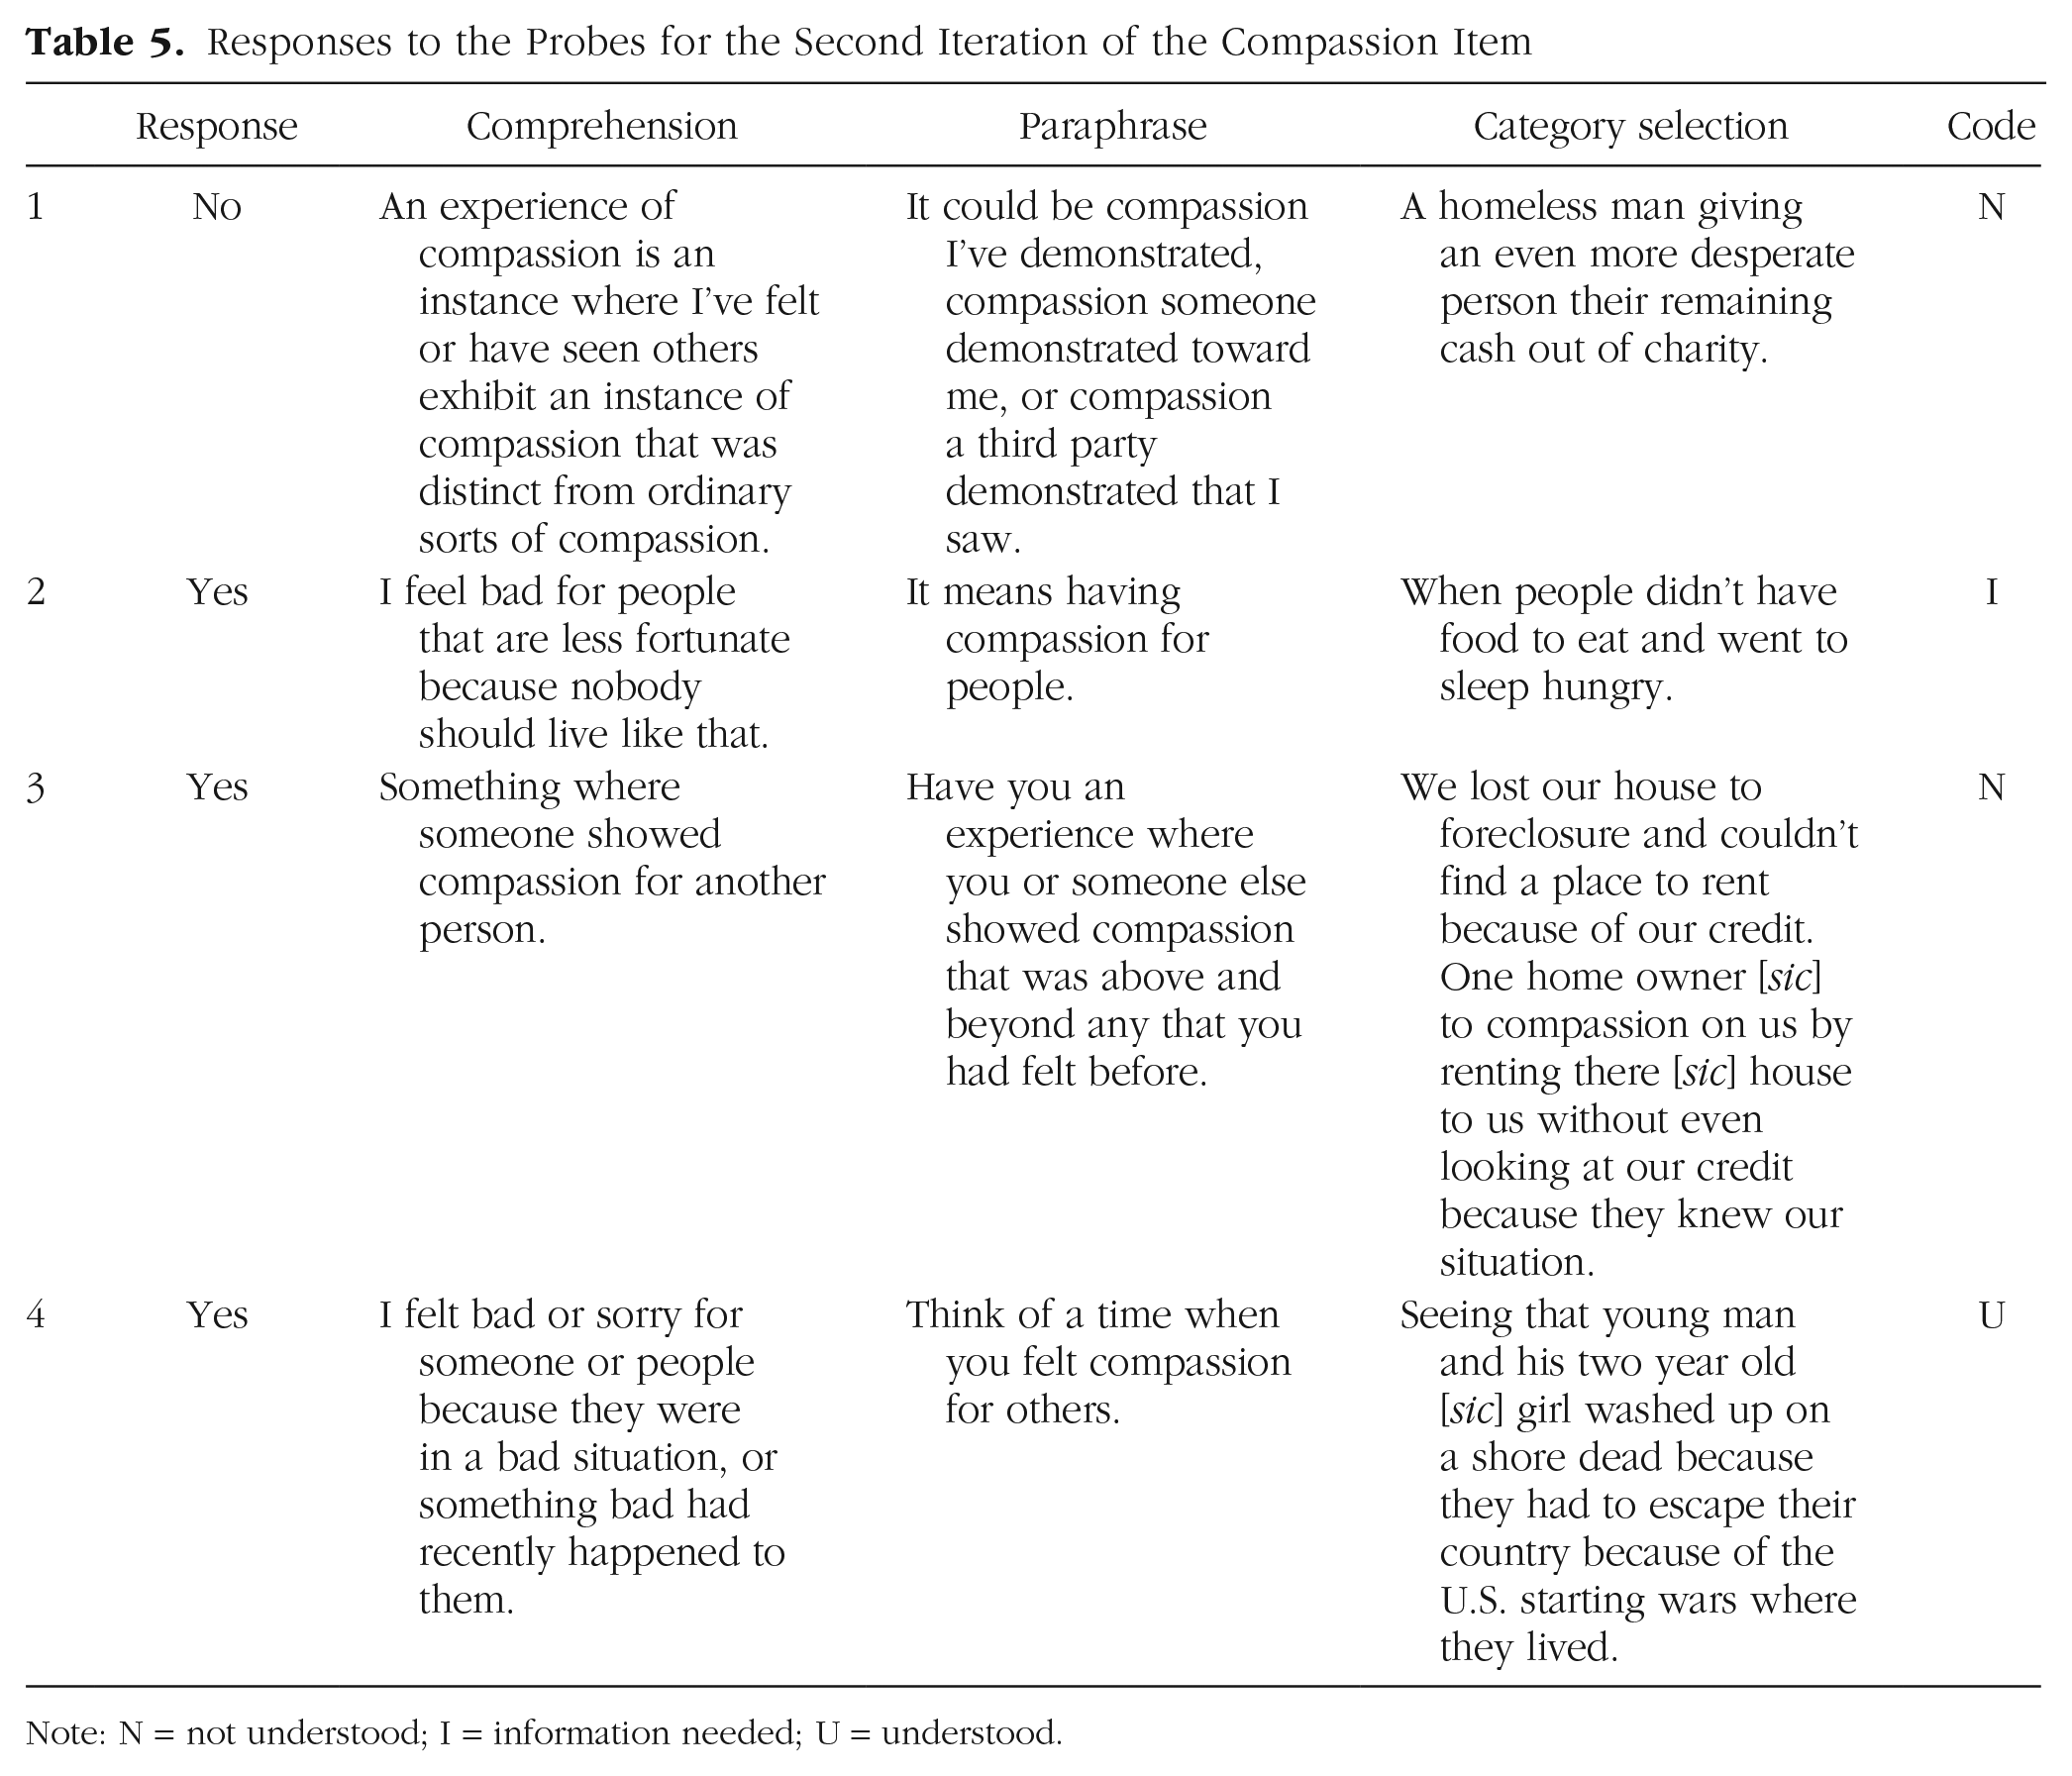
Note: N = not understood; I = information needed; U = understood.
When coding this item, we noticed that some participants were recalling or giving examples of specific experiences in which they witnessed or felt compassion from others rather than times they personally felt compassion for others, which was not in line with what we intended. Thus, Participant 1 and Participant 3’s responses were coded as not understood. Participant 2’s response was coded as not enough information because it was vague and we were unable to come to an agreement as to whether the participant recalled a specific experience. Participant 4’s response was coded as understood because the participant’s responses to all three probes were in line with what we imaged when writing the item. The responses to the probes for the first and second iterations of this item made it clear that we needed to further revise the item to (a) clarify we wanted a feeling of compassion for others and (b) better highlight the “stood out” nature of the experience.
The compassion item was revised four more times to address the issues above before we reached the final iteration. The sixth and final iteration of the compassion item read, “I can recall a specific experience in which I felt compassion for the suffering of others (human or nonhuman) that
Responses to the Probes for the Final Iteration of the Compassion Item

Note: LU = likely understood; U = understood.
The validation process for the sixth and final item started out the same as the others: with a batch of five respondents. After each participant’s response was coded as understood or likely understood, we readministered the same item to a new batch of five participants to collect more data and determine if the trend of correct interpretations replicated in a new sample. This process was repeated until we collected data from 20 participants. In the end, 19 of 20 participants understood the item as intended (95%), and one participant was coded as likely not understood. If we had administered the second iteration of this survey item without going through this extensive validation process, roughly 25% of participants would not have understood the item as intended, making the conclusions based on the analysis of their data inaccurate. Using the RPE method resulted in an item that we feel confident is interpreted by participants as we intended it to be interpreted.
Constructing Probes
There is no single correct way to write a probe; a probe is correctly written when it elicits the information necessary to determine if an item was understood as intended. Given that an interviewer is not present to ask follow-up questions, it is important to use targeted, unambiguous probes that clearly instruct participants to provide actionable information about their response process (Behr et al., 2017; Willis, 2005). For example, we quickly learned that using “How would you respond and why?” as a category-selection probe was worded too generally when we received responses such as “I’d say no,”“I would respond in a positive way,” or “Sometimes, but not very frequently.” Even without the context of the item, it is clear that these responses do not provide enough information to judge if the item was misinterpreted. When we changed the probe to “Please explain why you selected this response” or “Briefly describe the specific experience in which you felt compassion for the suffering of others (human or nonhuman),” we were able to elicit responses that helped us evaluate the participant’s response process and determine if the item was understood as intended.
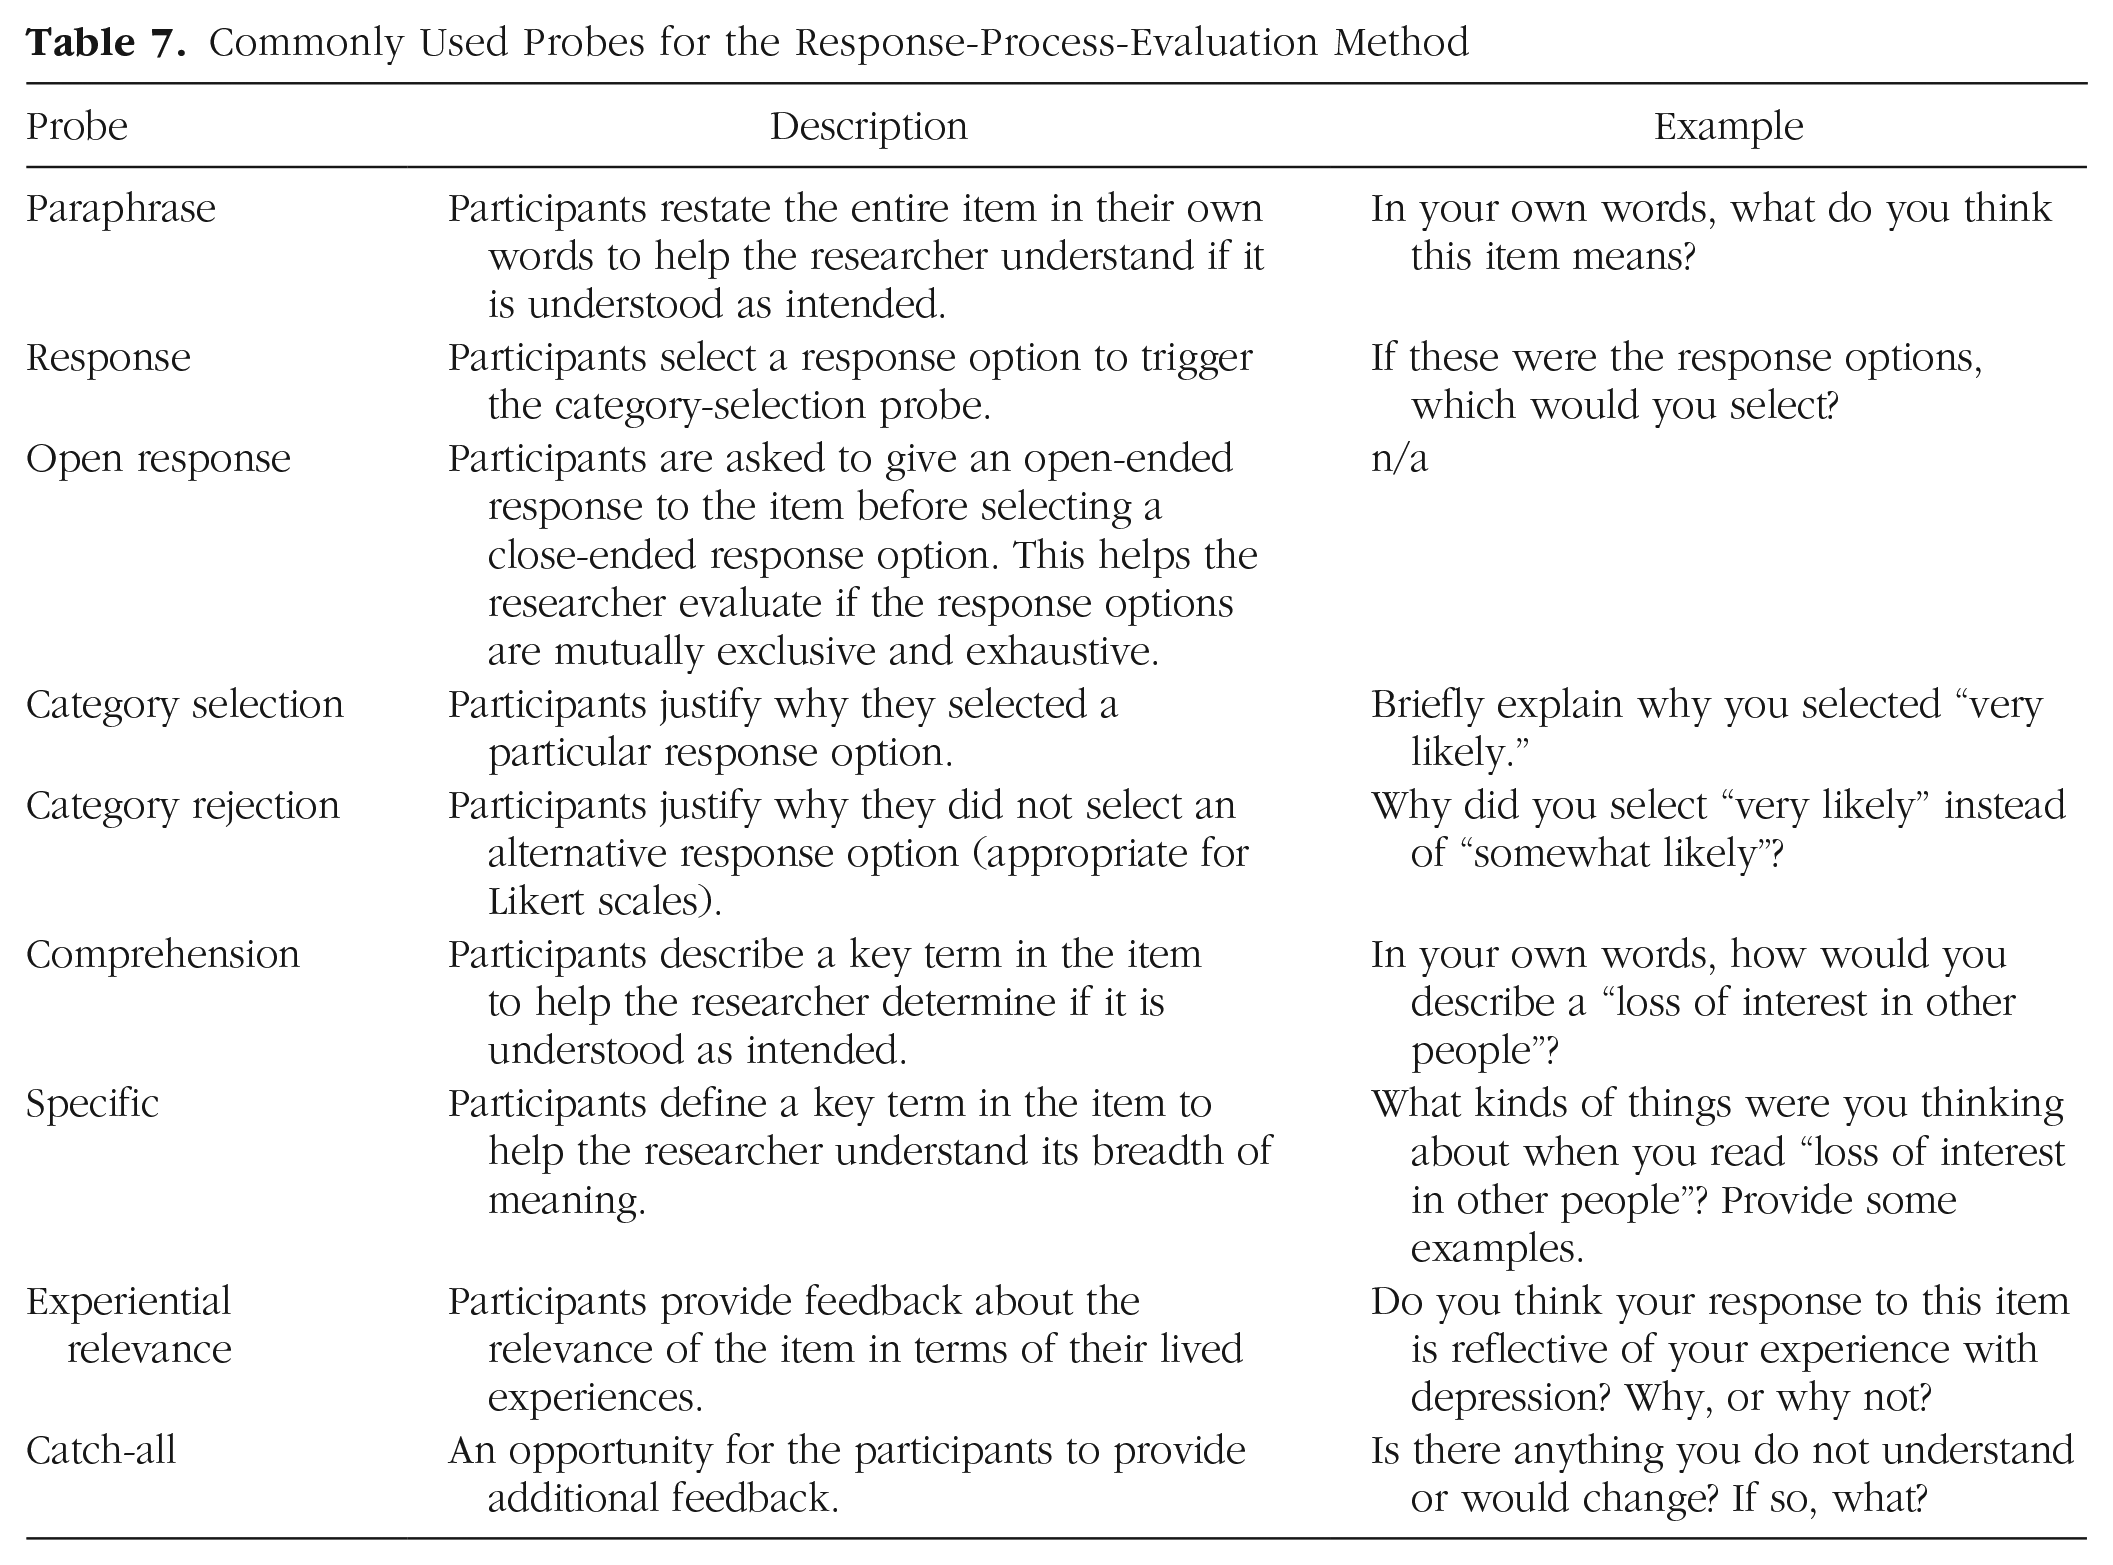
We found that multiple probes were necessary to follow the participant’s response process and make a holistic judgment as to whether the item was understood as intended by the participant. Edgar et al. (2016) compared the data quality derived from laboratory interviews with single-question web probes and found a similar result: Their most actionable data came from the inclusion of unscripted follow-up probes in laboratory interviews. When designing probes for the RPE method, it is therefore important to construct them in such a way that a follow-up probe would not be needed. In pursuit of this, researchers should focus on probe clarity rather than including multiple redundant probes to avoid unnecessarily burdening or frustrating participants. This may require rewriting probes several times, revising the order of the probes, or testing them in a laboratory setting or with colleagues, family, or friends. It is important to remember that participants cannot get anything wrong; rather, if the item or probe is misunderstood, it is the researcher’s responsibility to clarify it. In terms of probe labels, the existing naming convention varies somewhat across the cognitive-interviewing, web-probing, and pretesting literatures (see e.g., Behr et al., 2017; Edgar et al., 2016; Presser et al., 2004; Willis, 2005). To help facilitate ease of adaptation, we used established terminology for probe names and present a list of common probes and hypothetical examples in Table 7.
Commonly Used Probes for the Response-Process-Evaluation Method
Coding Responses and Creating Item Reports
Like CIs and web probing, we recommend having multiple coders for each response. Throughout the validation of the INOE items, we used a minimum of two coders and a maximum of five but felt that three or four was the optimal number. The metasurvey responses for each batch of participants were distributed individually to all coders in private spreadsheets. We made sure to keep the responses for all items in the same spreadsheet so that we could evaluate participant quality and effort (e.g., we do not want to code a response as not understood because of a participant that consistently gave extremely low-effort responses—we instead suggest removing these participants). Researchers then place their individual codes and comments into a shared evaluation report, which should also contain all participant responses to each probe and some administrative details about the metasurvey (for a condensed example, see Table 8; for the full evaluation report, see https://osf.io/uy8sr). Subsequently, researchers meet to discuss their codes in the shared evaluation report and form a group consensus on the overall code for each participant: understood, not understood, not enough information, or nonresponse. Responses that are coded as not enough information or nonresponse are removed from the total count when calculating the percentage of responses that were understood as intended (e.g., if we calculated the percentage understood for the data in Table 8, the result would be 33%). However, we recommend documenting the total number of not-enough-information codes for each item because a large number of such codes may indicate problems with the item or the probes.
A Condensed Example of the Compassion Evaluation Report for Iteration 2
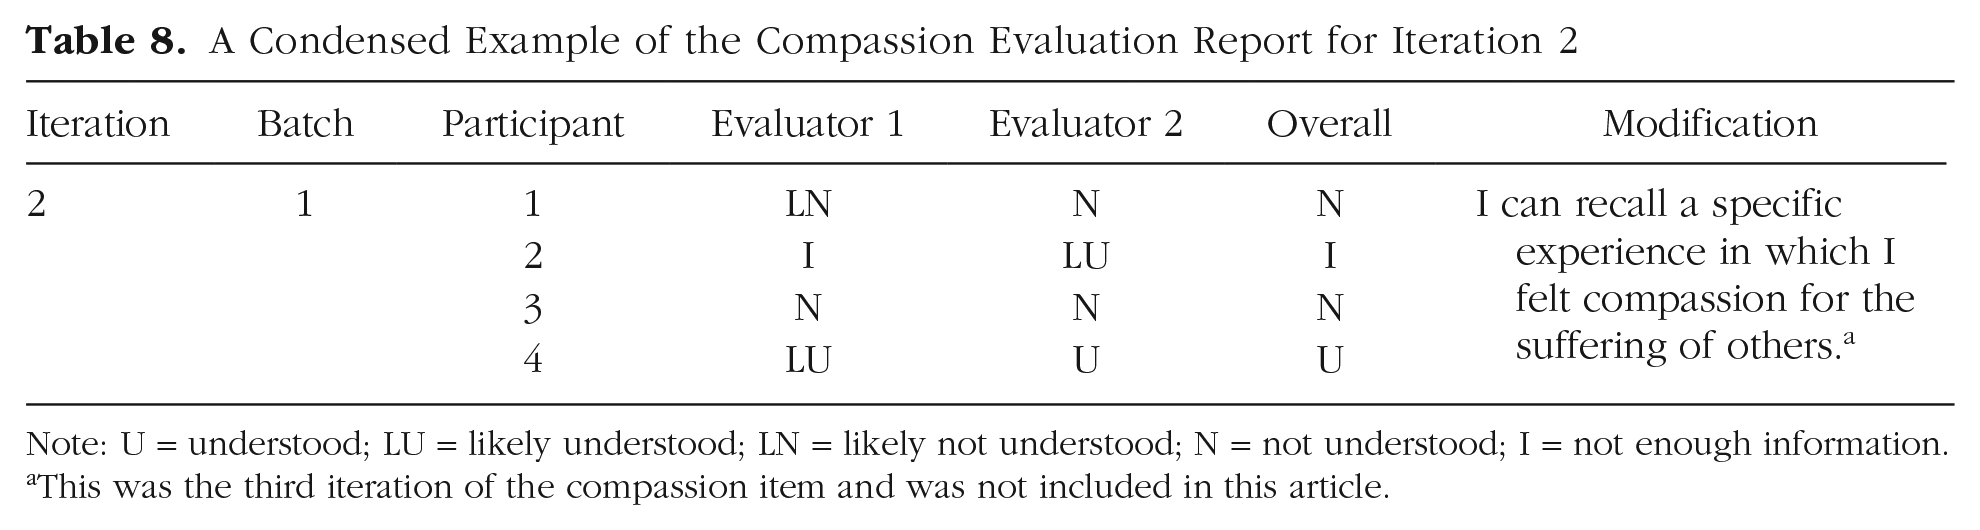
Note: U = understood; LU = likely understood; LN = likely not understood; N = not understood; I = not enough information.
This was the third iteration of the compassion item and was not included in this article.
Some disagreement during the coding process is to be expected; it is mostly a concern when researchers are assigning codes with opposite meanings (e.g., Researcher A assigns a code of understood, and Researcher B assigns a code of likely not understood). In our experience, this is the result of one of three causes: (a) The coders are not on the same page about the intended interpretation of the item and uses of the survey instrument, (b) the participant’s response was ambiguous, or (c) one researcher noticed something that another researcher did not. The first can be resolved by improved communication between researchers and more training or by refining the intended interpretation; the second can be resolved by modifying existing probes, adding additional probing questions, and/or assigning that participant a final code of not enough information; and the third requires no significant resolution because the researchers should be able to come to an agreement during the coding review. It is important to keep in mind that survey questions that require the participant to reflect, think critically, and give written responses are associated with a higher cognitive burden and that participants may not be motivated to give extremely detailed responses to every probe (this may be a cause of researcher disagreement; Dillman et al., 2014). This is another reason that we recommend using a holistic coding approach in which the final determination of understanding is made by reading through the responses to all the probes for each item. We also stress the importance of documenting the intended uses and interpretations of the survey results, the intended population for which it is to be administered, and the intended interpretation and rationale for inclusion of each item to ensure that coders can reliably evaluate the alignment between the item intent and participant’s response process (Castillo-Díaz & Padilla, 2013; Peterson et al., 2017).
Producing user-friendly item-validation reports is essential to ensure that the most important information is easily accessible and actionable for readers. These item reports should contain several components: (a) the wording of the final version of the item, (b) the intended interpretation of the item, (c) the population(s) and use(s) for which the item was validated, (d) the proportion of participants that understood the item as intended, (e) examples of participant interpretations, and (f) any common misinterpretations. The goal here is to provide readers with enough information so they can trust the results of a study that employs the item and also use the item in their own research (should their intended population and uses overlap). An example of an item-validation report for the compassion item can be found at https://osf.io/q94b7. Note that item-validation reports can and should also be created for validated items that are excluded from the final version of the instrument because others may find them useful (Willis, 2005).
Item-validation reports should not be lengthy, but depending on the number of items, there is a good chance that it will be difficult to include all of them in journal articles. Similar to this article, item-validation reports could instead be placed in an appendix or made available online in an item repository, such as the OSF. Alternatively, a centralized searchable item repository could be created that would act as a warehouse of items from all surveys. 7 Ideally, an open-access item repository could significantly reduce the amount of time researchers currently spend developing and validating instruments, instead allowing them to borrow trustworthy items and use them in empirical studies. Furthermore, transparent documentation of item development, interpretation, and meaning reduces ambiguity in social-science research and contributes to the open-science movement. See the Appendix for a discussion of validating items with polytomous response options (also available at https://osf.io/nx9f3).
Limitations
For response-process data to be most useful, participants must be willing and able to accurately describe their cognitive processes. It is possible that some participants may find this difficult. The RPE method may not be appropriate for certain subgroups (e.g., younger children) who may struggle to communicate how they interpreted an item, especially in the context of a metasurvey. In addition, the recommended sample sizes may be too small to detect meaningful misinterpretations, especially if an unintentionally undersampled subgroup consistently interprets items differently (or is unable to articulate their response processes). Researchers who are concerned about this may want to increase their total sample size and/or engage in targeted sampling. This would also allow for more precise quantitative estimates of the proportion understood, including by specific demographic groups.
Some researchers may find that they do not have the resources necessary to test multiple versions of items by evaluating the final version of each item at least 20 times and the final version of each response option at least five times. Although the iterative framework is one of the RPE method’s strengths, we would advocate against avoiding the method entirely because of limited resources. Researchers can still collect some response-process data using metasurveys and web probes to engage in preliminary pretesting. In this case, it is especially important to be transparent about the total sample size and quality of evidence gathered. We recommend pretesting items whenever possible because engaging with the target population is likely to improve instrument quality and the quality of inferences drawn from the results of analyzing survey data.
Comparison With CIs
CIs have long been the “gold standard” for collecting response-process evidence and pretesting items (Presser et al., 2004; Willis, 2005). Thus, we sought to compare the RPE method with CIs to evaluate if both methods can produce high-quality data that can correctly identify when items are misunderstood and facilitate item revisions.
A similar endeavor has been undertaken before. Edgar et al. (2016) compared scripted and unscripted laboratory CIs with web probes to compare data quality in terms of completeness and usefulness. In the scripted-CIs and web-probing conditions, participants responded to one scripted probe about each item. In the unscripted-CI condition, participants first responded to the one scripted probe and then were asked unscripted, spontaneous follow-up probes depending on the level of completeness of their original response. The authors found that one scripted web probe was useful for simple tasks (e.g., defining or providing examples of key terms) but that unscripted verbal probing was necessary for more complex tasks (i.e., explaining response processes).
The RPE method differs from the one-item web probe used by Edgar et al. (2016) in several ways; the most relevant here is that the RPE method suggests the use of multiple probes to evaluate item interpretability because it is unlikely that a single probe would provide enough information to follow the participant’s response process and determine if the item was understood as intended. To compare the RPE method with CIs, we replicated the Edgar et al. study for the second iteration of our compassion item: “I have had an experience of compassion that stood out from all other such experiences.” Our primary outcome of interest was response quality or completeness—in other words, if participants provided enough information for us to determine if the item was understood as intended. We also compared the number of individuals that appeared to understand the item as intended, the most common interpretations in each group, the proportion that endorsed each response option, median word count, and resources expended (time and money). We hypothesized that CIs would deliver slightly higher data quality but that both methods would provide enough information to determine if the item was understood as intended. We expected that the RPE method would be significantly less resource-intensive and that we would come to the same conclusion about the necessity and type of item revisions. This study was preregistered (https://doi.org/10.17605/OSF.IO/9ACS5) and marked as exempt by the University of California Institutional Review Board (No. 211-23-0308).
Method
We conducted 30 CIs and administered 30 metasurveys. 8 To collect response-process data, we used the same five probes for the CI group and the RPE group: a response probe, a comprehension probe, a paraphrase probe, a category-selection probe, and a catch-all probe. The 30 interviews were conducted by three trained interviewers. The interviews were scripted; that is, the interviewers did not ask any spontaneous follow-up questions. All data were transcribed using Zoom’s transcription software and then manually checked and corrected as needed by the interviewer. Some of the transcripts were modified slightly to remove filler words, meaningless partial sentences, or needlessly repeated words so that it would not be obvious which method was used to collect the data. 9 The CI data were subsequently combined with the RPE data, randomized and blinded, and given to three trained coders to evaluate independently. After coding independently, the coders met in a series of three meetings to discuss their codes and arrive at one overall code for each respondent. Once the final codes were decided, coders went through the file independently to review the final codes and check if they felt that any changes should be made.
Coding scheme
To code response quality and completeness, we used the same response code described earlier in the article (which coincidentally aligned well with that used by Edgar et al., 2016). Responses were coded holistically and assigned a code of understood, likely understood, not enough information, likely not understood, not understood, or nonresponse. If a response was coded understood or not understood, it was given a completeness code of “complete response,” indicating that no further probes would be necessary. If a response was coded likely understood or likely not understood, it was given a completeness code of “additional probe helpful but not necessary,” indicating that although we would like to ask the participant a follow-up question, we felt that the data provided were sufficient to evaluate interpretability. If a response was coded not enough information or nonresponse, it was given a completeness code of “additional probes necessary,” signifying that we were unable to evaluate interpretability with the data provided. For examples of responses corresponding to each completeness code, see Table 9.
Examples of Responses and Corresponding Codes for the Comparison With Cognitive Interviews

Coders also recorded the reason the final code was assigned, which we refer to as the theme(s) in each response. This allowed us to evaluate if the item was misunderstood for similar reasons by both RPE and CI participants, for example, if similar information was elicited by both methods. If similar themes were elicited from both methods, we could be confident that we would arrive at the same motivations for revisions and thus likely converge on a similar item revision independent of the method used. Illustrations of response themes are found in the last column of Table 9. For example, the theme “action” was recorded if the participant’s response appeared to reference an “act” of compassion rather than or in addition to a “feeling” of compassion. If we believed that a participant felt that an action was necessary to endorse the item, we would code their response as not understood or likely not understood because action was not part of our intended interpretation (see Table 4). If a large proportion of participants misinterpreted the item because of this, that would let us know that we should revise the item to make it clear that an “act of compassion” was not necessary to endorse it.
Participants
Participants were recruited on Prolific (www.prolific.co), a crowdsourcing, web-based platform similar to MTurk that connects researchers with participants. Participants were invited to sign up for either a 10-min Zoom interview or a 5-min survey. Because the interview took more time and required participants to be willing to schedule and attend an interview at a later date with their camera on, we paid $4 to the CI group and $1 to the RPE-method group. The total sample size for each group was 30.
The participants in each group had similar demographics. The average age of the CI group was 40 (minimum = 22, maximum = 72), and the average age of the RPE group was 42.4 years (minimum = 20, maximum = 66). Both groups were majority female (60%). White was the most common race/ethnicity in each group (56.7% for CI; 66.7% for RPE), followed by Black (20% for each group) and Hispanic (10% for each group). Both groups had similar levels of education (59.3% of CI participants and 66.7% of RPE participants graduated from college) and similar current student statuses (83.3% of participants in both groups were not currently students).
Results
Including Prolific platform fees, the total cost of CI data was $160, and the total cost of RPE data was $40 (interviewers were unpaid, which contributed to a significant cost savings for the CI data). The process of collecting CI data, transcribing it, and creating a coding file was significantly more time-consuming than the act of administering metasurveys to collect RPE data. Each interview took an average of 7 min 14 s (minimum = 3:52, maximum = 12:45). We estimated that reviewing and revising the transcriptions and updating the coding file took approximately 20 min per participant, and the administrative work (coordinating interview times, communicating with other interviewers and participants, setting up Zoom and downloading the interview, and compensating participants) also took approximately 20 min per participant. In addition, 22 participants (42.3%) did not show up for their scheduled interview. The total time commitment for the CI data (including time spent waiting for no-shows) was 27 hr 16 min. By comparison, it took us approximately 30 min of researcher time to post the metasurvey on Prolific to collect data for the RPE method.
CI participants used, on average, 4 times as many words to respond to each probe. The median word counts for the comprehension probe were 42 for CI and 14 for RPE, and the median word counts for the paraphrase probe were 43 for CI and 11 for RPE. For the category-selection probe, the median word counts were 107 for CI and 24.5 for RPE, and for the catch-all probe, the median word counts were 27.5 for CI and 1 for RPE. 10 Participants from both groups endorsed the item at similar rates (80% of CI participants selected yes, and 66.67% of RPE participants selected the yes response).
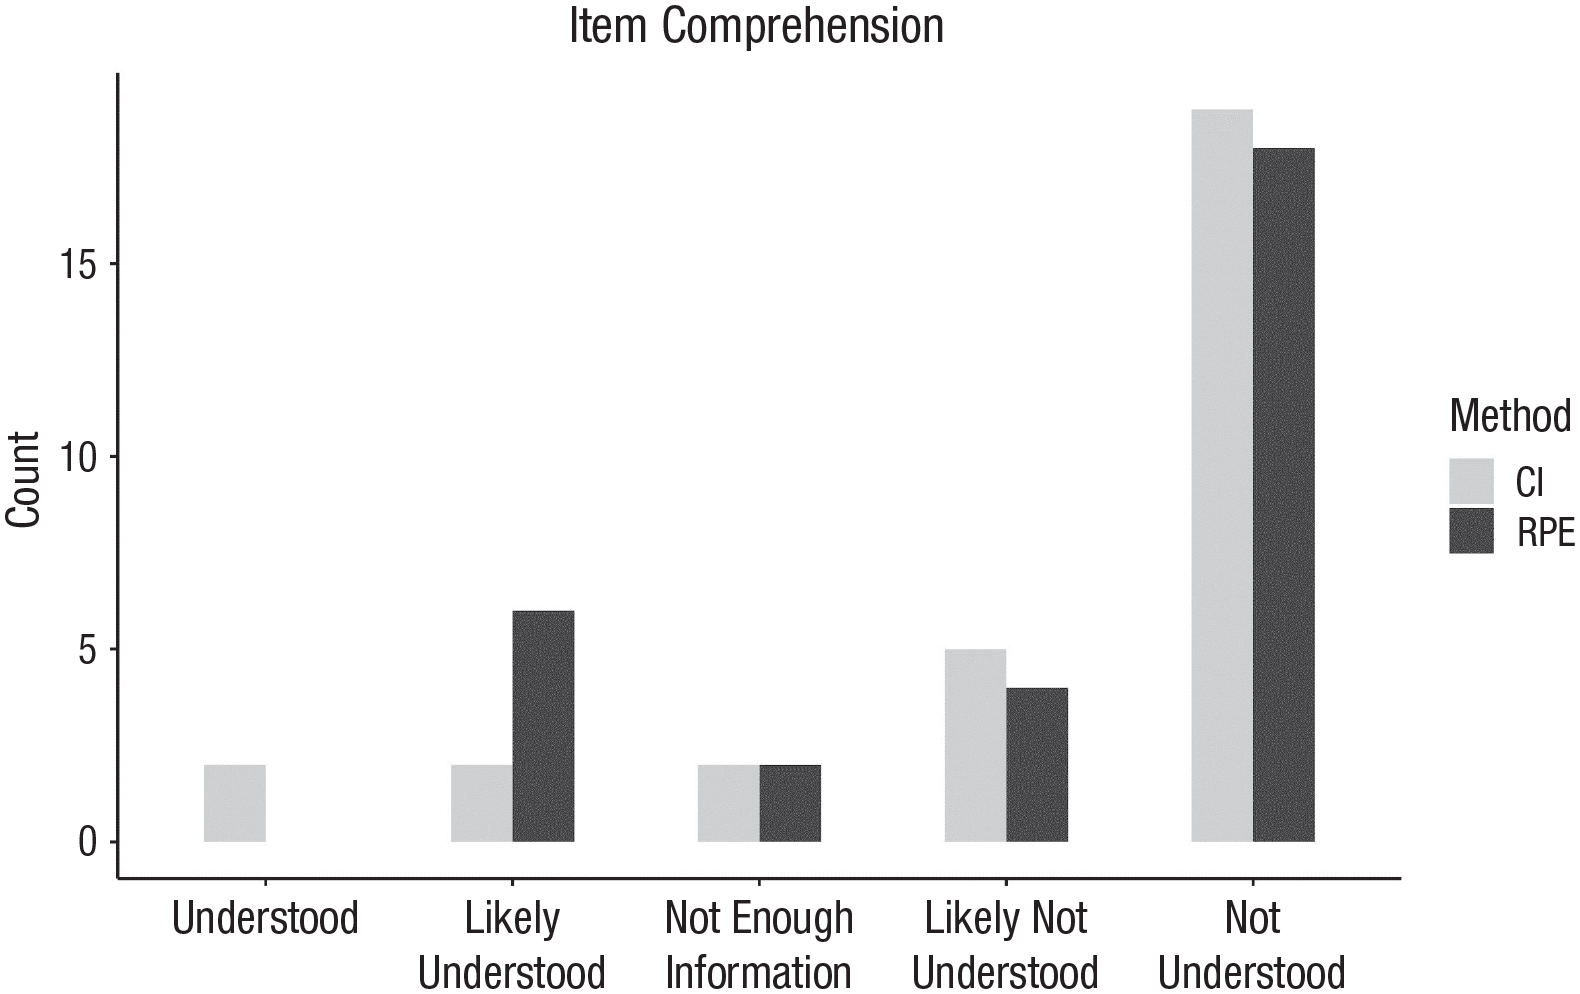
The survey item was misunderstood at similar rates by CI and RPE participants (see Fig. 2). Most participants in both groups did not understand the item as intended (22 RPE participant responses and 24 CI participant responses were coded as not understood or likely not understood). Furthermore, reasons for miscomprehensions were similar in both groups (see Fig. 3). The belief that an act of compassion was necessary to endorse the item affirmatively was the most prominent response theme in both groups, and a description of compassion that was felt or received from others was the second most common misinterpretation. RPE participants gave shorter responses more often than CI participants, which sometimes caused a downgrade in the completeness or quality code. Indeed, CI participants gave complete responses slightly more often than RPE participants (21 CI responses were coded as complete response compared with 18 RPE responses; see Fig. 4). However, 90% of responses in both groups contained enough information to make a final judgment call (i.e., only two responses in each group were coded as additional probe needed).
The number of participants in each group that understood the item as intended.

The number of responses that contained each theme. Each response could contain more than one theme. For example, if a participant seemed unclear about the definition of compassion and also described an experience in which the participant witnessed an act between others, the response would be coded both “compassion witnessed” and “definition.” Readers interested in the meaning of each theme can find a longer discussion at https://osf.io/8pwfj.

The quality or completeness of responses from each group. Responses coded as “understood” or “not understood” were coded as “complete response,” and responses coded as “likely understood” or “likely not understood” were coded as “additional probe helpful.”
Conclusion
We found that both methods produced data that resulted in similar conclusions about the interpretability of the item and necessity of revisions. Both groups did not understand the item as intended and misinterpreted it for similar reasons. This caused the coders to recommend similar revisions to the item with a focus on two themes: action and compassion received. In other words, both methods were equally capable of elucidating the reasons the item was misunderstood, which can then be used to facilitate modifications that improve the interpretability of the item in the target population.
Data quality was slightly higher for the CI group, although both groups provided actionable information in the majority (90%) of their responses. The CI data cost 4 times as much to produce as RPE data and took almost 55 times longer to collect. Thus, we found that the RPE method significantly reduced the burden on resources while still providing data of comparable quality. Furthermore, the RPE method is uniquely equipped to easily test several different revisions of the item, all of which could reasonably be suggested given participant feedback. This gives researchers the opportunity to investigate if there was an improvement in interpretability and ensure that a revision did not lead to new problems or misinterpretations. In addition, it is unlikely that anyone would conduct 30 CIs per survey item given how resource-intensive they are; thus, the RPE method is also uniquely equipped to easily capture a wide range of potential misinterpretations.
Our findings were similar to Edgar et al. (2016) in that the response to a single probe was often insufficient to evaluate the participant’s response process for either CIs or web probing. Instead, we found that multiple probes were typically necessary to make a holistic decision about interpretability. Unlike Edgar et al., we did not test if the addition of unscripted verbal probes would yield more actionable information than the methods used above. Although we expect that this approach would give high-quality data, we feel confident concluding that the item was not understood as intended and required revisions in line with the themes that we noticed in participant responses.
Discussion
Although it is generally agreed that investigations of cognitive-response processes are critical for survey-instrument construction and validation, such research is rarely published, rendering the extent to which it is conducted questionable (Cizek et al., 2008; Fowler & Willis, 2020; Hubley et al., 2014; Peterson et al., 2017). Recognized strategies for collecting such evidence, such as cognitive interviewing and web probing, do not have widely accepted standardized reporting frameworks or offer a way to iteratively test multiple versions of the same item to determine if modifications have improved item interpretability (Castillo-Díaz & Padilla, 2013; Hilton, 2017). The RPE method offers an evidence-based approach to item development by turning CIs into metasurveys through the use of web probing. This allows researchers to efficiently test multiple versions of items, quantify and qualify improvements in interpretability, and potentially create searchable item repositories through the generation of standardized item-validation reports. Thus, the RPE method allows researchers to test if there is a shared understanding about item meaning in their target population on a large scale—a practice that might seem foundational to social-science research but has thus far largely been neglected.
By contrast, it is relatively common for reports of instrument construction and validation to make use of latent-variable models (e.g., factor analysis, item-response theory), reliability coefficients, and statistical forms of evidence, such as correlations with other variables. A series of journal reviews revealed that reliability coefficients can be found in up to 90.2% of validation articles, correlations with other variables are found as often as 76.8% of the time, and latent-variable modeling can be found as often as 73.2% (Barry et al., 2014; Chinni & Hubley, 2014; Cizek et al., 2008; Flake et al., 2017; Hubley et al., 2014). However, evidence of item pretesting or response-process evidence was found in, at most, only 1.8% of validation articles. Although these popular forms of evidence may be valuable in some instances, they are generally not sufficient on their own to either establish confidence in the use of an instrument (as discussed in the introduction) or provide clear guidance for instrument revision. Several articles have demonstrated that satisfactory quantitative results can be found absent of meaning or measurement (see e.g., Arnulf et al., 2014, 2018; Hayduk, 2014; Rhemtulla et al., 2020). Specifically, misspecified confirmatory-factor-analysis (CFA) models or surveys composed entirely of blank items can return indicators of adequate model fit, suggesting that model fit cannot be relied on in isolation to evaluate if item responses are caused by a psychological attribute (Maul, 2017). More concerningly, recent research suggests that the cutoff values that researchers typically rely on to evaluate CFA model fit have been inappropriately generalized to all model subspaces, throwing the validity of scales that rely exclusively on such evidence into question (Heene et al., 2011; Marsh et al., 2004; McNeish et al., 2018; McNeish & Wolf, 2023).
The omnipresence of reliability coefficients and latent-variable modeling in the instrument-validation literature may have inadvertently created an atmosphere in which researchers believe that their instruments must yield desirable properties for these models, causing statistics to drive psychological theory. For example, researchers may believe that they need to have several items designed to reflect a latent variable, that the corresponding psychological property must have an underlying structure that is continuous in nature, and that survey-item responses should be independent of each other after controlling for the latent variable. However, this is not necessarily a requirement of psychological measurement. Other psychometric models, such as ecological momentary assessment, psychological network analysis (PNA), and mixture models, can be used when researchers have different hypotheses about the structure of psychological properties (Borsboom et al., 2016). For example, mixture models should be used if researchers hypothesize that people can be classified into discrete categories (i.e., clinically significant or not clinically significant), which is common in social-science research. If researchers believe that psychological disorders arise from feedback loops between symptoms (i.e., survey items), PNA would be a more appropriate psychometric model (Borsboom, 2017). Alternatively, researchers may need to create a brief, one-item scale or prefer to use a sum score instead of a more advanced psychometric model. Although these models may more accurately capture the structure of psychological properties, they do not have a similar quantitatively testable assumption about variation in the attribute causing variation in the item responses. Thus, collecting qualitative evidence to evaluate individual item quality may be even more important with these models given that they lack a traditional quantitative validation framework in which this hypothesis can be tested.
Quantitative analyses might be best thought of as providing high-level checks on specific hypotheses relevant to validity, with response-process-oriented investigations providing more targeted information useful for item development and revision; for example, investigations of measurement invariance, such as differential item functioning, might flag items that consistently function differently for individuals from particular backgrounds, although without qualitative inquiry, it will be unclear why these items did not function as intended or if simply removing them would threaten the validity of the instrument (Padilla & Benítez, 2014). Items that are consistently misinterpreted irrespective of one’s background might be undetectable by statistical modeling, especially if there are many such items. Note that no amount of statistical manipulation can resolve poorly worded or poorly chosen items (Maul, 2017; Streiner & Norman, 2008).
It might be argued that it is not always necessary to conduct investigations of cognitive-response processes (AERA et al., 2014; Kane & Mislevy, 2017); in particular, in some instances, researchers might care only about the extent to which item responses predict a specified outcome, without the need to explain the mechanism for this prediction (sometimes referred to as a “black box” model; see e.g., Launeanu & Hubley, 2017). For example, if a given screening test for airplane pilots does a better job of predicting which individuals are most likely to succeed in safely piloting airplanes than any other test, it could be argued on pragmatic grounds that this test should be used to maximize safety even if the response processes at play for individual items are not fully known. However, if understanding the psychological processes that generated the data was an important element of the researcher’s validity argument, then it would be critical to provide evidence to rule out rival hypotheses about the factors driving test performance (Messick, 1995; Padilla & Benítez, 2014)—and even in the example of the screening test for airplane pilots, it would stand to reason that investigation of the relevant cognitive-response processes might be considered a high research priority for the sake of improving understanding of the cognitive factors at work in safely flying airplanes. Furthermore, having information about the interpretability and meaning of items in the population of interest would likely yield more confidence in the selection of individual items and the subsequent interpretation of modeling results.
The RPE method provides an avenue for collecting and documenting evidence of response processes involved in survey-item construction and revision and offers a more efficient and less resource-intensive alternative to traditional CIs. It also helps shift the primary approach to validation in psychology away from pure quantification. Although psychometric models are important, the practice of instrument validation would benefit from testing the interpretability and meaning of survey items in the target audience.
Supplemental Material
sj-docx-1-amp-10.1177_25152459251353135 – Supplemental material for The Response-Process-Evaluation Method: A New Approach to Survey-Item Validation
Supplemental material, sj-docx-1-amp-10.1177_25152459251353135 for The Response-Process-Evaluation Method: A New Approach to Survey-Item Validation by Melissa G. Wolf, Elliott Ihm, Andrew Maul and Ann Taves in Advances in Methods and Practices in Psychological Science
Footnotes
Transparency
Action Editor: Jessica K. Flake
Editor: David A. Sbarra
Author Contributions
Notes
References
Supplementary Material
Please find the following supplemental material available below.
For Open Access articles published under a Creative Commons License, all supplemental material carries the same license as the article it is associated with.
For non-Open Access articles published, all supplemental material carries a non-exclusive license, and permission requests for re-use of supplemental material or any part of supplemental material shall be sent directly to the copyright owner as specified in the copyright notice associated with the article.