
Abstract
Large-scale collaborative projects recently demonstrated that several key findings from the social-science literature could not be replicated successfully. Here, we assess the extent to which a finding’s replication success relates to its intuitive plausibility. Each of 27 high-profile social-science findings was evaluated by 233 people without a Ph.D. in psychology. Results showed that these laypeople predicted replication success with above-chance accuracy (i.e., 59%). In addition, when participants were informed about the strength of evidence from the original studies, this boosted their prediction performance to 67%. We discuss the prediction patterns and apply signal detection theory to disentangle detection ability from response bias. Our study suggests that laypeople’s predictions contain useful information for assessing the probability that a given finding will be replicated successfully.
Keywords
Recent work has suggested that the replicability of social-science research may be disturbingly low (Baker, 2016). For instance, several systematic high-powered replication projects have demonstrated successful replication rates ranging from 36% (Open Science Collaboration, 2015) to 50% (Klein et al., 2018), 62% (Camerer et al., 2018), and 85% (Klein et al., 2014). These low replication rates have been explained by several factors that operate at different levels. At the level of the scientific field as a whole, problems include publication bias (Francis, 2013) and perverse incentive structures (Giner-Sorolla, 2012). At the level of individual studies, problems concern low statistical power (Button et al., 2013; Ioannidis, 2005) and questionable research practices, such as data-driven flexibility in statistical analysis (i.e., significance seeking; John, Loewenstein, & Prelec, 2012; Simmons, Nelson, & Simonsohn, 2011; Wagenmakers, Wetzels, Borsboom, & van der Maas, 2011). Here we focus on yet another problem that has recently been associated with poor replicability: the a priori implausibility of the research hypothesis (Benjamin et al., 2018; Ioannidis, 2005).
If the a priori implausibility of the research hypothesis is indicative of replication success, then replication outcomes can be reliably predicted from a brief description of the hypothesis at hand. Indeed, results from recent surveys and prediction markets demonstrated that researchers (i.e., experts) in psychology and related social sciences can anticipate replication outcomes with above-chance accuracy. As a group, experts correctly predicted the replication outcomes for 58%, 67%, and 86% of the studies included in the Reproducibility Project: Psychology (Dreber et al., 2015), the Many Labs 2 project (ML2; Forsell et al., 2018), and the Social Sciences Replication Project (SSRP; Camerer et al., 2018), respectively. These surveys and prediction markets involved forecasters with a Ph.D. in the social sciences (e.g., psychology, economics). In addition, the forecasters in the studies by Forsell et al. and Camerer et al. had been provided with statistical information from the original studies, including p values, effect sizes, and/or sample sizes. These findings raise two key questions about anticipated replicability: First, do forecasters need to be social-science experts to predict replication outcomes with above-chance accuracy? Second, are forecasters’ predictions driven by intuitions about empirical plausibility alone or also influenced by statistical information about the original effect?
In this study, our primary aim was to investigate whether and to what extent accurate predictions of replicability can be generated by people without a Ph.D. in psychology or other professional background in the social sciences (i.e., laypeople) and without access to the statistical evidence obtained in the original study. Laypeople may be able to reliably evaluate the plausibility of research hypotheses (and hence reliably predict replication outcomes), even without access to relevant statistical information or in-depth knowledge of the literature. After all, social science concerns itself with constructs that are often accessible and interesting to a lay audience (Milkman & Berger, 2014). Consequently, when presented with a nontechnical description of a study’s topic, operationalization, and result, laypeople may well be able to produce accurate replicability forecasts. For example, consider the nontechnical description of Kidd and Castano’s (2013) research hypothesis that we presented to participants in our study: Can reading literary fiction improve people’s understanding of other people’s emotions? Participants read a short text passage. In one group, the text passage was literary fiction. In the other group, the text passage was non-fiction. Afterwards, participants had to identify people’s expressed emotion (e.g., happy, angry) based on images of the eyes only. Participants were better at correctly recognizing the emotion after reading literary fiction.
A general understanding of the concepts (e.g., literary fiction, emotions) and proposed relation between those concepts (e.g., reading literary fiction improves emotion recognition) may suffice to form intuitions about plausibility that match the (eventual) empirical evidence. The accuracy of such intuitions can be gauged by comparing laypeople’s predictions with the empirical outcome. Hence, to test the accuracy of laypeople’s intuitions about the plausibility of research hypotheses, we selected 27 high-profile findings that have recently been submitted to high-powered replication attempts (Camerer et al., 2018; Klein et al., 2018).
If laypeople can indeed make accurate predictions about replicability, these predictions may supplement theoretical considerations concerning the selection of candidate studies for replication projects. Given limited resources, laypeople’s predictions concerning replicability could be used to define the subset of studies for which one can expect to learn the most from the data. In other words, researchers could use laypeople’s predictions as input to assess information gain in a quantitative decision-making framework for replication (Hardwicke, Tessler, Peloquin, & Frank, 2018; MacKay, 1992). This framework follows the intuition that—for original studies with surprising effects (i.e., low plausibility) or small sample sizes (i.e., little evidence)—replications can bring about considerable informational gain.
More generally, if even laypeople can to a large extent correctly pick out unreplicable findings, this suggests that researchers should be cautious when making bold claims on the basis of studies with risky and counterintuitive hypotheses. Laypeople’s adequate predictions of replicability may thus provide empirical support for a culture change that emphasizes robustness and “truth” over novelty and “sexiness” (Dovidio, 2016; Giner-Sorolla, 2012; Nosek, Spies, & Motyl, 2012). When extended to novel hypotheses, laypeople’s skepticism may even serve as a red flag, prompting researchers to go the extra mile to convince their audience—laypeople and peers alike—of the plausibility of their research claim (e.g., by using larger samples, engaging in Registered Reports, or setting a higher bar for evidence; see Benjamin et al., 2018; Chambers, 2013).
The secondary aim of the current study was to assess the extent to which the inclusion of information about the strength of the evidence obtained in an original study improves laypeople’s prediction of replication outcomes. In contrast to the investigations of experts’ prediction accuracy by Camerer et al. (2018) and Forsell et al. (2018), we used Bayes factors rather than p values and effect sizes to quantify the evidence in the original studies (Jeffreys, 1961; Kass & Raftery, 1995).
We preregistered the following hypotheses: First, we hypothesized that, on the basis of assessments of the a priori plausibility of the research hypotheses at hand, (a) laypeople can predict replication success with above-chance accuracy, and (b) their confidence is associated with the magnitude of the observed effects of interest in the replication studies. The former hypothesis would be supported by prediction accuracy above 50% and the latter by a positive correlation between people’s confidence in replicability and the effect size in the replication. In addition, we hypothesized that the inclusion of information on the strength of the original evidence (i.e., the Bayes factor) would improve prediction performance.
Disclosures
Preregistration
The current study was preregistered on the Open Science Framework. The preregistration documents are available at https://osf.io/wg9s3/.
Data, materials, and online resources
Readers can access all materials, reanalyses of the original studies, the anonymized raw and processed data (including relevant documentation for the data of ML2 and SSRP), and the R code to conduct all our confirmatory and exploratory analyses (and for all figures created in R) in our Open Science Framework project at https://osf.io/wg9s3. In the Supplemental Material (http://journals.sagepub.com/doi/10.1177/2515245920919667), we provide additional details on the methods and additional exploratory analyses. Specifically, the online supplement presents details on the Bayesian reanalyses of the original studies, the sampling plan, and the statistical models and prior specifications; includes tables with the descriptions (in English and Dutch) of all the original studies as presented to the participants; and reports two additional exploratory analyses. The first of these analyses concerns the accuracy of predictions derived from the Bayes factors alone, without human evaluation, and the second analysis is a Bayesian logistic regression model that includes random effects for both participants and studies.
Reporting
We report how we determined our sample size, all data exclusions, all manipulations, and all measures in the study.
Ethical approval
The study was approved by the local ethics board of the University of Amsterdam, and all participants were treated in accordance with the Declaration of Helsinki.
Method
Participants
In total, we obtained data from 257 participants, who were recruited from the online platform Amazon Mechanical Turk (MTurk; n = 83), the online participant pool of first-year psychology students at the University of Amsterdam (n = 138), and social-media platforms such as Facebook (n = 36). Participants from MTurk received financial compensation, University of Amsterdam students received research credits, and participants from social media were given the opportunity to enter a raffle for a voucher from a Dutch Web shop. After exclusions (discussed later in this section), the final sample consisted of 233 participants, 123 in the description-only condition and 110 in the description-plus-evidence condition.
Sampling Plan
We determined that we would need a minimum of 103 observations per condition to achieve an 80% probability of obtaining strong evidence (i.e., a Bayes factor > 10) in favor of our experimental hypothesis, assuming a medium effect size (δ = 0.5), a default Cauchy prior with a scale parameter of r = .707, and a study design comparing two independent groups (i.e., a t test). As preregistered, data collection continued after the minimum number of participants was reached (i.e., 103 in each condition), until the preestablished data-collection termination date of April 22, 2019.
Materials
Participants were presented with 27 studies, a subset of the studies included in the SSRP (Camerer et al., 2018) and the ML2 project (Klein et al., 2018).
Study selection
In the description-plus-evidence condition, participants were provided with study descriptions accompanied by Bayes factors indicating the strength of the original evidence. Therefore, one of the main criteria for inclusion in the set of studies was that the original analysis allowed for a Bayesian reanalysis using the Summary Stats module in JASP (JASP Team, 2019); that is, the main analysis had to have been conducted using a paired-samples or independent-samples t test, a correlation test, or a binomial test. 1 Details about the reanalyses are provided in the Supplemental Material. We subsequently checked whether the percentage of successful replications in our subset was similar to the percentages in ML2 and the SSRP (i.e., 50% and 62%). This was the case; our subset included 14 successful and 13 unsuccessful replications (i.e., 52% successful).
Presentation of studies
The materials for each study included a short description of the research question, its operationalization, and the key finding. These descriptions were inspired by those provided in the SSRP and ML2, but were rephrased to be comprehensible by laypeople. In the description-only condition, solely these descriptive texts were provided; in the description-plus-evidence condition, the Bayes factor and its verbal interpretation (e.g., “moderate evidence”) were added to the description of each study. The verbal interpretations were based on a classification scheme proposed by Jeffreys (1939) and adjusted by M. D. Lee and Wagenmakers (2013, p. 105). These verbal labels were added to help participants interpret the Bayes factors, because the concept of evidence ratios might be difficult or ambiguous for laypeople (Etz, Bartlema, Vanpaemel, Wagenmakers, & Morey, 2019). To prevent participants from reading about the replication outcomes of the original studies during the survey itself, we ensured that the descriptions did not contain identifying information, such as the names of the authors, the study titles, or any direct quotes. In addition to the 27 study descriptions, the survey included one bogus item as an attention check. In the description of this study, participants were instructed to answer “no” to the question of whether the study would be replicated and to indicate a confidence of 75% in this prediction. Participants from The Netherlands could choose to read the study descriptions in English or Dutch. The translation of the descriptions from English into Dutch was assisted by the online translation software DeepL (https://www.deepl.com/en/translator).
Procedure
The survey was generated using the online survey software Qualtrics (https://www.qualtrics.com). Participants were randomly assigned to the description-only or the description-plus-evidence condition. First, they read an explanation of the term replication and its relevance in science: “You will be asked whether you think that the described study will replicate. This means: if an independent lab will do this study again with a large number of participants, using the same materials, will they find convincing evidence for the same effect? If the effect really exists, it should be found by a different lab. However, it seems that not all studies can be replicated, because some results are based on coincidence, or poorly designed or executed studies.” Participants in the description-plus-evidence condition additionally received a short explanation of the Bayes factor and the commonly used verbal categories for interpreting the strength of evidence they indicate (Lee & Wagenmakers, 2013, p. 105). The explanation of the Bayes factor was as follows: “A Bayes factor (BF) is the degree to which evidence is found for the existence of the effect, based on the data at hand. For instance, if BF = 2, the data suggest that it is 2 times more likely that the effect is present, than that there is no effect.” 2
After the instructions, participants were presented with the 27 studies plus the bogus attention-check study. Each study was presented and rated on a separate page. After reading the study description (and the Bayes factor plus verbal interpretation in the description-plus-evidence condition), participants could select a tick box to indicate that they did not understand the description. Next, participants indicated whether they believed that the study would be replicated successfully (yes/no) and expressed their confidence in their decision on a sliding scale ranging from 0 to 100. The order in which the studies were presented was randomized across participants. 3 Finally, at the end of the survey, participants were asked whether they were already familiar with the ML2 project or the SSRP.
Data exclusions
Following our preregistered plan, we excluded participants (a) if they had a Ph.D. in psychology (i.e., they qualified as experts rather than laypeople), (b) if they indicated that they did not understand more than 50% of the descriptions, (c) if they did not read the descriptions carefully (i.e., they failed the included attention check), or (d) if they were already familiar with either of the replication projects from which the studies were drawn. We applied a more stringent definition of experts than did previous survey studies of prediction accuracy (i.e., Camerer et al., 2018; Dreber et al., 2015; Forsell et al., 2018); whereas the previous studies defined experts as researchers in psychology, ranging from graduate students to full professors, we defined experts as people with a Ph.D. degree in psychology and hence classified graduate students as laypeople. 4 Participants who indicated that they had a Ph.D. in psychology were immediately redirected to the end of the survey and could not complete the study. As specified in our preregistration, participants passed the attention check if they answered as explicitly instructed, that is, if they selected “no” as their answer to the dichotomous replication question and rated their confidence in the interval between 70% and 80%. We excluded 3 participants because they indicated that they were familiar with the replication projects and 22 participants because they failed the attention check. No participants indicated that they understood less than 50% of the study descriptions. In total, we excluded 1.6% (i.e., 99) of all predictions because participants indicated that they did not understand the study description. Seventy-two percent of participants (i.e., 167) understood all the study descriptions.
Statistical models
We constructed Bayesian (hierarchical) models to estimate and test the parameters of interest for our hypotheses. For all analyses, the outcome measures were chosen according to what was most relevant and informative for answering the research questions. For the primary analysis, we estimated accuracy rates (0–1), as these afford the most intuitive and simple interpretation of prediction performance and are directly comparable with the measures used in previous prediction survey studies. The experimental effect of condition (description only vs. description plus evidence) was evaluated by means of Brier scores, because in this case the unit of interest was the individual’s prediction performance, which takes into account accuracy and confidence and is the most sensitive measure for comparing people’s performance across conditions. In the correlation analysis, the unit of interest was the study rather than the participant; hence, we looked at the confidence ratings per study (aggregated across participants). All models and priors are described in detail in the Supplemental Material.
Results
Descriptive pattern
Figure 1 displays participants’ confidence ratings for their predictions of the replicability of each of the 27 included studies, in order of the average rating. Positive ratings reflect confidence in replicability, and negative ratings reflect confidence in nonreplicability; −100 denotes extreme confidence that the effect would fail to be replicated. Note that these data were aggregated across the description-only and the description-plus-evidence conditions. The studies in the top 10 rows are studies for which participants showed relatively high agreement in predicting replication success. Out of these 10 studies, 9 were replicated successfully and only 1 was not (i.e., the study by Anderson, Kraus, Galinsky, & Keltner, 2012). The studies in the bottom 4 rows are studies for which participants showed relatively high agreement in predicting replication failure. In fact, none of these 4 studies were replicated successfully. For the remaining 13 studies in the middle rows, the group response was relatively ambiguous, as reflected by bimodal densities that were roughly equally distributed between the negative and positive ends of the scale. Out of these 13 studies, 5 were replicated successfully, and 8 failed to be replicated successfully. Overall, Figure 1 provides a compelling demonstration that laypeople are able to predict whether or not high-profile social-science findings will be replicated successfully. In Figure 2, participants’ predictions are displayed separately for the description-only and the description-plus-evidence conditions.
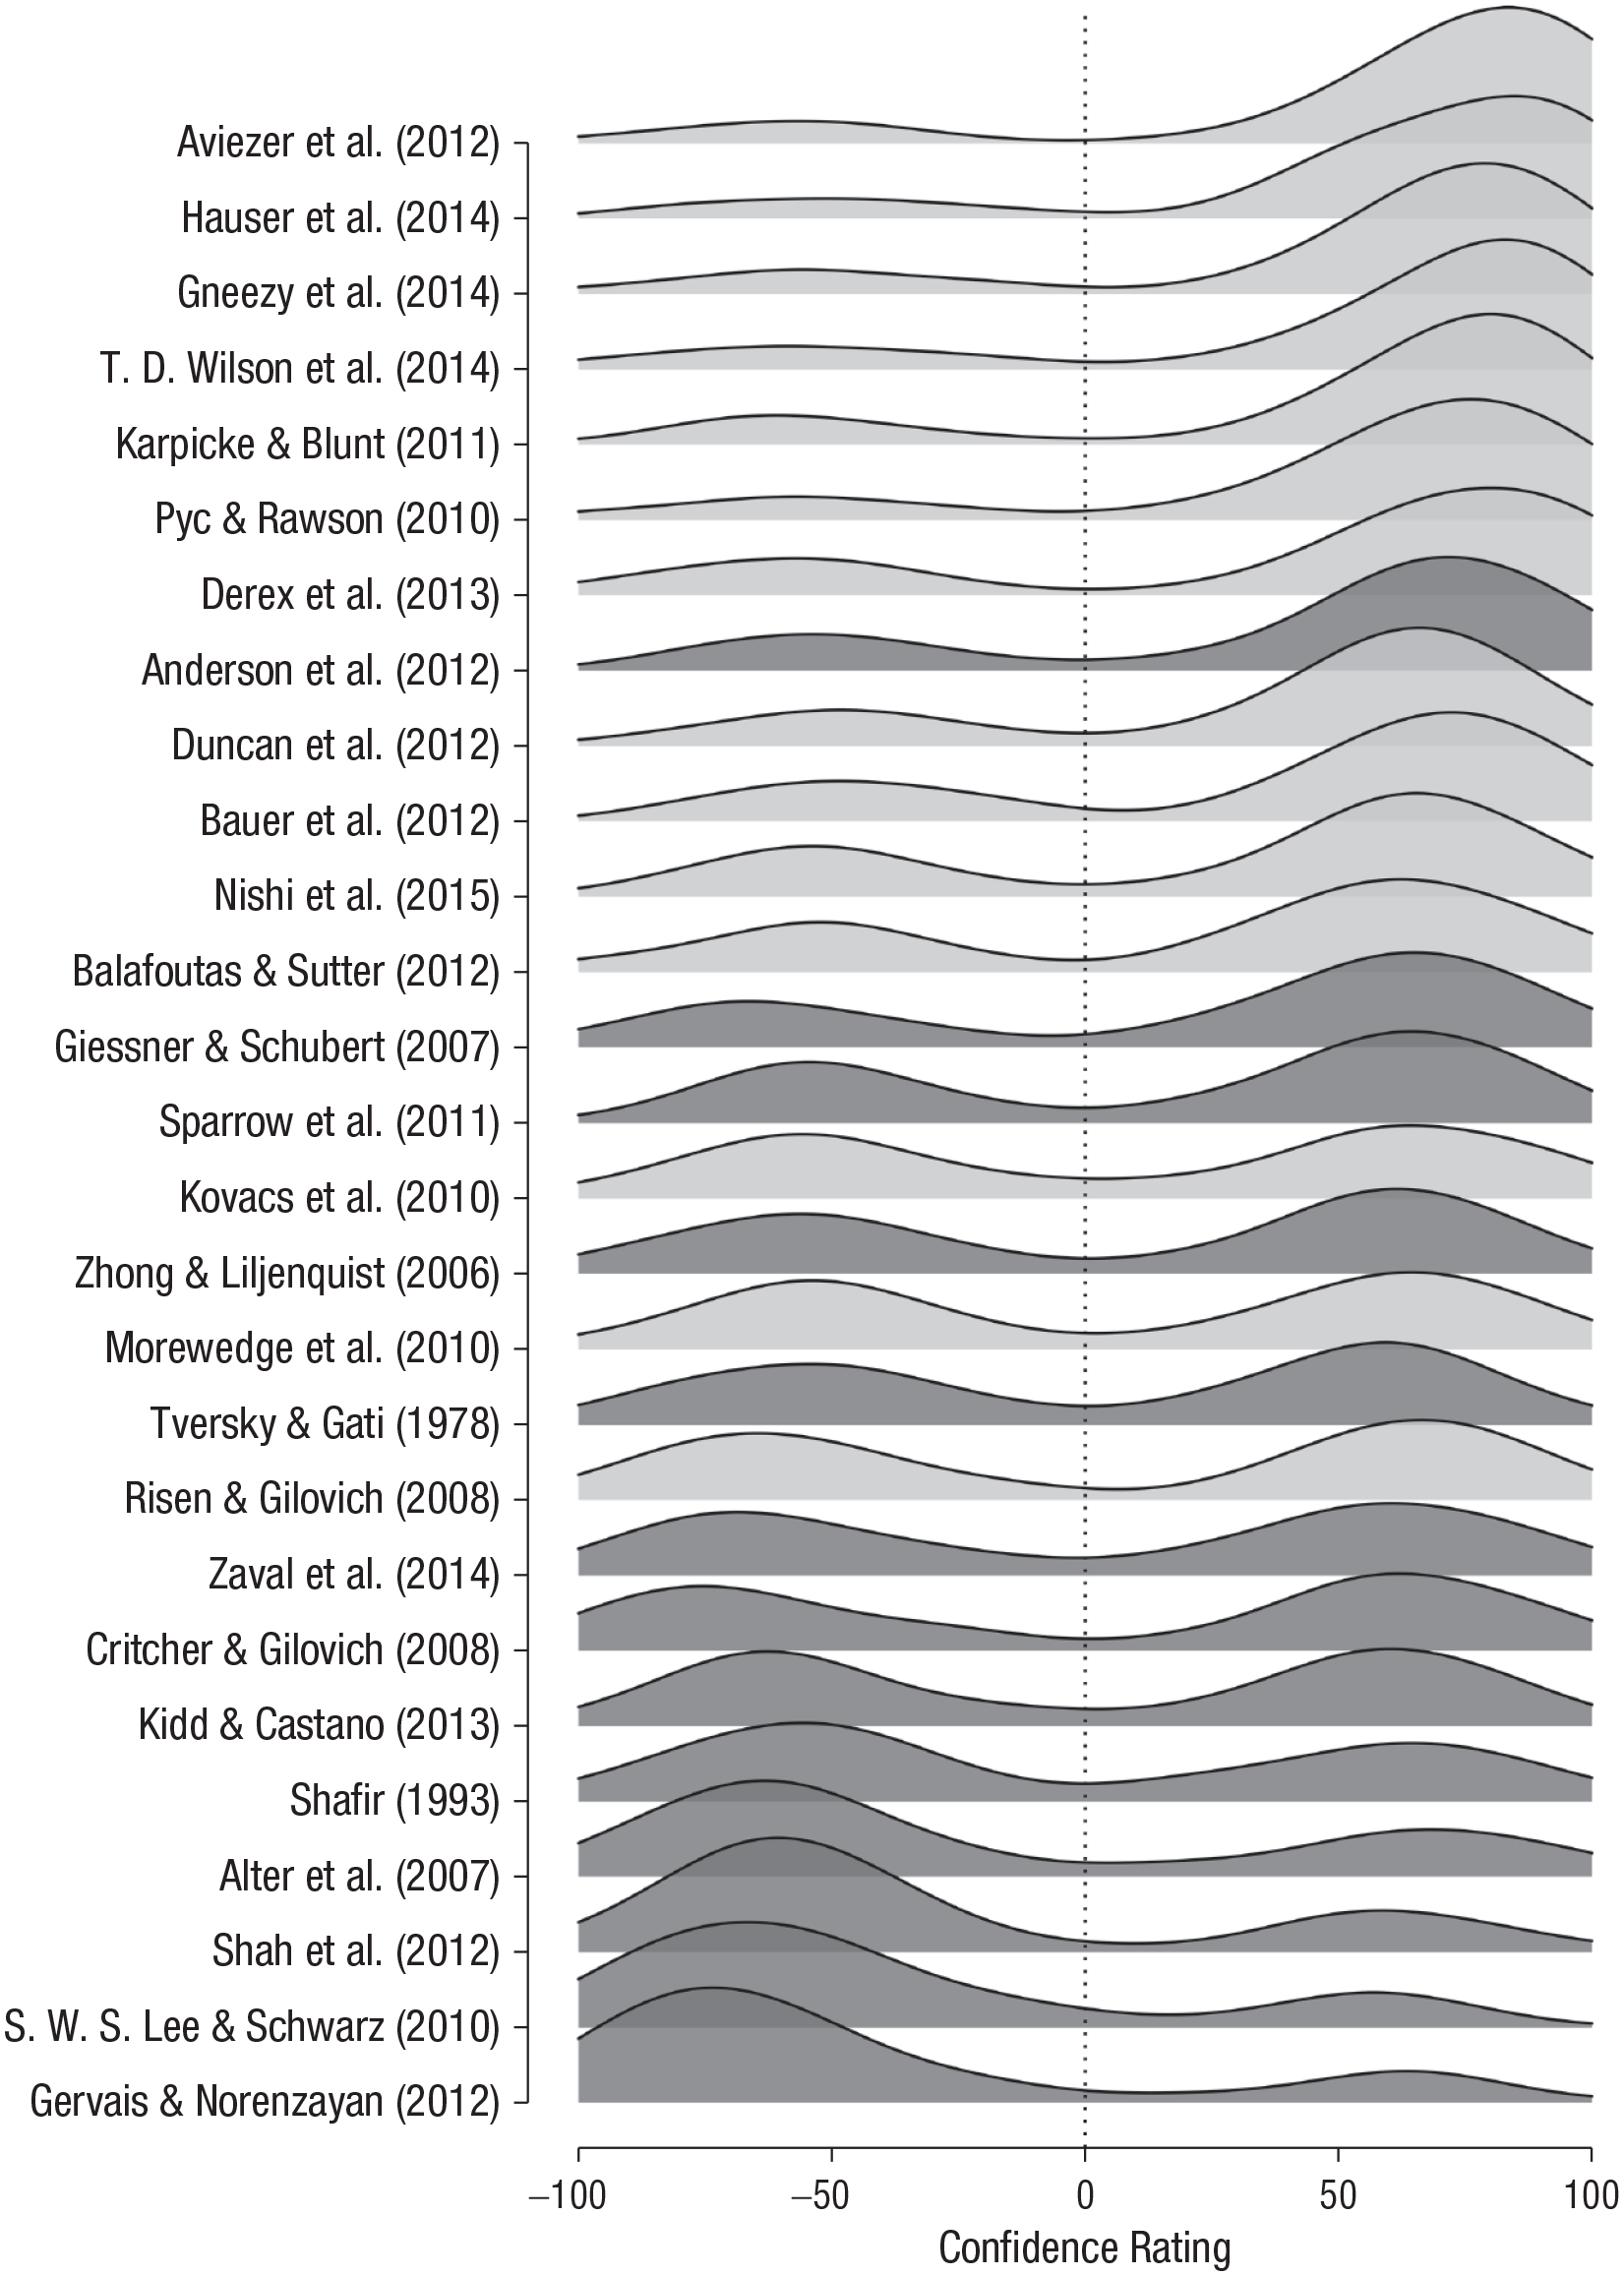
Distribution of participants’ confidence ratings for each of the 27 studies, aggregated over the two experimental conditions. The studies are ordered according to their average confidence ratings. Light-gray shading indicates that a study was successfully replicated, and dark-gray shading indicates that a study was not successfully replicated. Negative values indicate a prediction of replication failure, and positive values indicate a prediction of replication success.
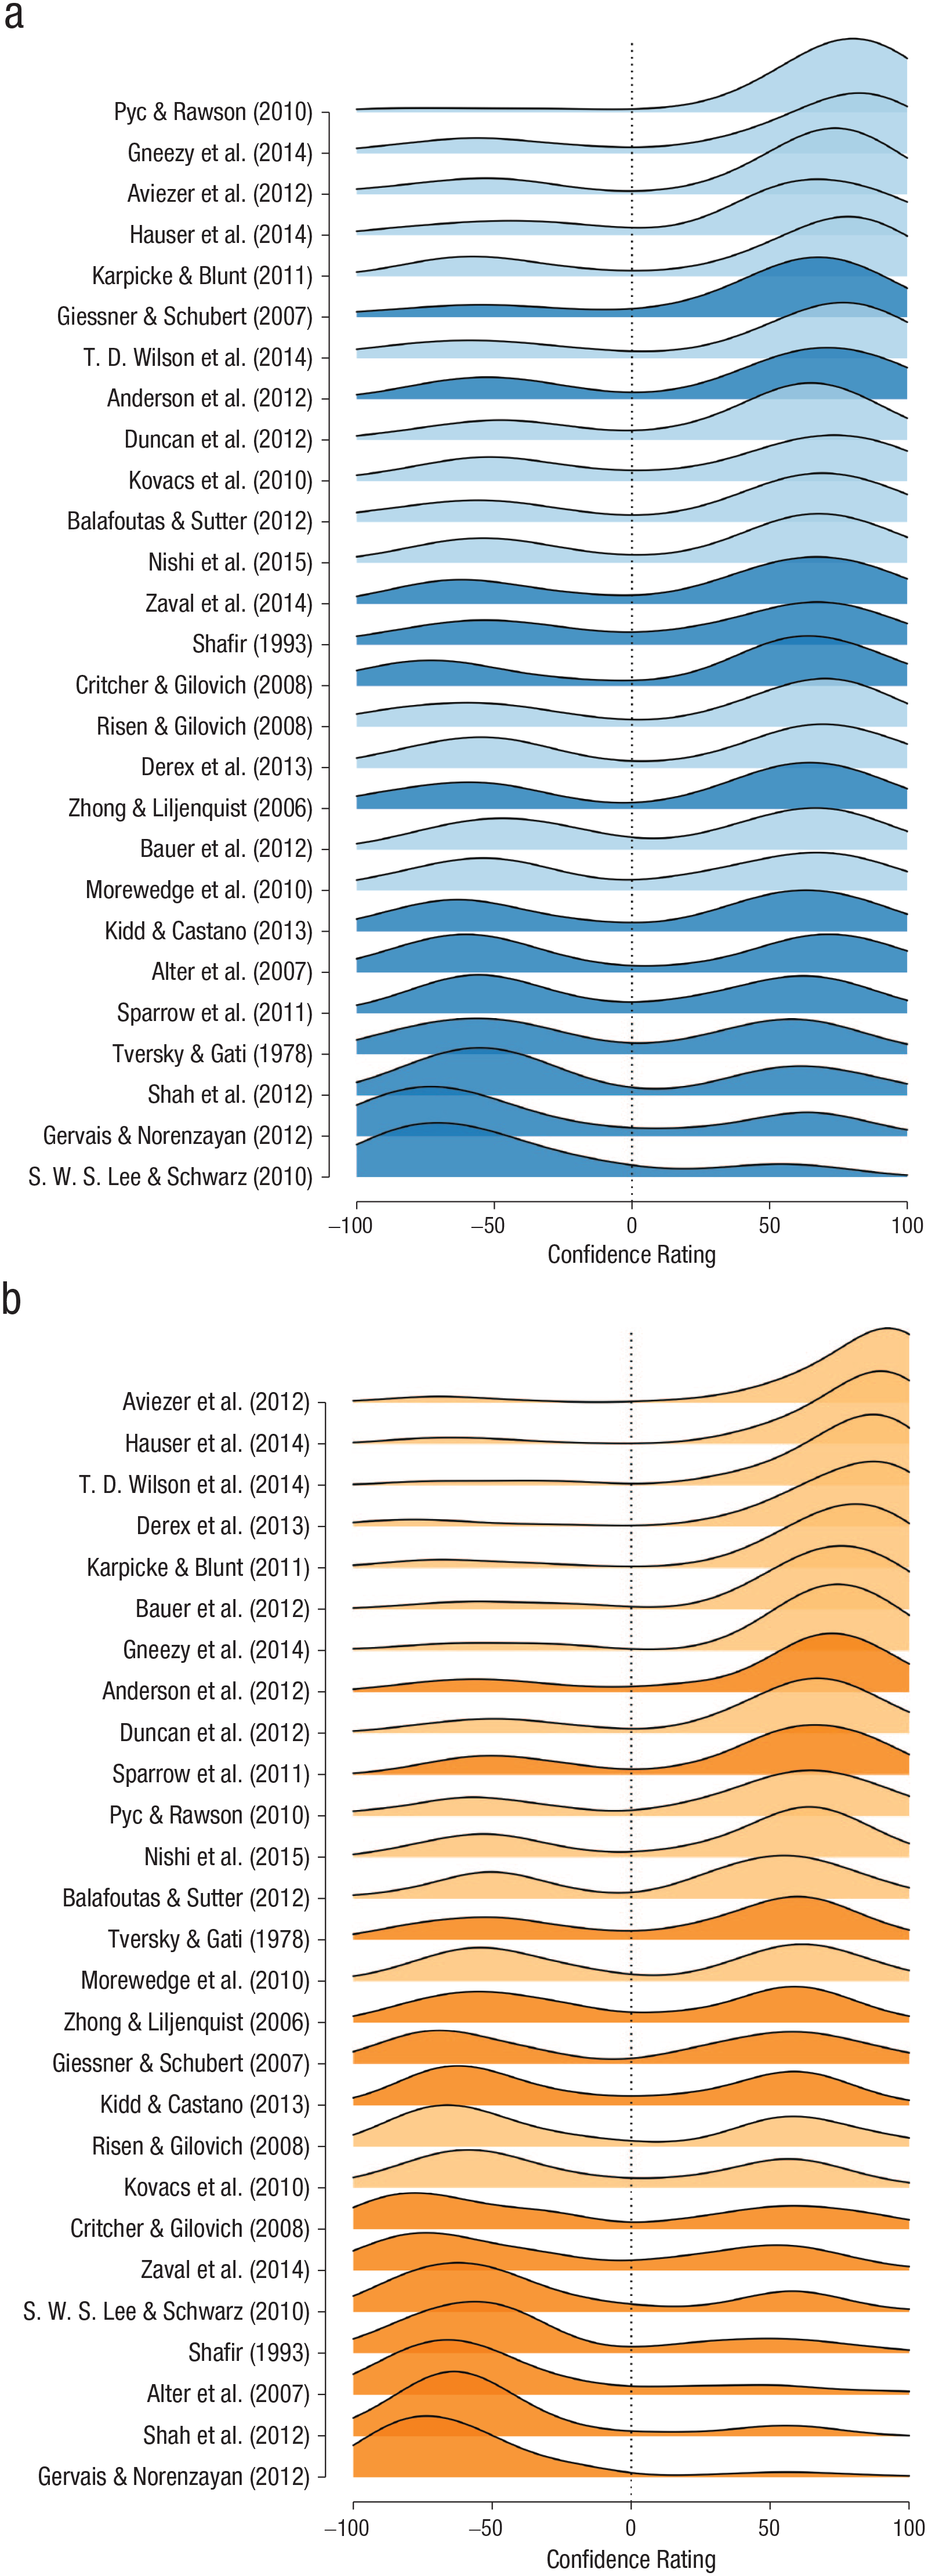
Distribution of participants’ confidence ratings for each of the 27 studies, separately for (a) the description-only condition and (b) the description-plus-evidence condition. The studies are ordered according to their average confidence ratings. Light shading indicates that a study was successfully replicated, and dark shading indicates that a study was not successfully replicated. Negative values indicate a prediction of replication failure, and positive values indicate a prediction of replication success.
Figure 3 provides a more detailed account of the data for three selected studies. Most participants correctly predicted that the effect found in the study in the top panel (i.e., Gneezy, Keenan, & Gneezy, 2014) would be successfully replicated. For the study in the middle panel (i.e., Tversky & Gati, 1978), participants showed considerable disagreement; slightly more than half incorrectly predicted that the study would be replicated successfully. Finally, most participants correctly predicted that the effect found in the study in the bottom panel (i.e., Shah, Mullainathan, & Shafir, 2012) would fail to be replicated.
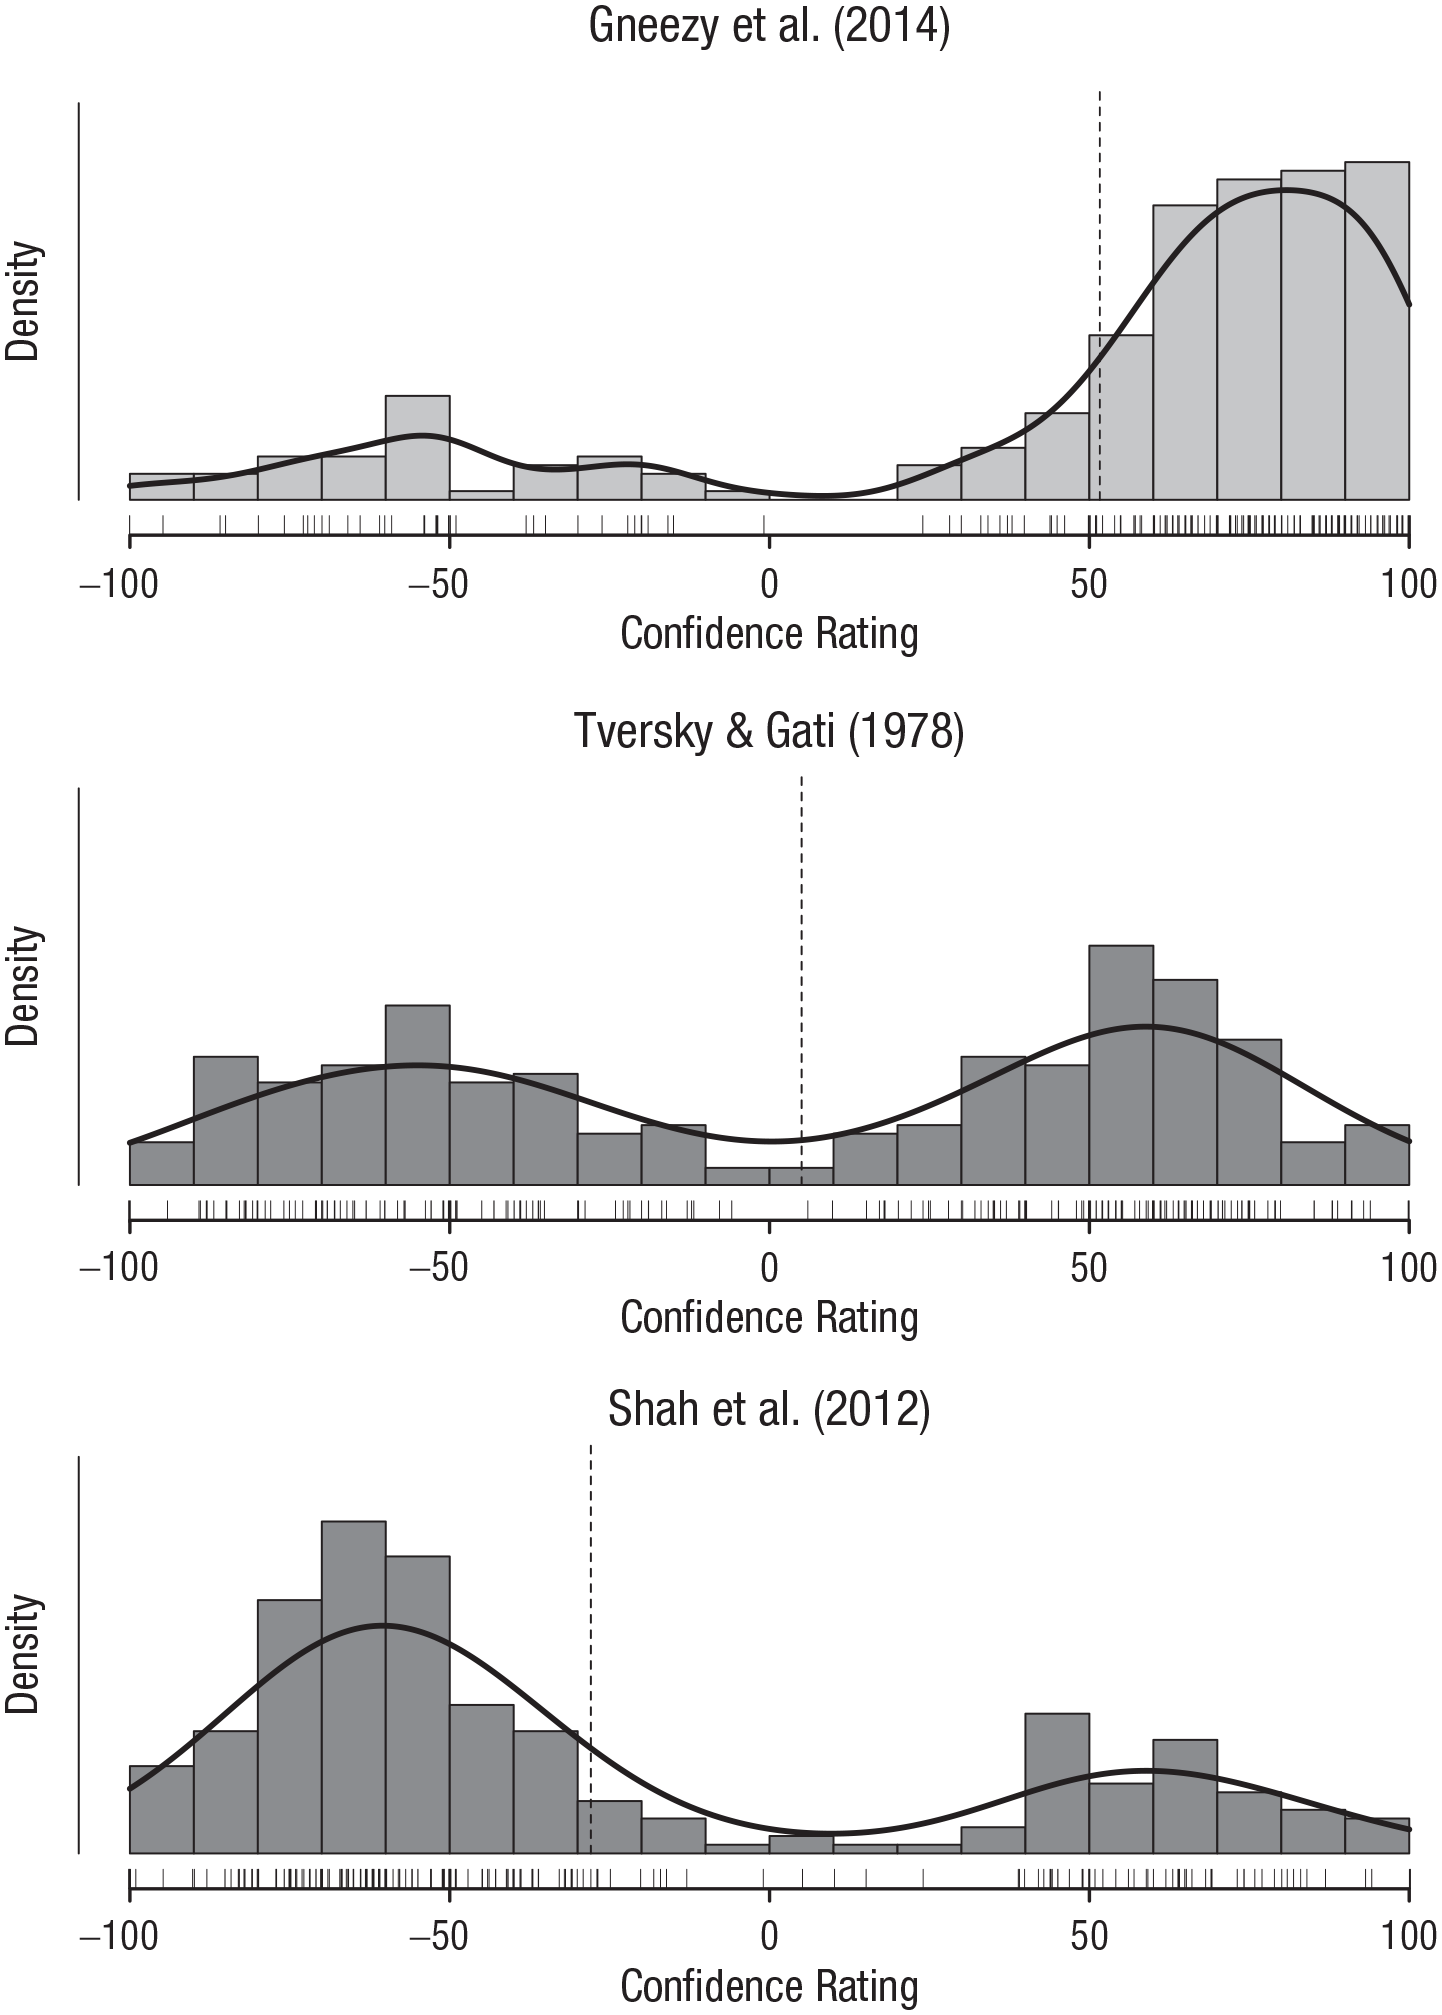
Histograms (and rug plots) of confidence ratings for three selected studies, one for which participants were nearly unanimous in their belief that the study would be replicated successfully (top panel), one for which there was considerable disagreement (middle panel), and one for which participants were nearly unanimous in their belief that the study would not be replicated successfully (bottom panel). Negative values indicate a prediction of replication failure, and positive values indicate a prediction of replication success. The vertical dashed lines show the average confidence ratings for the studies (i.e., group prediction).
Before conducting our preregistered confirmatory analyses, we conducted an exploratory analysis investigating the relation between the Bayes factors of the original studies and the effect sizes of the replication studies. To a large extent, our study was based on the assumption that the Bayes factors of the original studies carry relevant information about replicability. To verify this claim, we computed a Spearman correlation coefficient between the log-transformed Bayes factors of the original studies and the standardized effect sizes of the replication studies expressed as Pearson correlation coefficients. The data provided overwhelming evidence in favor of a positive correlation (BF+0 = 162). 5 The median value of ρ was .62, 95% credible interval (CI) = [.33, .78]. Thus, the Bayes factors of the original studies indeed conveyed useful information (see Fig. 4).
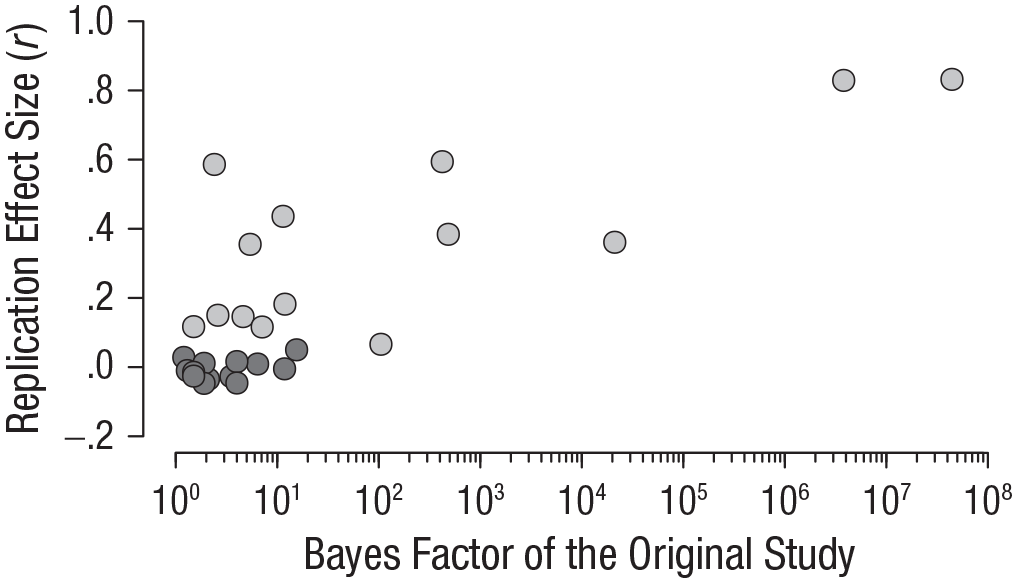
Association between the evidence of the original studies (quantified by Bayes factors) and the effect sizes of the replication studies. Studies that were successfully replicated are indicated by light-gray shading, and studies that were not successfully replicated are indicated by dark-gray shading.
Preregistered analyses
Quality check
Following our preregistered plan, we implemented a quality check on the data, which served as a prerequisite for our confirmatory analyses. We had decided to consider the data inappropriate for subsequent analyses if the data provided strong evidence for the hypothesis that overall laypeople perform worse than chance level when predicting the replicability of empirical studies. An accuracy rate worse than chance level (i.e., less than 50%) would indicate that participants did not understand or follow the instructions correctly or misinterpreted the presented information (i.e., the description of the study and the Bayes factor). We tested the restricted hypothesis Hr1 that the overall accuracy of laypeople is below 50%, that is, Hr1: ω < .5, where ω is the mode of the Beta distribution for the group-level accuracy rate. This hypothesis was tested against the encompassing hypothesis He, which lets ω vary freely, that is, He: ω ~ Beta(1,1). The Bayes factor in favor for the encompassing hypothesis, BFer1, was computed using the encompassing-prior approach (Klugkist, Kato, & Hoijtink, 2005). The evidence for the encompassing hypothesis was estimated to approach infinity, which means that the data passed the quality check. 6
Difference in prediction performance between conditions
In our preregistered confirmatory analyses, we first investigated whether there was a difference between the two study conditions. Specifically, we evaluated whether or not the inclusion of the Bayes factor for the original effect increased prediction performance as measured by individual Brier scores (Brier, 1950). The Brier score takes into account both the accuracy and the indicated certainty (or uncertainty) of the prediction; highly certain correct predictions are rewarded, and highly certain incorrect predictions are punished, relative to uncertain predictions. Individual Brier scores were log-transformed to account for skewness in the distribution of Brier scores.
We conducted a Bayesian independent-samples t test with the log Brier score as the dependent variable and the condition assignment as the grouping variable. The hypothesis of interest was that the Brier scores of participants in the description-plus-evidence condition would be lower than the Brier scores of participants in the description-only condition, as lower scores indicate better prediction performance. This one-sided default alternative hypothesis was specified as the effect size, δ, for the difference being smaller than zero, that is, H−: δ < 0. The hypothesis was tested against the null hypothesis, H0, that the effect size is exactly zero, that is, H0: δ = 0. The results revealed overwhelming evidence that participants in the description-plus-evidence condition outperformed those in the description-only condition, BF−0 = 1.0 × 10¹⁰. The median of the effect size distribution was −0.96, 95% CI = [−1.23,−0.68] (see Fig. 5 for a boxplot of the data, as well as the prior and posterior distributions of δ).
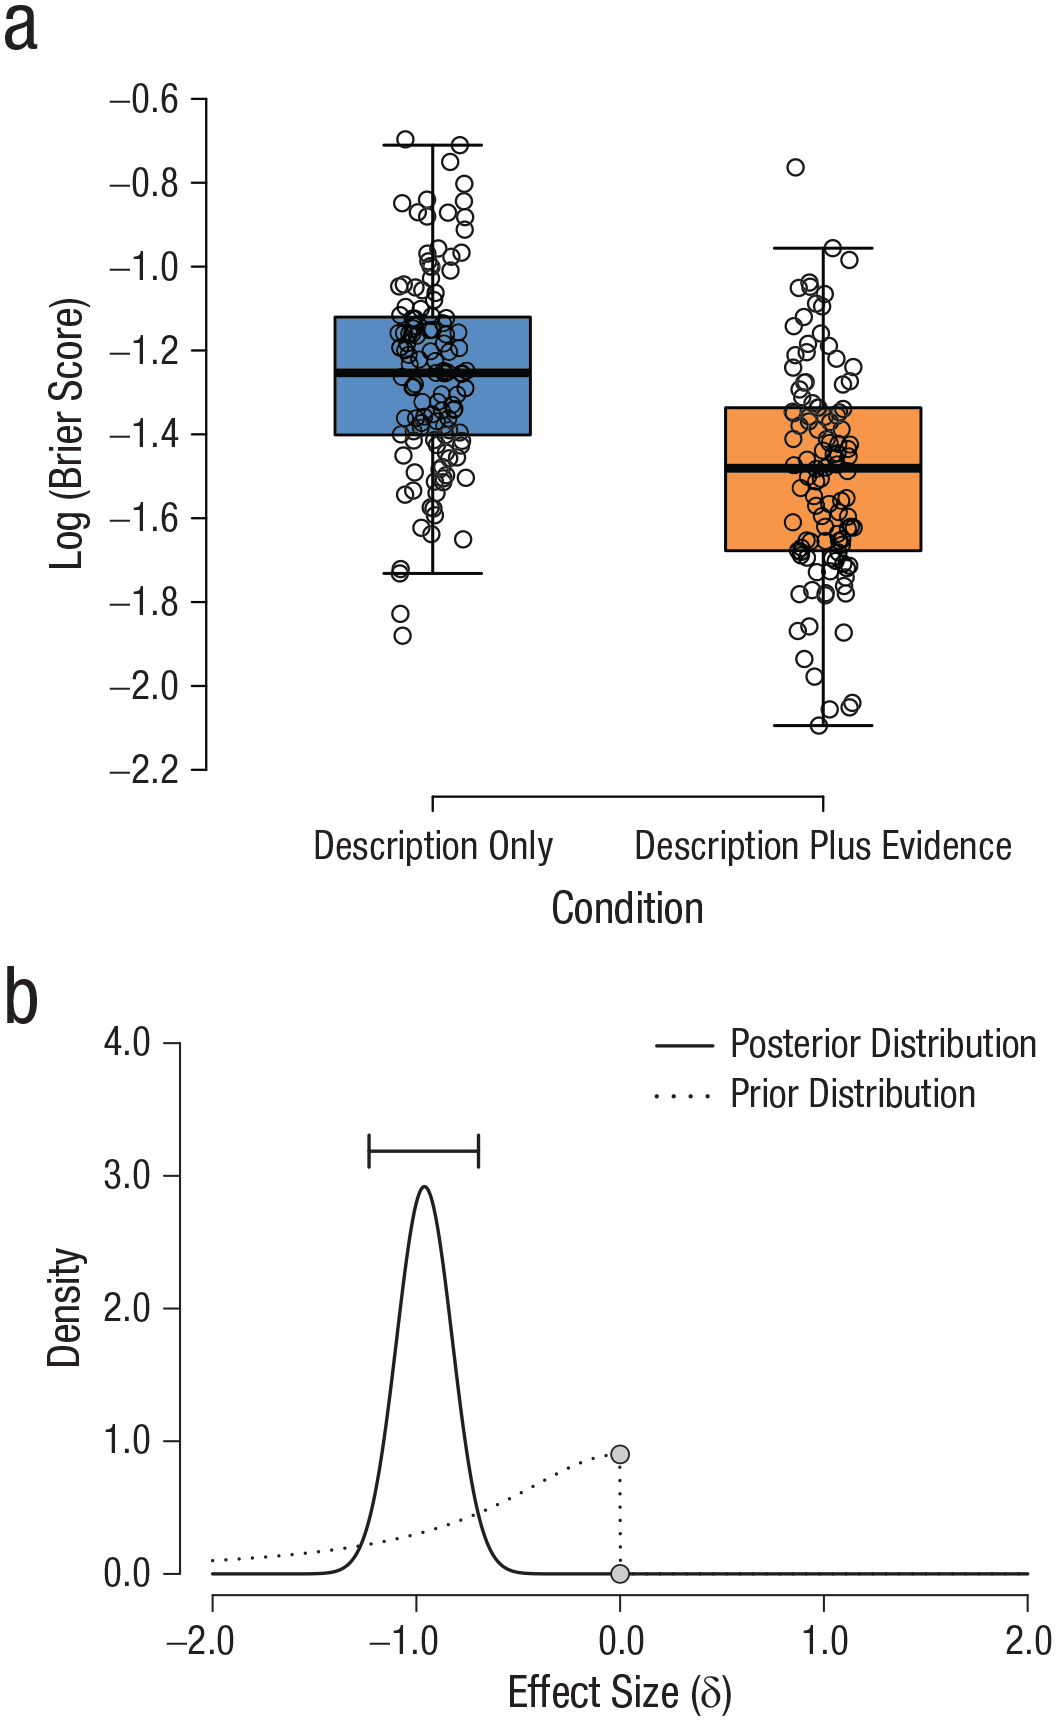
Analysis of the difference in performance between conditions. In (a), individual log-transformed Brier scores are plotted separately for the description-only and description-plus-evidence conditions. The shaded boxes indicate the interquartile ranges (IQRs), the thick horizontal lines indicate the median values, and the whiskers indicate the minima and maxima not exceeding 1.5 * IQR. Individual jittered data points are displayed in the graph. The graph in (b) shows the prior and posterior distributions of the effect size (δ). The horizontal bar indicates the 95% credible interval of the posterior distribution.
Group accuracy in each condition
To investigate whether laypeople can adequately predict replication outcomes, we tested whether the group-level accuracy rates 7 were above chance level, that is, higher than 50%. We considered only the accuracy of predictions regardless of participants’ confidence. We applied a Bayesian hierarchical model to analyze the accuracy data. For each condition separately, we then tested the restricted hypotheses that the accuracy rate, ω (i.e., the mode of the group-level distribution), was above chance in the description-only condition (Hr2), and in the description-plus-evidence condition (Hr3): Hr2,Hr3: ω > .5. The hypotheses Hr2 and Hr3 were tested against the null hypothesis stating that ω is exactly equal to .5, which would indicate chance-level performance: H0: ω = .5.
The data provide extreme support for the restricted hypothesis that participants in the description-only condition performed better than chance, BFr20 = 4.4 × 10⁷. The median value for ω was .59, 95% CI = [.57, .60], which implies a 59% accuracy rate for participants in the description-only condition at the group level. The data also provide extreme support for the restricted hypothesis that participants in the description-plus-evidence condition performed above chance level, BFr30 = 5.6 × 10²². The median value of ω was .67, 95% CI = [.65, .69], which implies a 67% accuracy rate for participants in the description-plus-evidence condition at the group level. The nonoverlapping credible intervals of the two conditions corroborate the results from the independent-samples t test on the Brier scores; accuracy was higher in the description-plus-evidence condition than in the description-only condition. The distributions of the accuracy rates in both conditions are displayed in Figure 6.
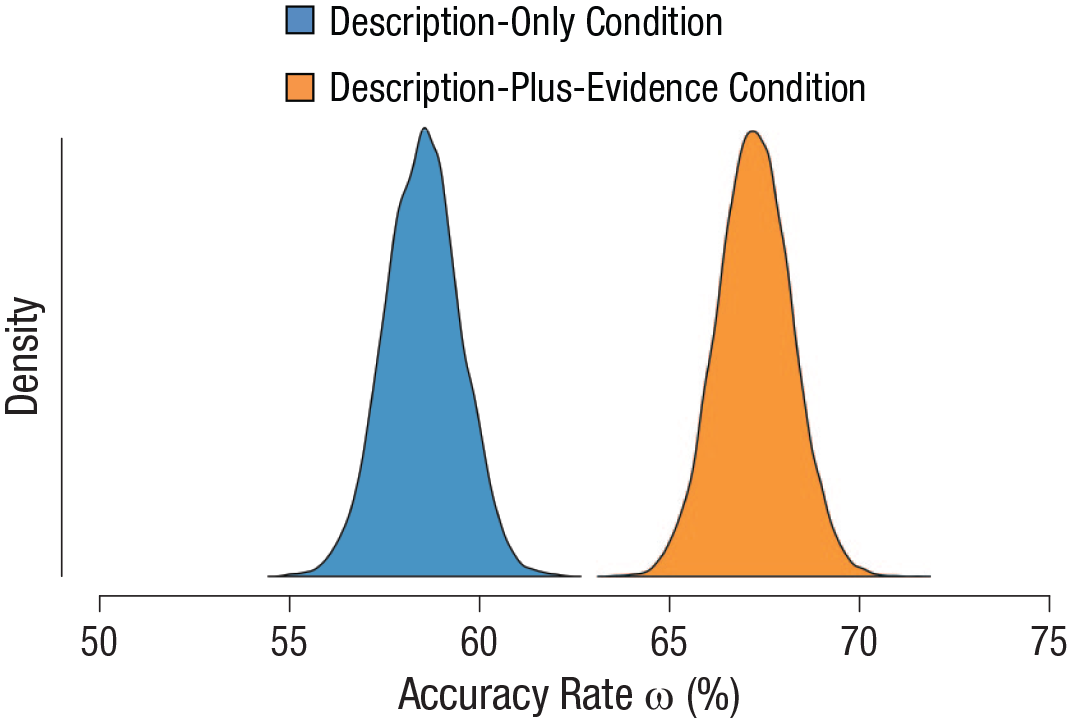
Posterior distributions of the group-level accuracy rates of participants in both conditions.
Correlation between laypeople’s confidence and replication effect size
In addition to analyzing participants’ binary predictions of replicability, we assessed whether the confidence with which they made their decisions was indicative of the size of the effect observed in the replication studies (cf. Camerer et al., 2018). In other words, we tested whether participants were more certain about their decisions if the replication effect size was large, and became less certain (i.e., more certain about nonreplicability) as the underlying replication effect size approached zero. The replication effect sizes were retrieved from Camerer et al. (2018) and Klein et al. (2018). The data are plotted in Figure 7, separately for each condition.
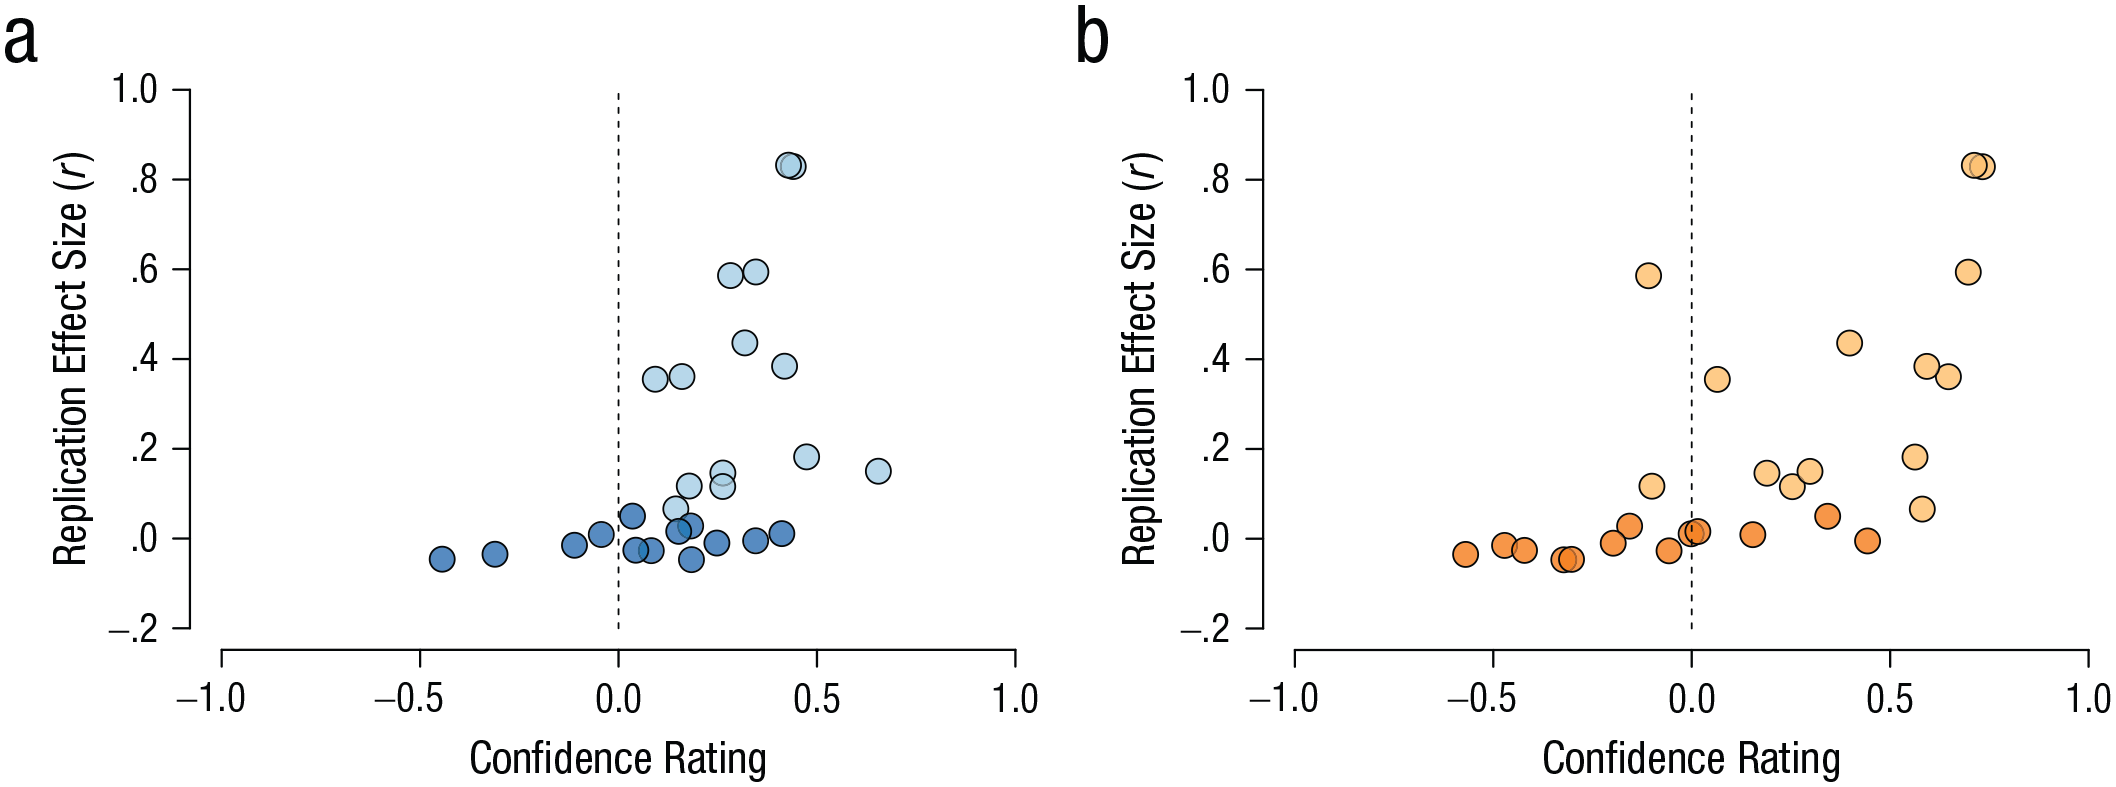
Relationship between the average confidence rating in each study and the size of the effect observed in the corresponding replication study. Results are shown separately for (a) the description-only condition and (b) the description-plus-evidence condition. The dashed lines represent the cutoff between confidence in successful replication (i.e., positive confidence ratings) and confidence in failed replication (i.e., negative confidence ratings). Light shading indicates that the study’s effect was successfully replicated, and dark shading indicates that the study’s effect was not successfully replicated.
We used a Bayesian Spearman correlation (van Doorn, Ly, Marsman, & Wagenmakers, 2017) to test the null hypothesis (i.e., H0: ρ = 0) against the one-sided restricted hypotheses that the correlation was positive in both the description-only condition (i.e., Hr4: ρ > 0) and the description-plus-evidence condition (i.e., Hr5: ρ > 0). The data provide extreme evidence for both restricted hypotheses, BFr40 = 523 and BFr50 = 14,295. For the description-only condition, the median Spearman correlation coefficient was .61, 95% CI = [.34, .77]. For the description-plus-evidence condition, the median coefficient was .77, 95% CI = [.57, .87]. Note that for studies that failed to be replicated successfully, the effect sizes—by definition—clustered around zero. Although the Spearman correlation coefficient is a rank-based measure, the correlation should still be interpreted with caution.
Exploratory analyses
Disentangling discriminability and response bias
According to signal detection theory (SDT; Green & Swets, 1966; Tanner & Swets, 1954), binary decisions are driven by two main components: the ability to distinguish between the response options (discriminability) and the a priori tendency to prefer one option over the other (response bias). In an exploratory analysis, we applied SDT to decompose participants’ predictions into discriminability and bias. Here, discriminability relates to the degree to which replicable and unreplicable studies were distinguishable, which was influenced by characteristics of the stimuli (i.e., information provided about the studies) and by participants’ underlying ability (i.e., individual prediction skills). Bias reflects participants’ overall tendency toward either predicting that a given study would be replicated successfully or predicting that it would not be replicated successfully, regardless of the information about the study. These parameters were estimated by applying a Bayesian hierarchical equal-variance Gaussian SDT model (Lee & Wagenmakers, 2013, p. 164).
Figure 8 shows the group-level posterior distributions of the discriminability and bias parameters, separately for the two conditions. Larger values for discriminability indicate greater ability to distinguish replicable from unreplicable findings. Results are consistent with the Brier-score analysis reported earlier, as the discriminability parameter clearly differed between conditions; people in the description-plus-evidence condition were better at separating replicable studies from unreplicable studies than were people in the description-only condition. The enhanced discriminability for the description-plus-evidence condition is also illustrated in Figure 9a, which shows that the separation between the distributions for replicable and unreplicable studies was larger for the description-plus-evidence condition than for the description-only condition. For the bias parameter, the difference between conditions was less pronounced; the negative values for bias (Fig. 8) indicate that all the laypeople in our sample tended to overestimate replicability (i.e., they displayed a bias toward saying that the study would be replicated successfully). This bias is also depicted in Figure 9a, in which for both conditions, the adopted criterion is located to the left of the optimal criterion.
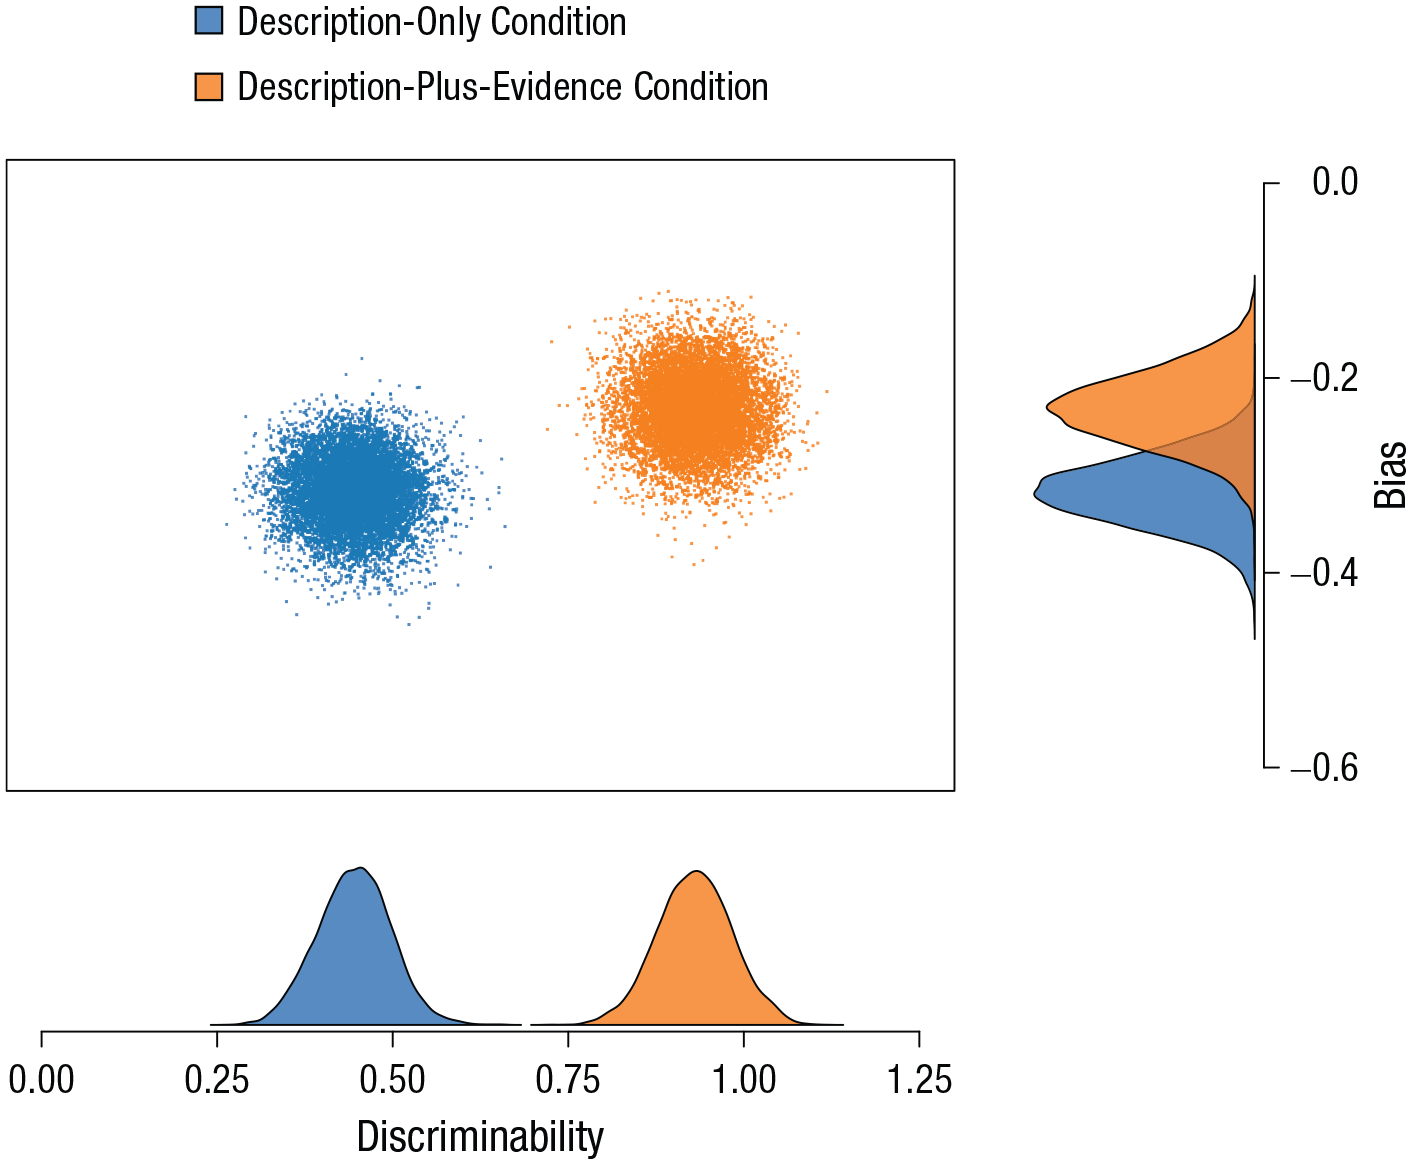
Posterior distributions of the bias and discriminability parameters in the description-plus-evidence condition and the description-only condition. Negative values for bias indicate a tendency to overestimate replicability, and larger values for discriminability indicate greater ability to distinguish replicable from unreplicable findings.
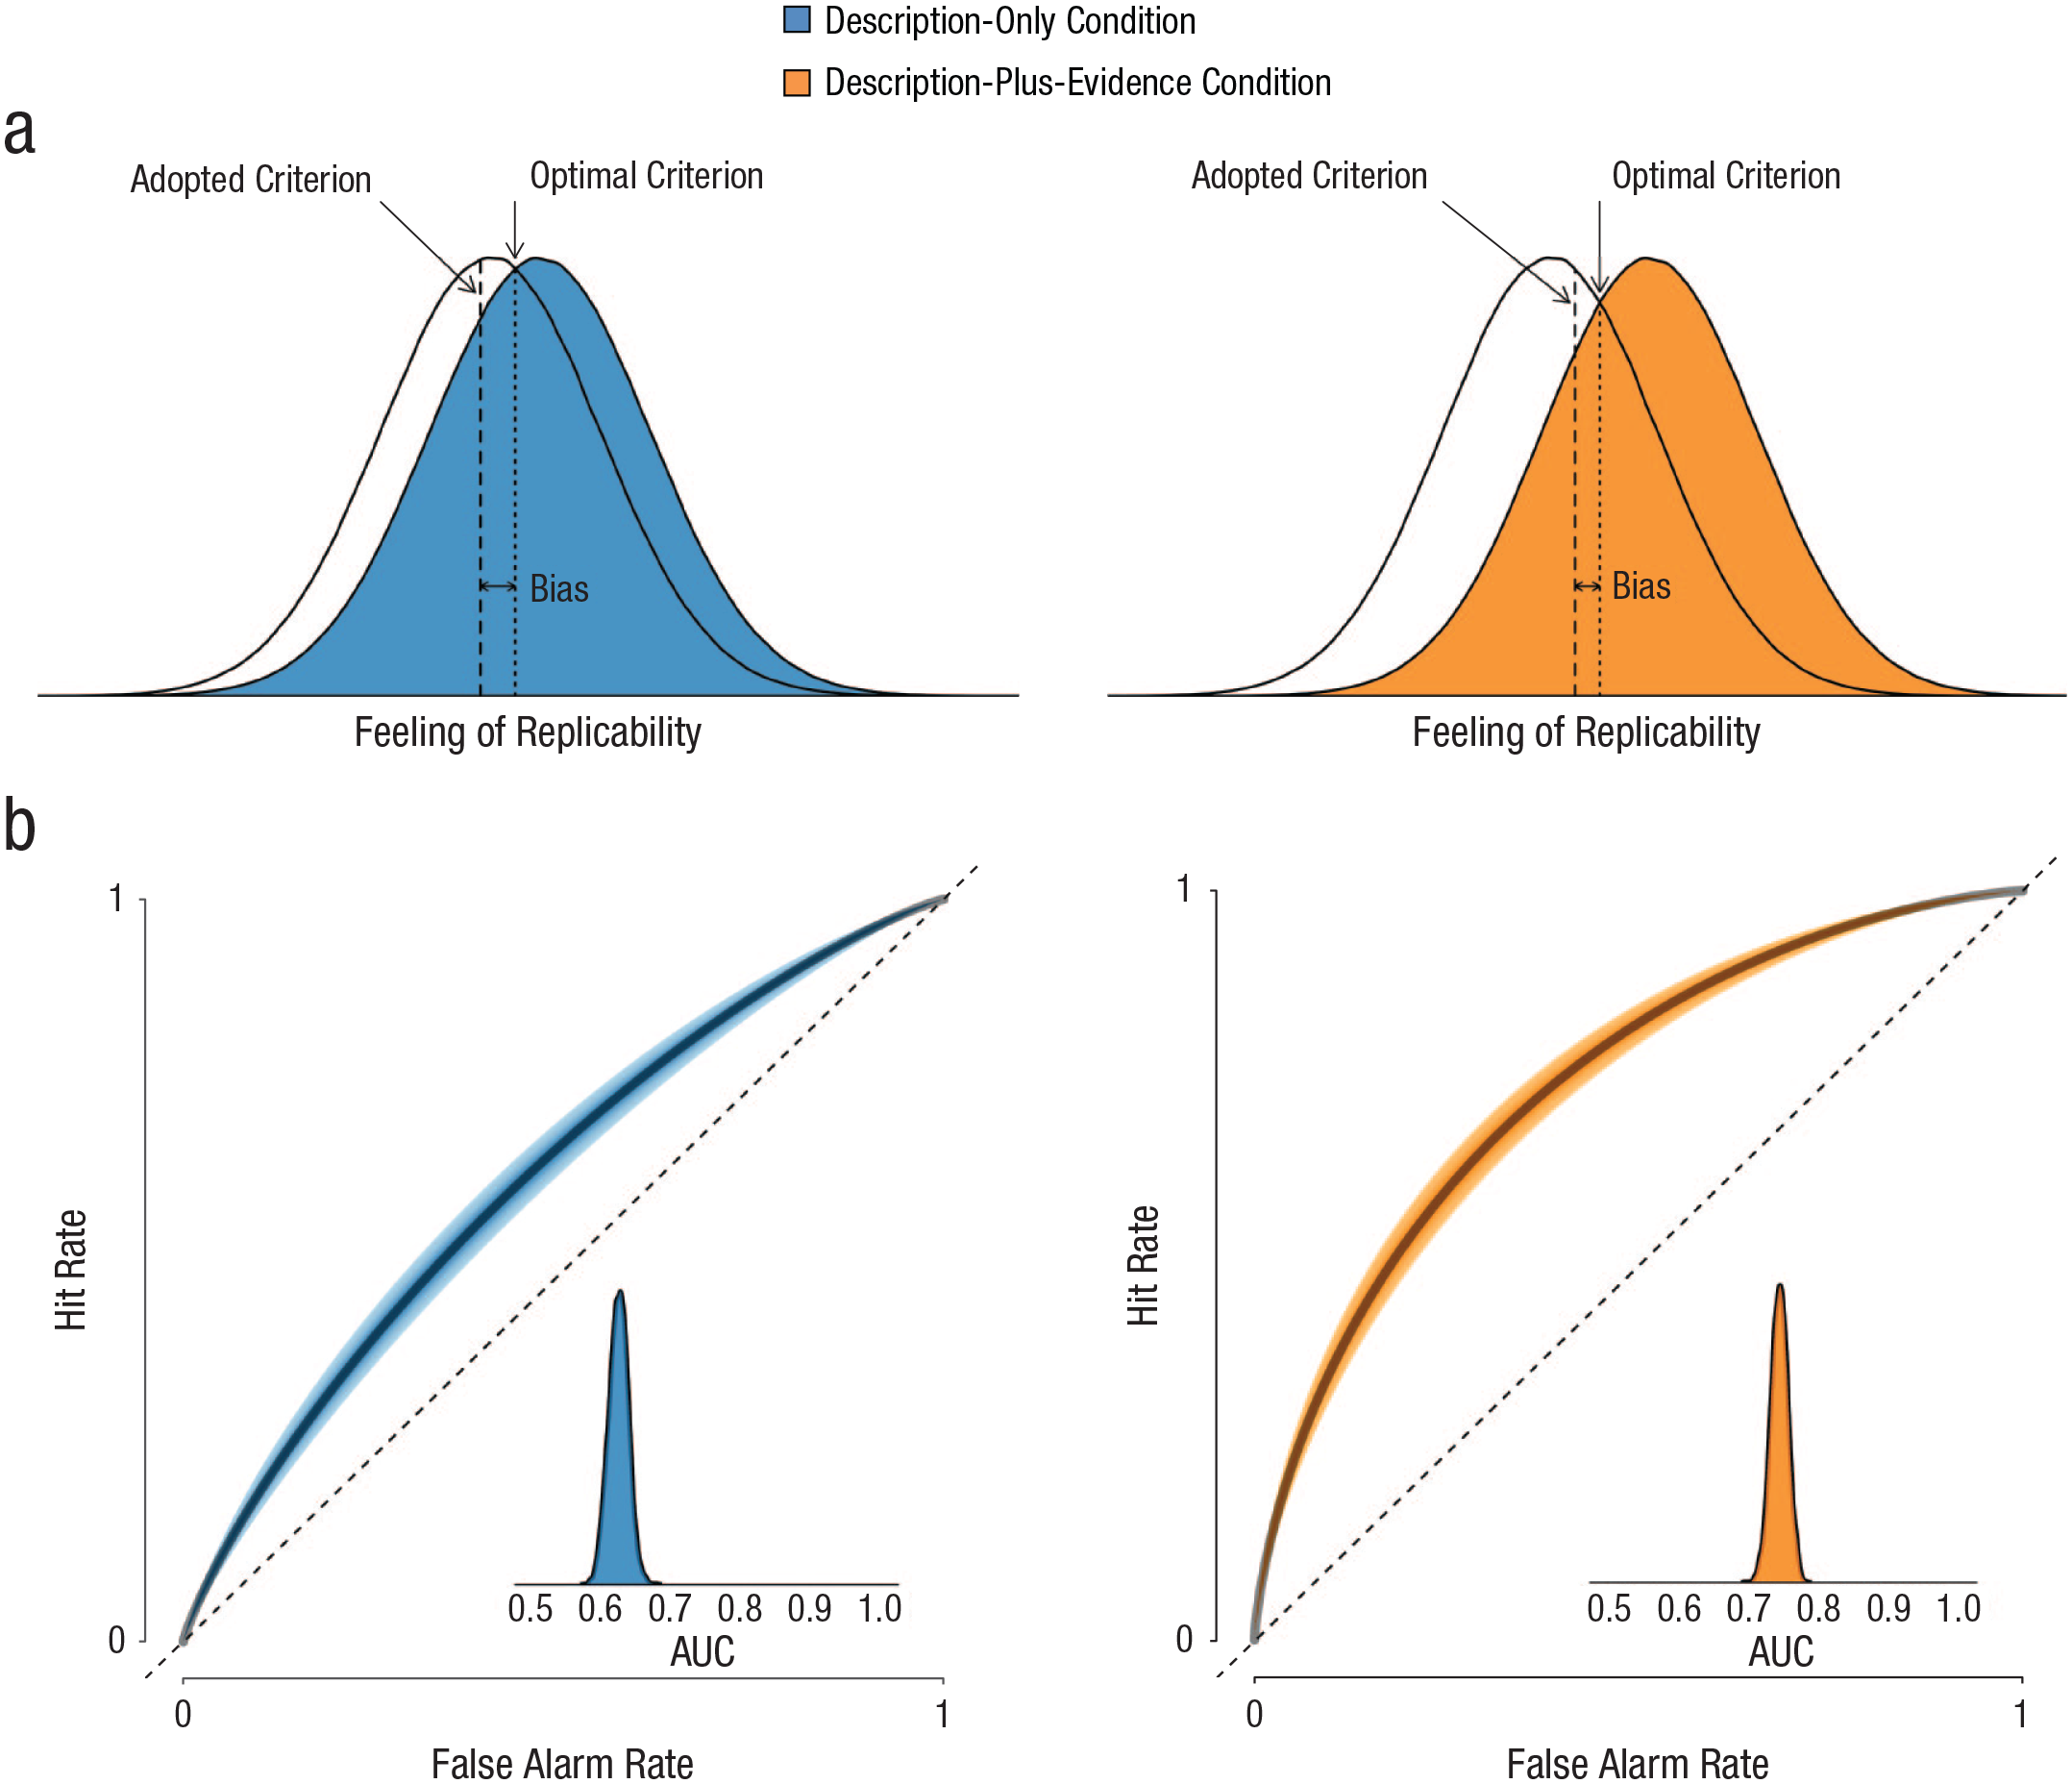
Results from the signal detection theory analyses. The graphs in (a) show the noise distributions (white) and signal distributions (colored) for the description-plus-evidence condition (right) and the description-only condition (left). The dashed lines indicate the criteria adopted by the participants and the optimal criteria. The graphs in (b) show hit rate as a function of false alarm rate (i.e., the receiver-operating characteristic curve) in the description-plus-evidence condition (right) and the description-only condition (left). The shaded bands depict the 95% credible intervals, and the dashed lines indicate chance-level performance. The insets show the posterior distributions of the area under the curve (AUC). This figure is based on Figure 9 in Selker, van den Bergh, Criss, and Wagenmakers (2019).
The receiver-operating characteristic (ROC) curve is often used to interpret the parameter values of SDT. This curve reflects the proportion of hits (in this case, studies that were deemed replicable and were replicated successfully) and false alarms (studies that were deemed replicable but were not replicated successfully) across all possible levels of bias, given the estimated discriminability. The further the curve moves away from the diagonal (i.e., chance level), the better the classification performance. The derived area under the curve (AUC) metric is used to quantify the information captured by the ROC curve; it reflects the probability that a given stimulus (in this case, study) is correctly classified (as replicable or unreplicable). We created ROC curves for participants’ prediction performance in both conditions as derived from the estimated discriminability (disregarding the estimated bias). The ROC curves in Figure 9b show that the ratio of hits to false alarms was better for people in the description-plus-evidence condition compared with people in the description-only condition. This difference is also quantified by the associated AUC metric; its median value was 0.62, 95% CI = [0.60, 0.65] for the description-only condition and 0.74, 95% CI = [0.72, 0.77] for the description-plus-evidence condition.
Taken together, the results of the SDT model indicate that access to the statistical evidence predominantly affected discriminability rather than bias. This suggests that the evidence (i.e., the Bayes factors) provided information that enhanced participants’ ability to correctly distinguish between replicable and unreplicable studies, rather than making them simply more skeptical across the board. Note that we did not conduct any statistical tests, but solely estimated the discriminability and bias parameters for each condition, as well as the associated AUC metrics.
Estimating the prediction accuracy of experts
In a second exploratory analysis, we applied a Bayesian hierarchical model to generate the posterior distributions of the accuracy rates for the experts’ predictions that were obtained by Camerer et al. (2018) and Forsell et al. (2018) in the SSRP and ML2 project, respectively. Experts in the SSRP showed the higher accuracy rate; they were able to correctly predict the replicability of almost three quarters of the studies, achieving an accuracy rate of .72, 95% CI = [.69, .74]. The median accuracy rate of the experts in the ML2 project was .65, 95% CI = [.62, .68]. Both these experts’ distributions and the distributions for the nonexperts in our study (expressed as percentages) are presented in Figure 10. The figure suggests that the prediction accuracy of laypeople provided with a description of the original study and a Bayes factor for the evidence obtained can be at least as good as, if not better than, the prediction accuracy of the experts who anticipated the outcomes of the ML2 project (and who were also provided with statistics from the original studies).
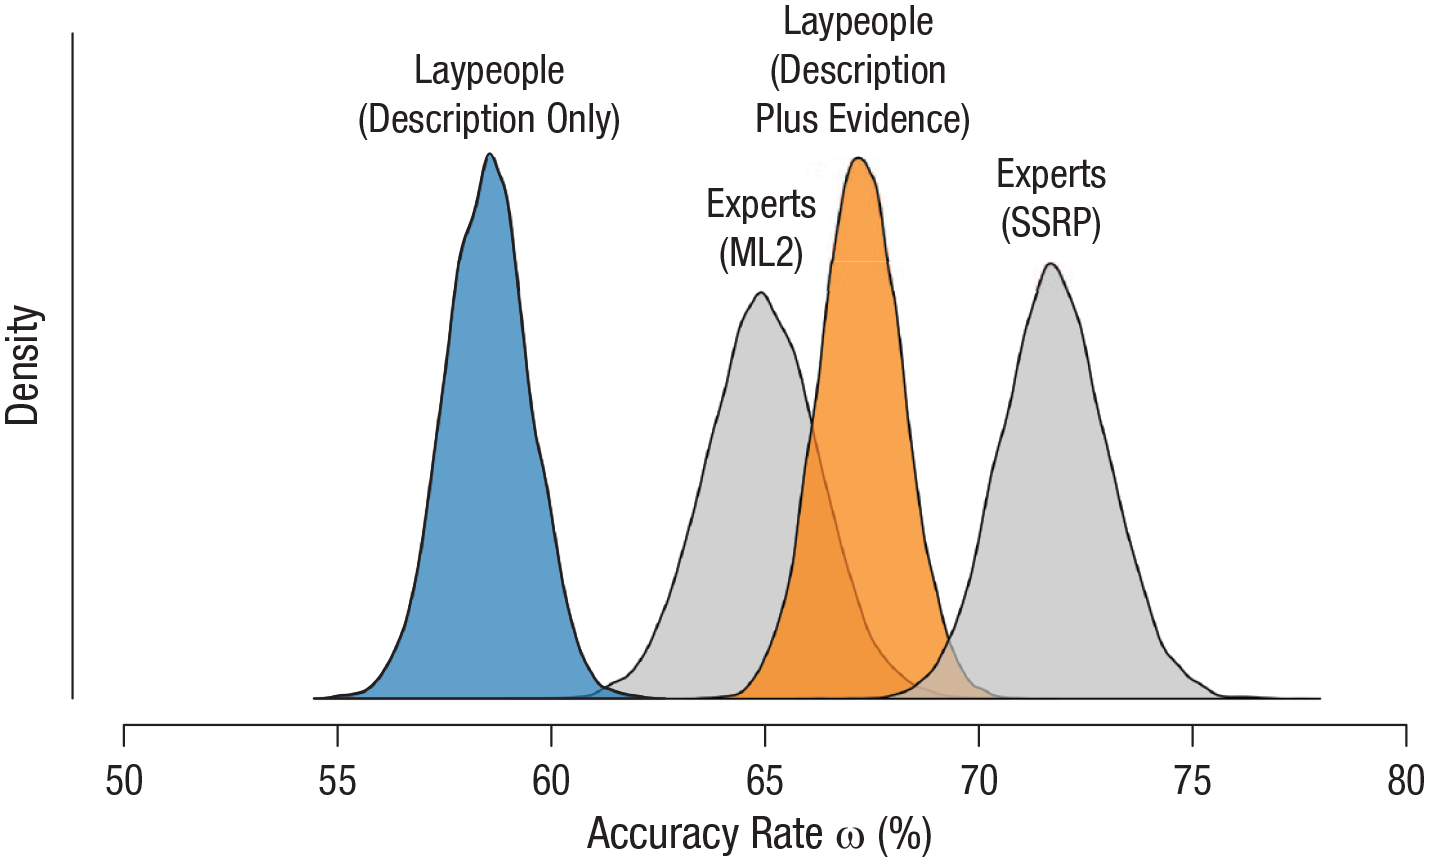
Comparison of the accuracy of laypeople and experts in predicting replication success. The graph shows the posterior distributions of the group-level accuracy rates for participants in our description-only and description-plus-evidence conditions and for experts in the Many Labs 2 (ML2) project and in the Social Sciences Replication Project (SSRP).
It is important to note, however, that the performance of these experts and of the laypeople in our study may not be completely comparable, as the studies included in our stimuli only partly overlapped with the SSRP and ML2 sets (participants in the our study rated 17 studies from the SSRP and 10 from ML2). Of the 17 studies we drew from the SSRP, 12 were replicated successfully, whereas of the 10 studies we drew from ML2, only 2 were replicated successfully. Because of these unintentionally unequal proportions, which are also not representative of the respective projects, we estimated the accuracy rate for the full set of studies rated by the experts in each project, rather than only the subset that we presented to our lay participants.
Discussion
This study showed that laypeople without a professional background in the social sciences are able to predict the replicability of social-science studies with above-chance accuracy, even when provided solely with descriptions of the studies. Because the predictions in the description-only condition were generated by nonexperts on the basis of nothing more than simple verbal study descriptions, we take these predictions to reflect intuitions of plausibility. Thus, our results suggest that intuitions about the plausibility of targeted effects carry information about the likelihood of successful replication outcomes. Prediction accuracy further increased with access to the statistical evidence (i.e., the Bayes factors) obtained in the original studies. In addition, participants’ confidence in their replicability judgments was associated with the effect sizes obtained in replication studies. This may indicate that participants were able to derive a sense of the magnitude of the targeted effects from the descriptions. Inclusion of information on the original evidence amplified the relation between confidence ratings and replication effect sizes.
The notion that the intuitive plausibility of scientific effects may be indicative of their replicability is not novel (or counterintuitive). The previous results of the Replication Project: Psychology (Open Science Collaboration, 2015), for instance, already suggested that nonsurprising studies are more replicable than highly surprising ones. B. M. Wilson and Wixted (2018) built on the data from that replication project and found that lower prior odds for the crucial effects explained the difference between replicability rates in social and cognitive psychology; social-psychological studies contained more risky but potentially groundbreaking effects compared with cognitive-psychological studies. The authors suggested that the key factor influencing prior odds of an effect is “established knowledge, acquired either from scientific research or from common experience (e.g., going without sleep makes a person tired)” (B. M. Wilson & Wixted, 2018, p. 191). By asking laypeople about their intuitions regarding the replicability of social-science studies, we sought to shed light on these prior odds of effects derived from common sense, which we call “intuitive plausibility.” Although we did not assess the plausibility of the studies directly, we believe that laypeople’s intuitions regarding the studies’ replicability can serve as a close approximation. Our results provide empirical support for the suggestion that intuitive (i.e., nonsurprising) effects are more replicable than highly surprising ones, as replicable studies were in fact deemed more replicable than nonreplicable studies by a naive group of laypeople.
In principle, we expect our results to generalize to most people, provided that the instructions, explanation of replicability, and study descriptions are written in plain language, avoiding technical terms. It is possible that prediction accuracy may rise with increased expertise; for instance, graduate students may, on average, outperform people without any expertise in social sciences. However, previous prediction studies showed that weighting experts’ predictions according to their self-reported topical expertise did not improve their average prediction accuracy, which suggests that at least knowledge about a particular study’s topic may be irrelevant (Dreber et al., 2015; Forsell et al., 2018).
An obvious limitation on the generality of our results is that if predictions are solicited from laypeople, this narrows the pool of studies that are suited for inclusion; complex psychophysics experiments or functional MRI studies may not be comprehensible for laypeople and may be better evaluated by experts. However, for the majority of studies in social science (e.g., psychology and economics), targeting laypeople rather than experts may be advantageous in terms of availability, accessibility, and the possibility of including previously published studies (the results of which experts may already be familiar with or may simply look up). A further prerequisite is that the evaluated replication studies should be of high quality (e.g., preregistered, high-powered studies featuring manipulation checks) to ensure that the replication outcomes are reliable and can thus serve as a reliable criterion against which to compare participants’ predictions. We have no reason to believe that our results depend on other characteristics of the participants, materials, or context.
A final side note on the generalizability of our findings concerns the wider implications and scope of the results. Although participants in our study strongly overestimated overall replicability, they still believed that approximately 20% of the studies would not be replicated successfully. This does not necessarily imply, however, that they will distrust the results of 1 in 5 studies they encounter in the media.
The presentation of Bayes factors in the description-plus-evidence condition could be interpreted as a demand characteristic; these quantitative markers and their verbal labels may have steered participants’ judgments toward the correct conclusions. It may be practically and theoretically difficult to distinguish between demand characteristics and information given to participants in our paradigm. We do not deny that participants may have developed strategies to derive their predictions directly from the value of the Bayes factors. In fact, we assume that they did so. Although one may argue that this setup creates a confound, one can also view it as a demonstration of the benefits of Bayes factors: They constitute a simple metric that can effectively convey information about a study’s evidential value. This is not a direct argument for Bayes factors over frequentist p values or effect sizes per se; in fact, we expect that the inclusion of frequentist statistics may similarly enhance laypeople’s prediction performance.
We acknowledge that replication outcomes cannot be equated with the truth. Although the SSRP (Camerer et al., 2018) and Many Labs 2 (Klein et al., 2018) were high-powered projects and followed detailed preregistration protocols, the replication outcomes are not definitive or irrefutable. Moreover, there currently exists no consensus on which decision rule is superior for determining replication success (Cumming, 2008; Open Science Collaboration, 2015; Simonsohn, 2015; Verhagen & Wagenmakers, 2014). We categorized studies as successfully replicated and not successfully replicated following the SSRP’s and ML2’s primary replication criteria, which were based on whether the replication study found a significant effect in the same direction as the original study. However, it should be noted that Klein et al. (2018) and Camerer et al. (2018) reported that applying additional indicators in evaluating replicability resulted in slightly different categorizations of replication success. The replication outcomes should thus be regarded not as reflective of the absolute truth, but rather as reflective of the current, tentative state of knowledge.
Along the same lines, laypeople’s predictions should also not be equated with the truth. Although clearly above chance level, the prediction accuracy rates of 59% and 67% in the description-only and the description-plus-evidence conditions, respectively, are far from perfect. One reason for this moderate prediction success may be participants’ tendency to overestimate the replicability of empirical findings; in the context of the bleak reality of the current replication rate in psychological science, laypeople are optimists. This pattern is evident in Figure 1 and is corroborated by the signal detection analysis indicating that our participants had a bias toward saying that a given study would be replicated successfully. Notably, the optimistic perspective does not seem to be unique to laypeople; experts similarly overestimated replicability in investigations by Dreber et al. (2015), Camerer et al. (2016), and Forsell et al. (2018), though not the one by Camerer et al. (2018). This biased responding may allow for boosting prediction accuracy; the AUC metric in our project indicates that if laypeople adopted the optimal unbiased criterion, that is, if they were more conservative, then their accuracy might be enhanced to 62% for predictions based on verbal descriptions only and 74% for predictions based on descriptions plus evidence from the original study. This suggestion is speculative, but it could be tested in future research, for instance, by manipulating expectations of baseline replicability rates.
Nevertheless, we believe that laypeople’s predictions provide more information than is captured by the estimated accuracy rates. For example, consider the prediction pattern displayed in Figure 1. Participants as a collective were divided for a group of studies (i.e., those in the middle rows, with symmetrical bimodal distributions) and were in agreement for another group (i.e., those in the top and bottom rows of the figure). For those studies for which participants were nearly unanimous, the predictions were highly accurate. Moreover, as the figure shows, when participants as a group predicted that a particular effect would fail to be replicated, it indeed failed to be replicated.
These results indicate that the scientific culture of striving for newsworthy, extreme, and sexy findings is indeed problematic, as counterintuitive findings are the least likely to be replicated successfully. Our results also relate to the aphorism that “extraordinary (i.e., intuitively implausible) claims require extraordinary evidence.” Many studies included in our sample were considered implausible and thus would have required highly compelling evidence for the effects to be established. However, the pattern of Bayes factors in Figure 4 shows that many of the original studies obtained weak evidence of an effect; of the included studies, 37% (10 studies) yielded a Bayes factor lower than 3, evidence that is “not worth more than a bare comment” according to Jeffreys (1939, p. 357). The combination of low intuitive plausibility and weak initial evidence is remarkable and arguably worrisome, especially in light of the low replication rates in social science. To account for the extraordinary nature of a claim, researchers should adjust the prior probability of the alternative hypothesis and the null hypothesis. In the Bayesian framework, this means that a higher Bayes factor would be necessary to conclude that the effect is present; in the frequentist framework, a lower p value would be is necessary to reject the null hypothesis (cf. Benjamin et al., 2018).
The notion of prediction surveys and markets as a valuable component of replication research seems to be gaining momentum. The Replication Markets platform (https://www.replicationmarkets.com), for instance, invites researchers as well as the general public to predict and bet on 3,000 studies associated with the Systematizing Confidence in Open Research and Evidence (SCORE) project (Root, n.d.). Although these predictions yield valuable insights, we naturally do not advocate replacing replication studies with judgments of the general public—or with those of experts. Rather, laypeople’s predictions may be used to provide a quick snapshot of expected replicability. This can facilitate the replication process by informing the selection of to-be-replicated studies. Whether laypeople’s replication predictions are distributed unimodally or bimodally may, for instance, steer researchers’ confidence in evaluating which predictions are more or less reliable. Additionally, the relative ordering of laypeople’s confidence in the replicability of a given set of studies may provide estimations of the relative probabilities of replication success. If the goal is to purge the literature of unreliable effects, one may start by conducting replications of the studies for which replication failure is predicted by naive forecasters. Alternatively, if the goal is to clarify the reliability of studies for which replication outcomes are most uncertain, one could select studies for which the distribution of the expected replicability is bimodal. Thus, prediction surveys may serve as decision surveys, instrumental in the selection stage of replication research (cf. Dreber et al., 2015). These informed decisions not only could benefit the researchers attempting replications, but also could optimize the distribution of funds and resources for replication projects. In addition, the application of prediction surveys to systematically assess effects’ prior plausibility can easily be extended to novel hypotheses. The Social Science Prediction Platform (https://socialscienceprediction.org/), for instance, allows researchers to submit an untested hypothesis and collect forecasts from both experts and nonexperts. An interesting application would be to use these assessments in conjunction with large collaborative research efforts such as the Psychological Science Accelerator (Moshontz et al., 2018), so that laypeople’s predictions may not only contribute to replication research, but also inform the prior plausibility of novel studies.
Supplemental Material
Hoogeveen_Rev_Open_Practices_Disclosure – Supplemental material for Laypeople Can Predict Which Social-Science Studies Will Be Replicated Successfully
Supplemental material, Hoogeveen_Rev_Open_Practices_Disclosure for Laypeople Can Predict Which Social-Science Studies Will Be Replicated Successfully by Suzanne Hoogeveen, Alexandra Sarafoglou and Eric-Jan Wagenmakers in Advances in Methods and Practices in Psychological Science
Supplemental Material
PredictingReplicability_SupplementalMaterial_Revision – Supplemental material for Laypeople Can Predict Which Social-Science Studies Will Be Replicated Successfully
Supplemental material, PredictingReplicability_SupplementalMaterial_Revision for Laypeople Can Predict Which Social-Science Studies Will Be Replicated Successfully by Suzanne Hoogeveen, Alexandra Sarafoglou and Eric-Jan Wagenmakers in Advances in Methods and Practices in Psychological Science
Footnotes
Acknowledgements
We thank Job Bank, Chiel van ’t Hoff, and Philip Kleinbrahm for their support in creating the study materials and collecting the data.
Transparency
Action Editor: Simine Vazire
Editor: Daniel J. Simons
Author Contributions
S. Hoogeveen and A. Sarafoglou contributed equally to this work. S. Hoogeveen, A. Sarafoglou, and E.-J. Wagenmakers jointly generated the idea for the study. S. Hoogeveen and A. Sarafoglou wrote the preregistration, constructed the survey, collected and analyzed the data, and wrote the first draft of the manuscript. All three authors critically edited the manuscript. All the authors approved the final submitted version of the manuscript.
Notes
References
Supplementary Material
Please find the following supplemental material available below.
For Open Access articles published under a Creative Commons License, all supplemental material carries the same license as the article it is associated with.
For non-Open Access articles published, all supplemental material carries a non-exclusive license, and permission requests for re-use of supplemental material or any part of supplemental material shall be sent directly to the copyright owner as specified in the copyright notice associated with the article.