
Abstract
Quantitatively coding open-ended data (e.g., from videos, interviews) can be a rich source of information in psychological research, but reporting practices vary substantially. We provide strategies for improving validity and reliability of coding open-ended data and investigate questionable research practices in this area. First, we systematically examined articles in four top psychology journals (N = 956) and found that 21% included open-ended data coded by humans. However, only about one-third of those articles reported sufficient details to replicate or evaluate the validity of the coding process. Next, we propose multiphase guidelines for transparently reporting on the quantitative coding of open-ended data, informed by concerns with replicability, content validity, and statistical validity. The first phase involves research design, including selecting data and identifying units reliably. The second phase includes developing a coding manual and training coders. The final phase outlines how to establish reliability. As part of this phase, we used data simulations to examine a common statistic for testing reliability on open-ended data, Cohen’s κ, and found that it can become inflated when researchers repeatedly test interrater reliability or manipulate categories, such as by including a missing-data category. Finally, to facilitate transparent and valid coding of open-ended data, we provide a preregistration template that reflects these guidelines. All of the guidelines and resources provided in this article can be adapted for different types of studies, depending on context.
The open-science movement has raised critical questions about how to conduct research more transparently in the psychological sciences (Hales et al., 2019), with the ultimate goal of improving validity in measurement, statistics, and the conclusions that are drawn (Vazire et al., 2022). Most efforts to improve psychological research have focused on quantitative data, but recently, qualitative research has also received more attention (see e.g., Campbell et al., 2023; Steltenpohl et al., 2023). The focus of the current article is the quantitative coding of open-ended data, which includes elements of both quantitative and qualitative analysis. Open-ended data are data that are not constrained by predefined responses. Examples of open-ended data include text-based free-response survey formats, interviews, images, social media postings, video materials, and observations of live behavior. Open-ended data are quantified when humans assign codes to summarize the data for statistical analysis. As part of this process, transparent research practices can help researchers and readers evaluate whether the codes and the conclusions drawn from the quantitative analyses accurately reflect the original meaning of the data.
There are many advantages to using open-ended data. Open-ended data allow participants to behave or provide responses with fewer limitations than forced-choice formats that have predetermined options (Adler et al., 2017; Braun & Clarke, 2013; Howitt & Cramer, 2011; Reja et al., 2003). Text, images, and behaviors can all be coded. Open-ended text or interviews can allow participants to provide “meanings through and in their own words” (Ruona, 2005, p. 234), which can give insight into participants’ diverse reasons or motivations for thinking and behavior. The different types of open-ended data can provide insight into cognition or behavior with fewer restrictions imposed by researchers. This means that open-ended data can be especially useful when research is conducted in new settings, when findings are complex or context-specific, or when potential future hypotheses need to be developed. Data from open-ended survey responses can also be used in conjunction with forced-choice methods, either to offer alternative explanations to what was found via closed-ended measures (Jackson & Trochim, 2002) or to establish the validity of closed-ended questions (Singer & Couper, 2017).
Quantitative coding differs from some qualitative methods, such as reflexive thematic analysis (e.g., Braun & Clarke, 2013) because it allows researchers to assess the frequency of derived themes. When codes are well defined and agreement is established, it may also be possible to replicate findings or to discover patterns that generalize to other contexts.
However, there are dangers to the process of quantifying open-ended data. Quantification replaces rich text or other data with categories that summarize their meaning from the researchers’ perspectives. The effect is that quantification can result in a loss of the specific meaning participants attempted to convey (Braun & Clarke, 2013). At the same time, quantifying open-ended data and indicating that the coding is reliable through agreement metrics can give the illusion of objectivity (see e.g., Natow, 2022) when, in fact, quantification is still subject to bias. When coding is conducted without transparency about the process, this problem is magnified because a lack of transparency can hide bias and other problems that undermine validity (Linneberg & Korsgaard, 2019; Syed & Nelson, 2015).
Across the field of psychology, there has been an effort to increase transparency of methods, materials, and analyses to examine studies’ validity and potentially to replicate findings (Nosek et al., 2022). Recent studies suggest that transparent research practices may help improve research quality. For example, preregistration can increase power and sample size (Tenney et al., 2021; van den Akker et al., 2024). Initial evidence also suggests that Registered Reports (i.e., in which the research design and hypotheses are evaluated before data collection) show signs of increased quality compared with similar articles from a more traditional publishing model (Soderberg et al., 2021). Transparent research practices have only recently started to be adopted, and transparency is still lacking across the field of psychology (see e.g., Aguinis & Solarino, 2019; López-Nicolás et al., 2022).
The quantitative coding of open-ended data relies on researchers to code with fidelity to participants’ original meaning using logical inference and appropriate statistics, but as we show below, much of that process is done with very little transparency. To aid in the movement toward a more transparent and valid psychological science, we developed a methodological framework to guide researchers and editors who work with quantitative coding of open-ended data.
In this article, we first report on common practices in how researchers construct quantitative summaries from open-ended data. We then describe strategies for increasing transparency in reporting the process of coding open-ended data, which can make the process more reliable and valid. We next use data simulations to examine how a lack of transparency in reporting metrics of agreement can conceal what we call “kappa-hacking,” or misleading reports of interrater reliability. Finally, we provide a preregistration template and guidelines for researchers, editors, and reviewers that can be adapted to the needs of different types of studies using open-ended data to make it easier to use transparent and valid practices. The information provided in this article offers a starting point for discussions about best practices in quantifying open-ended data but no rigid rules or requirements. These considerations will vary for different types of research and must be taken in context.
The Current State of Reporting on Coding of Open-Ended Data: A Systematic Analysis of Recently Published Psychology Articles
To assess current practices in reporting on the coding of open-ended data in peer-reviewed publications, we analyzed academic articles from four high-impact psychology journals across different areas: Cognitive Psychology, Developmental Science, Journal of Personality and Social Psychology, and Psychological Science. Our aim was to select journals that are representative of different subareas of psychology and psychology as a whole. Although we do not consider the impact factor to serve as an accurate metric of scientific quality or impact, we chose journals with high impact factors (3.00 and above at the time of analysis) to pursue a sample of articles that are likely to be cited and read by researchers. Because of time and resource constraints, we restricted our analysis to articles published by the journals from the years 2020 to 2021. We examined all articles in every volume and issue published in those years and assessed how the coding of open-ended data was reported (N = 956 articles).
Methods: coding the content of published articles
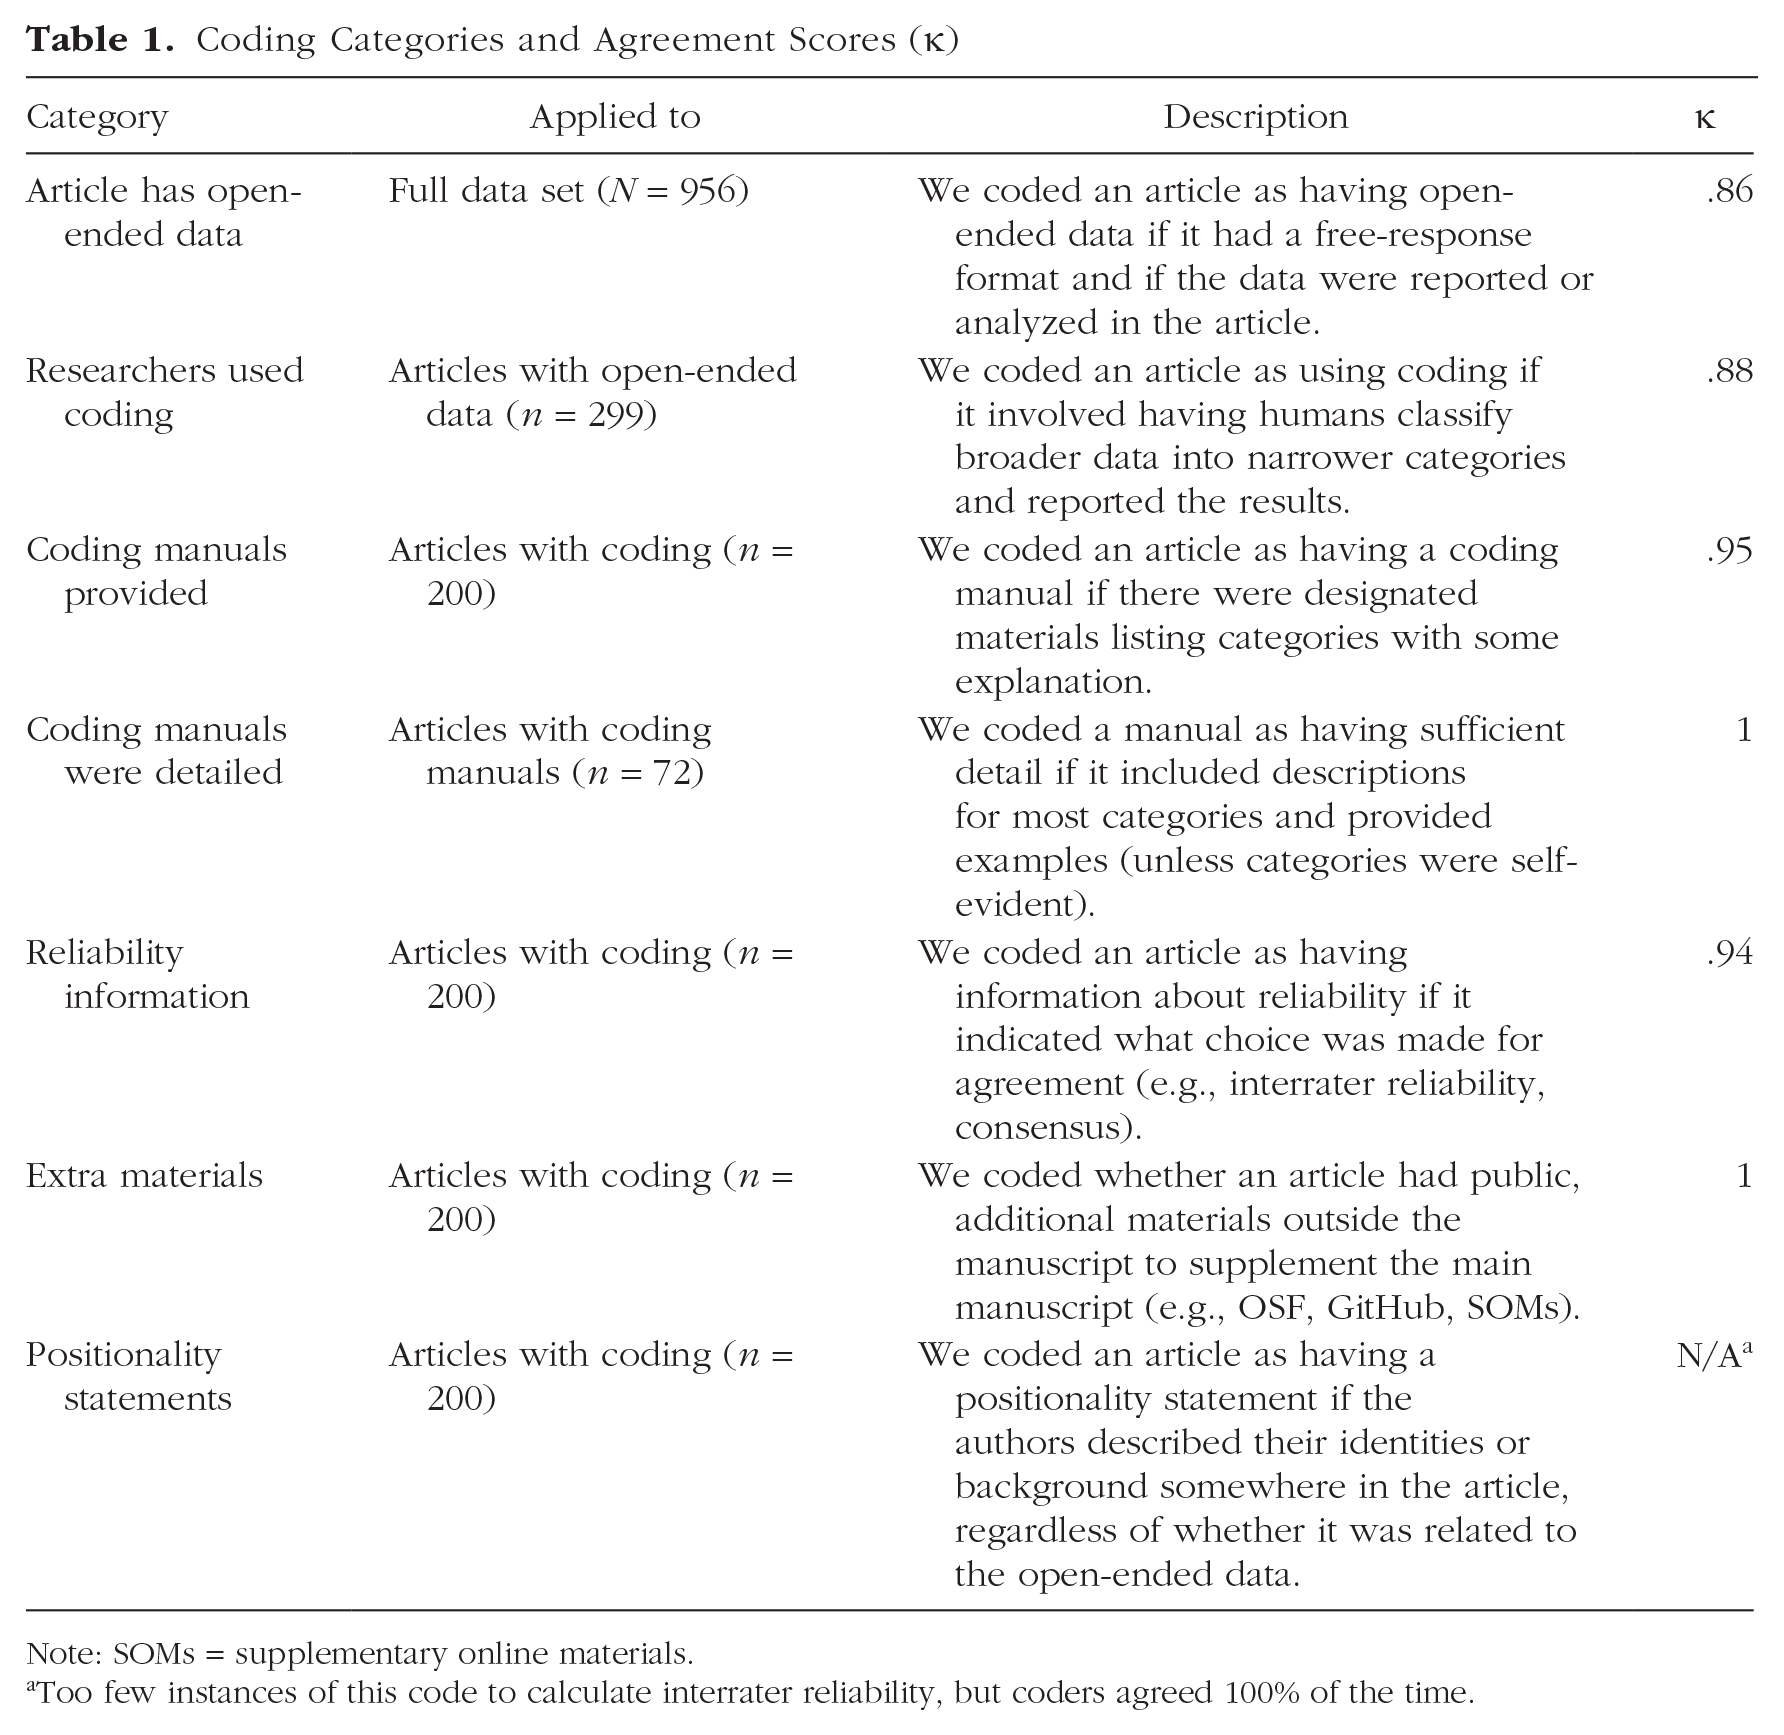
For every article, we first assessed whether it contained any open-ended data, and if so, we coded whether the researchers used any type of human coding and whether they provided details about their coding approaches (see Table 1). We focused on elements of the coding process that were relevant to validity, transparency, and reliability in quantitative analysis of open-ended data.
Coding Categories and Agreement Scores (κ)
Note: SOMs = supplementary online materials.
Too few instances of this code to calculate interrater reliability, but coders agreed 100% of the time.
To examine open-ended data and how they were coded in these articles, two of the authors (T. Waltzer and F. C. DeBernardi) discussed the goals of our article, drafted the proposed coding scheme, and conferred with all of the authors to finalize the list of coding categories, which is detailed in Table 1. To code each category, we searched through all available materials for a given article (e.g., main text, OSF, other online supplementary materials). Each category was coded dichotomously as “present” or “absent.”
We assessed our agreement in coding each of the categories by having the two authors independently code a random subset of 20% of the articles. After achieving agreement using Cohen’s κ in our first test phase, one of the authors coded the remaining data. Further details about this analysis are available in our Supplementary Online Materials (SOM) on OSF (https://osf.io/du6gy/).
Results: patterns of (non)transparency in recent publications
About one-third of all the articles (31%, n = 299) contained some type of open-ended data (e.g., interviews, open responses, gaze patterns). 1 Most of the 299 articles with open-ended data applied some type of human coding to the data (67% of articles with open-ended data or 21% of all journal articles coded, n = 200). Articles counted as using coding if humans but not automated or algorithmic processes classified broader data into narrower categories. The vast majority of these methods were quantitative, although a few used qualitative approaches (e.g., thematic analysis). 2
We looked more closely at those 200 articles that used coding. Most articles with coding provided the statistics they used to calculate agreement (79%) and had some supplementary materials beyond the main text (83%; e.g., stimuli or survey instruments). However, only about one-third of the articles that used coding had some type of coding manual (36%, n = 72) in either the text or supplementary materials. Even among the articles with manuals, only about two-thirds of them had sufficient detail, which was just 23% (n = 46) of all articles with coding. In addition, only one article contained a positionality statement (< 1%).
Our analysis suggests that there is a lack of transparency in reporting coding processes, especially regarding providing details about the coding schemes, coder instructions, and the authors’ positionalities. Instead, authors typically reported only interrater reliability metrics without further elaboration. A typical report lists coding categories only by their labels and then reports a measure of agreement, similar to the example in Figure 1. Our analysis suggests that typical reports of coding open-ended data in journals do not contain sufficient information to reproduce the step-by-step process of coding open-ended data or to adequately evaluate its validity.

Example report on interrater reliability in the coding of open-ended data.
Suggested Guidelines for Transparency at Each Stage of the Process of Coding Open-Ended Data
What information is most essential to be included in reports of open-ended data that are quantitatively coded? There are many different methods of coding available (see e.g., Hallgren, 2012; Wicherts et al., 2016; and our SOM for terms, their definitions, and further reading: https://osf.io/du6gy/), and many decisions affect the validity and reliability of the results, similar to the garden of forking paths described by Gelman and Loken (2014). Coding open-ended data is further complicated by the fact that the specific details of coding are often based on tacit knowledge (Collins, 2001; Kiger & Varpio, 2020; Wilson, 2009). This means that each lab, research group, or individual researcher has their own set of methods and preconceived notions about their process, and this tacit knowledge is often opaque to others outside the research team.
In this section, we examine different considerations for coding open-ended data at each of three phases of the coding process: (a) research design and planning, (b) coding-manual development and training, and (c) establishing and reporting agreement. In the flowchart in Figure 2, we provide an illustration of this step-by-step approach to coding open-ended data. For each of these phases, we focus on creating transparent, reliable, and valid research.

A conceptual flowchart illustrating different steps in coding open-ended data.
Our guidelines are designed to meet the goals of producing valid science that leads to meaningful findings. However, we recognize that in implementing these goals, each study has different challenges that may mean compromises must be made. The features of the study, such as the needs of participants and the resources available, can mean that it is necessary to focus attention on different practices. For example, when working with open-ended data, full transparency can put participants’ privacy at risk in ways that can be dangerous (see e.g., Campbell et al., 2023; Pownall et al., 2023). In addition, making open-ended data available for inspection or reuse may require significant resources, such as the time and financial resources needed for documentation, anonymization, and translation (Elman & Kapiszewski, 2014; Karhulahti, 2022).
We hope the guidelines that we propose in this article can be a start to deeper conversations around best practices in coding open-ended data and not the final word on any such conversations. Any suggestions in this article are not meant to be taken as absolute requirements without consideration of context. (And we note the risks of relying on default “checklists” for evaluating, say, journal-article submissions, which could bias publication rates against diverse forms of research that differ from the standard mold.) The following sections outline our proposed guidelines. Researchers can convey their efforts to make their work as reliable and transparent as possible by addressing the relevant areas described below, but when their research context is not suitable for full transparency, the researchers may choose to adjust their practices and explain their decisions (Adu, 2019; Peterson, 2019; Ryu, 2020).
Research design and planning
Goals and nature of the data: considerations in formulating a research design
Coding open-ended data is a resource-intensive process. Therefore, we recommend establishing and communicating a clear rationale for choosing quantitatively coded open-ended data over other methods of data collection (e.g., forced-choice questions) or analysis (e.g., producing rich narrative data for purely qualitative analysis). A clear rationale helps guide decisions about whether and how to use quantitatively coded open-ended data.
The rationale for using open-ended data may differ depending on the type of data collected. If researchers plan to test hypotheses with open-ended data, they can specify those hypotheses ahead of time, for example, in a preregistration.
In their data collection, researchers can aid in assessments of validity by specifying the otherwise tacit details. For example, details about the context of interviews are important to document. Interviewers may have the opportunity for follow-up questions (Adler et al., 2017; Jackson & Trochim, 2002) if the context and study policies allow them. Interview responses can also differ depending on the level of privacy and confidentiality participants feel, including whether there are others who can hear their responses in the setting. When they are interviewed in settings with less privacy and researchers ask direct questions about sensitive issues, participants may be guarded in their responses (DeKeseredy et al., 2020; Grimm, 2010; Nederhof, 1985), or social-desirability effects may be increased (Fine & Elsbach, 2000). Written responses also have unique challenges that should be made explicit. The quality of independent written responses can be affected by details such as the size of the response box and the clarity of the instructions (Smyth, 2016). Open materials may convey some of these details (e.g., the size of the text box) but not others (e.g., who is in the lab when participants complete a survey). Researchers should be mindful of documenting the tacit factors in data collection that could affect the meaning of the data.
Selecting material to be coded
Another aspect of coding that sometimes remains tacit is the selection of materials to code. In some cases, all available material is coded, whereas in other cases, a subset of materials may be selected from a larger set of options. For example, for a study about content in children’s television programs, it may not be possible to include all possible television programs. Therefore, choices must be made about which programs to include and how to sample them. Effort should be made to show that the material chosen is representative of the target population of materials. Alternatively, if researchers choose to focus on a nonrepresentative subset, they should provide a rationale for that choice and explain how their sample was chosen. Explanations should take into account a variety of factors, including research questions, the theory being tested, ethical considerations, and resource-related constraints.
Data preparation
Data preparation includes how and whether to transcribe audio files, de-identifying data, and other steps to prepare the data for coding. Details about how data are prepared for coding should be disclosed. For example, researchers may or may not choose to transcribe verbal data so that they can be coded more precisely. This decision and the quality of the transcription can have an impact on the meaning because a single missing word can transform the meaning of a phrase (Adler et al., 2017). De-identifying data must also be done with care because the context provided by identifying information may be important to the meaning of the data in some cases (e.g., Campbell et al., 2023). Because different research questions require different levels of transcription detail, researchers must assess what is optimal for their purposes; documentation that reflects both what was done and how these choices were made is helpful.
The unit of analysis
The selection of the unit of analysis is a part of data preparation that is sometimes overlooked. The unit of analysis (also referred to as a “segment”; Hruschka et al., 2004) is “the section of qualitative analysis that will receive a code” (Syed & Nelson, 2015, p. 377). Deciding what constitutes a unit for each study involves considering what unit is the most valid representation of the construct of interest and the practical implications of determining different units of analysis reliably. For example, a study of the Bechdel effect in television might have a sentence as a unit of analysis to see if women speak about topics unrelated to men in each sentence they speak, so each sentence is coded separately as a unit. Alternatively, the unit could be each turn talking, regardless of length of their speech, or the unit could be the time in minutes that each character speaks. In our analysis of coding in psychology journals from 2020 to 2021, the unit of analysis was a single published article.
In each of the cases above, it is relatively unambiguous to determine what constitutes a single unit. Perhaps because many units are unambiguous, many researchers do not report how the units were chosen. However, there are also many cases in which researchers make a subjective judgment about when a section of data constitutes a unit. For example, in participants’ reasoning about their moral judgments, they may express multiple justifications (e.g., “That’s not fair, and you could get in trouble for that!,” in which the word “and” separates two different justifications, one related to fairness and one referring to punishment; for examples, see Waltzer et al., 2022, 2023). When units are subjective, establishing reliability for identifying the units separately from the reliability for coding the units is important. The process of identifying each unit of analysis can be strengthened if it is guided by clear criteria that are based on theory or clearly defined research questions, and documentation of this process can be included in the coding manual, described below.
Coding-manual development and training
Developing a coding manual
A coding manual is a document that details the definitions, rules, and procedures used to categorize units of open-ended data into codes (DeCuir-Gunby et al., 2011; Weston et al., 2001). A transparent and comprehensive coding manual is foundational for working with open-ended data because it defines how one reduces open-ended data into quantitative values (Adu, 2019; Weston et al., 2001; Wilson, 2009). Coding manuals are often too lengthy for a manuscript, but they can be shared in supplemental online materials. There are several considerations that should be addressed to make coding manuals more accessible and useful.
The specifics of choosing or developing a coding manual are subject to the researchers’ goals, but validity should be prioritized as much as possible. When developing a new coding system adapted from existing work (e.g., Saldaña, 2016), it may be appropriate to use previous versions to show convergent, divergent, or incremental validity of the new coding system by comparing it with past systems (Adler et al., 2017). New coding systems can be developed as a bottom-up process, a top-down process, or a combination of both (Syed & Nelson, 2015), and these have different implications for validity. An example of a bottom-up process is when coders examine the responses and then propose a set of themes that reflects the data. In contrast, a top-down process starts with the themes relevant to the study’s goals and examines whether they are actually present in the responses. When researchers create a new coding manual, they should consider what others may need to understand about the development of the coding categories in terms of how the category development may affect the meaning of the data.
As much as possible, valid coding should reflect the meaning intended by participants, ideally including the full spectrum of common responses in the data and in the population of interest (Syed & Nelson, 2015; Whittemore et al., 2001). For example, coding categories may be developed or examined from a random selection of 10% to 25% of the data, depending on frequency of the categories in the data (Adler et al., 2017), or categories may be derived from the entire data set, which helps to ensure that the codes created reflect the full range of responses (Syed & Nelson, 2015). One strategy to ensure validity, sometimes referred to as “member checking,” involves consulting with participants for their feedback on the coding, interpretations, or conclusions of the research (Campbell et al., 2023; Lincoln & Guba, 1985). Documentation that details how data were used to develop the coding categories can help ensure that findings are interpreted correctly.
It is helpful to provide the set of rules defining whether a specific unit of analysis is or is not captured by a particular code, including both inclusion and exclusion criteria and examples (for more information on how to set these rules, see MacQueen et al., 1998). Documentation should also indicate whether codes are dichotomous, signifying absence or presence, or multivalue (e.g., low, medium, high; Hruschka et al., 2004) and how many codes can be used for each unit of analysis. Finally, any rules that transcend a single coding category, such as ranking different coding categories or hierarchical coding, should also be specified in documentation because some rules can affect the validity of the coding. For example, if coders are told that certain key phrases are indicative of a particular category or if they use rules such as “use x code as the default,” they may assign items to a category even when the items do not conceptually fit. This can inflate the level of agreement at the expense of the validity of the findings. Therefore, this type of rule should also be documented.
Documentation should also explain when and where coding took place. Observational methods sometimes rely on coding that is done directly during data collection (on site) rather than afterward using recorded materials, such as video or audio (Sussman, 2016). Depending on the research, on-site coding may be appropriate, or it may lead to errors. When resources, such as time and money, do not allow for recording and transcription of data, researchers should consider whether the meaning of the data is retained and whether any coding would be uninformative, or worse, misleading.
Applying the coding manual: training coders
To successfully code open-ended materials, researchers usually need to be trained to use the coding categories in the coding manual effectively. This training may happen in conjunction with the development of the coding manual or separately from its development (Adler et al., 2017); training coders can often reveal opportunities to refine the coding manual in a dynamic process of disagreements, confusions, discussions, and resolutions. Therefore, documentation of the training procedures can be helpful for detailing how the categories are defined conceptually. For example, we recommend selecting examples for the coding manual and the manuscript during the process of developing the manual and training coders (Adler et al., 2017).
When defining coding categories, it is useful to have a theory or other criteria to use as a benchmark for categories. One way this is done is to have a “gold-standard coder” who has content-matter expertise. With a gold-standard coder, the goal of training and agreement metrics is for coders to match the codes of the gold-standard coder (Bakeman & Quera, 2011; Gwet, 2014; Syed & Nelson, 2015), which provides the advantage of establishing agreement based on expertise rather than on matching alone. With matching alone as a criterion for reliability, it is possible that matches between coders are based on a common misunderstanding of the theory or data, resulting in reliable but not valid coding. A gold-standard coder who has expertise helps to ensure that matches reflect valid coding.
Another option is to include a coder who is less familiar with the study materials. For example, when Campbell and colleagues (2023) de-identified transcripts of sexual-assault survivors, her team followed up by examining whether the de-identified transcripts were still valid representations of the participants’ meaning. To do this, they asked a coder who had not been involved in the interviews to interpret the data. Including uninvolved coders can test whether data would be understandable to someone without prior knowledge of the study. Decisions about who is coding can therefore improve validity and clarity of the data, and documenting the characteristics of the coders can aid in evaluations of the findings.
Positionality: disclosing the researcher as an instrument
In addition to expertise or familiarity with the data, researchers’ backgrounds and perspectives based on their identities may shape the research process and development of coding categories (Jamieson et al., 2023; Peterson, 2019; Steltenpohl, 2020). Therefore, some researchers include positionality statements to convey their potential biases, their status and privilege, and how they intend to remain aware of these factors (e.g., by having others review their coding efforts; Holmes, 2020; Jafar, 2018; Shaw, 2010). These statements can encourage reflexivity, enhance transparency about the research process, and amplify the voices of marginalized scholars (Elsherif et al., 2022; Manalili et al., 2023; Yang et al., 2022).
However, it is also important to consider that disclosing the authors’ identities does not ensure impartiality (Savolainen et al., 2023). Furthermore, marginalized individuals could be targeted prejudicially because of their identity characteristics and therefore may not want to make their identities public knowledge (Darda et al., 2023; Oswald, 2024). This can be especially complex for people with intersecting dimensions of identity (e.g., race, neurodiversity, and gender), which are not favored by those in the dominant narrative (Sedgewick et al., 2021). 3 For these reasons, researchers should weigh the potential benefits of positionality statements against their possible drawbacks before deciding whether to add such a statement to a manuscript.
Establishing and reporting agreement
Reliability can be established in several ways, 4 including by consensus, but we focus here on interrater reliability. Interrater reliability is a formal metric of agreement between independent coders that quantifies the extent to which the coders assign the same codes to the same phenomena. Often, this involves two or more individuals independently coding a subset of the data (typically 10%–30%) to establish agreement.
Practice coding must be distinct from coding that is a test of reliability. For example, a practice phase that is particularly successful cannot be called a test phase post hoc without inflating many measures of agreement (see the section on kappa-hacking below). One way to draw a clear line between practice coding and the test of interrater reliability is for researchers to specify preestablished criteria that determine when coders are ready for the test phase of reliability. For example, the reliability test phase can be planned for when a criterion is met (e.g., when agreement is over 90% among all coders twice in a row) or on a specific date. Researchers may decide to include the criteria or other markers of the test phase in a preregistration. In addition, records should be kept to indicate which data were used for training and which were used for testing agreement because responses that are discussed in training should not be used in the test phase because this would inappropriately inflate the measure of agreement (Hallgren, 2012).
Certain features of the data can affect—either implicitly or explicitly—coders’ decisions. To address this, in a process often referred to as “masking,” researchers may decide to make certain information unavailable to the coders (e.g., responses to other questions that are not being coded, demographic information, experimental condition). Effectively, then, the coders’ decisions are made irrespective of these features of the overall data set. However, there may be cases when a holistic understanding of the data requires consideration of identity, responses to related questions, or other information. Therefore, the decision to mask should be made based on the specific research project. It is important to report what was masked or not masked in the test phase of interrater reliability because this information affects replication and validity.
Calculating a metric of interrater reliability
There are several statistical measures for calculating interrater reliability. These include Cohen’s κ, for pairs of raters (Cohen, 1960); Fleiss’s κ, an adaptation of Cohen’s κ for three or more raters (Fleiss, 1971); intraclass correlation coefficients (ICCs); and percentage agreement, among others (e.g., Siegel & Castellan’s κ, Siegel & Castellan, 1988; Krippendorff’s κ, Krippendorff, 1970). Whichever metric is chosen to report reliability, it should be justified in terms of its compatibility with the structure and distribution of the data and the coding.
Putting in place the cutoff for acceptable agreement before entering the testing phase, perhaps in a preregistration, can also protect researchers from shifting their standards to suit the results of the coding process, especially because both Cohen’s κ and ICCs lack clear guidelines for interpreting their magnitude. 5 Therefore, we suggest that researchers consider the goals and features of their research questions when determining an acceptable level of agreement. When faulty coding could create serious harm, higher levels of agreement may be needed (Conry-Murray & Silverstein, 2022).
If the first test phase fails to establish agreement, it may be necessary to attempt another test phase. The number of tests required to pass the established threshold should be disclosed because multiple tests can inflate many measures of agreement (see the section on kappa-hacking, below). To improve agreement without inappropriately inflating it, researchers should (a) develop a strong coding manual, (b) discuss and improve codes before the test round (Hemmler et al., 2022), and (c) select the most accurate coders before the test round. For a summary of methods for improving agreement that range from acceptable to fraudulent, see Table 2.
Summary of Different Methods for Increasing Cohens’ κ as a Measure of Interrater Agreement

Resolving coding discrepancies
It can be helpful for coders to regularly discuss coding and examine discrepancies to prevent “drift,” in which coders start to code differently when too much time has passed since training (Adler et al., 2017). However, even with continued discussion, it is possible for codes to include discrepancies between or among coders. Coding discrepancies in the test phase must be resolved before analyzing the data because typically only one set of data is analyzed. When there is a gold-standard coder, their codes should be prioritized because they have the most expertise on the topic. When there is not, discrepancies in coding are often decided by a process of discussion and consensus, or when data are continuous and codes are not widely discrepant, a mean may be taken. Another option is to have a third member of the research team code discrepancies, a method that works well if the team has several coders who have been shown to be reliable (Syed & Nelson, 2015). Again, these decisions should be disclosed and justified to allow audiences to evaluate their impact on the validity of the findings.
Coding remaining data
Coders typically divide the remaining coding among themselves to finish coding all data that were not part of the agreement test. It can be helpful to also disclose how this final coding was conducted. For example, because coding can be fatiguing, some researchers intersperse coding with other activities (Adler et al., 2017). When material is especially sensitive or potentially traumatizing (as in the case of coding sexual-assault survivors’ stories, Campbell et al., 2023), it may be especially necessary to build in breaks.
Documentation of tacit coding practices can enhance the quality of the coding because decisions will likely be made more deliberately. It also makes it possible for readers to evaluate the validity of coding and potentially for future researchers to replicate the study. However, documentation and transparency alone are not enough to make coding valid. In the next section, we examine coding practices that can inflate agreement metrics, making coding appear more reliable and valid than it is.
Kappa-Hacking: Artificially Inflating Agreement Statistics
Some readers may be familiar with the concept of p-hacking in null hypothesis significance testing research (Simmons et al., 2011). A related concept, relevant to the present article, is kappa-hacking: the manipulation of agreement metrics to artificially inflate agreement until it reaches the required threshold, distorting the agreement metric. As we describe below, our investigation finds that kappa-hacking stems from two issues: (a) repeated measurements of agreement that are susceptible to high agreement by chance and (b) manipulations of categories to exploit easy-to-code but meaningless codes. Table 2 summarizes our findings about the ways these and other practices can result in either acceptable, ambiguous, problematic, or fraudulent reports of agreement. We examine these issues in detail below using simulations to investigate several ways that kappa can be manipulated to inflate perceived agreement.
Although the issues below apply to many metrics of agreement, we focus here on Cohen’s κ, used with categorical data with pairs of coders, because it is one of the most common metrics of agreement (McHugh, 2012). However, Fleiss’s κ, used with groups of coders coding categorical data, and ICCs, used with continuous data, are also common. All of these correct for how often raters agree by chance (Cohen, 1960; Hallgren, 2012), but they are all susceptible to inflation. Below, we discuss these other metrics in relation to our findings on kappa.
Kappa-hacking: a simulation study
To examine whether it is possible to falsely inflate kappa, we ran a simulation study using R (Version 4.2.2) on a Windows Server x64, using the packages irr (Gamer et al., 2012) and dplyr (Wickham et al., 2019), with 5,000 repetitions for each condition under which kappa can be calculated. Code used for this simulation is available on OSF (https://osf.io/du6gy/). These and the following simulation results are not intended to represent every case in which kappa could be calculated or fully show the degree to which kappa-hacking can influence interrater reliability. Rather, we use these simulation results to illustrate how these methods of kappa-hacking can change the results of interrater reliability in a study. Table 3 summarizes the simulations we conducted and results from each of them.
Simulation Tests of Practices That Increase Cohen’s κ

Unevenly distributed data do not lead to kappa-hacking, but percentage agreement may be better when data are skewed.
Does kappa account for chance agreement better than raw percentage?
First, we note that kappa does an excellent job of accounting for truly random variation on average. We first simulated coding data from two coders for which there were two categories with equal base rates in the population (i.e., our simulated coders could code either Category A or Category B, where both Category A and Category B are equally likely). When the simulated coders were set to randomly assign categories, their proportion of agreement was close to .50, which is quite high considering the coders selected codes by chance. However, kappa takes random agreement into account, and indeed, the average kappa value in this simulation was close to 0, demonstrating the benefit of using kappa over percentage agreement.
Can selective reporting of test phases inflate kappa?
Although Cohen’s κ accounts for random agreement, agreement can still vary widely across tests, and kappa can be inappropriately inflated when only tests with high agreement are reported. For example, with four mediocre coders (we set the variance of the random error of mediocre coders to .35, compared with .30 for good coders), across 5,000 simulations, we found an average Fleiss’s κ (an accurate estimate of group reliability) of .64. However, reporting only the best pair of coders from that group raised Cohen’s κ to a falsely high .70 or above more than 30% of the time. With six coders, Fleiss’s κ remained .64, but at least one pair of coders was able to report a Cohen’s κ of .70 or above 52% of the time. Thus, mediocre coders can appear to be reliable when there is selective reporting about how many tests were conducted. If researchers did not identify the test phase and disclose the kappa scores for all coders and instead reported only the highest matches, then readers would not know that the coding was not reliable.
Using Fleiss’s κ for multiple coders resolves some of the issues with multiple testing and selective reporting. However, when there is a gold-standard coder whose fidelity to the true data is higher, each individual coder is matched with a single expert, so Cohen’s κ is appropriate. We therefore examined whether selective reporting of Cohen’s κ is resolved when there is a gold-standard coder. We tested agreement with a gold-standard coder compared with four mediocre coders who each matched the gold-standard coder around 70% of the time. We used four categories and equal base rates of each category. The result was that the Fleiss’s κ for all coders considered together was .57, but the chance of any coder getting Cohen’s κ above .70 with the gold-standard coder was around 26%. Having a gold-standard coder therefore improves the accuracy when it represents true expertise but does not prevent kappa-hacking when selective reporting is used.
Our simulations indicate that when there are multiple coders, selective reporting can be misleading. To avoid cherry-picking kappas, authors can use practice rounds to select the best coders and use strategies such as preregistered criteria to decide ahead of time which round of coding will be the test round. When there are multiple rounds of tests (e.g., because of a failed test round), authors should report the agreement statistics for all test rounds.
When there are multiple coders, reporting Fleiss’s κ resolved the issue of cherry-picking kappas. However, when there are pair-matches of coders, as with a gold-standard coder, Cohen’s κ is needed. To avoid kappa inflation, researchers who have a gold-standard coder should take special care to report all kappas.
Can padding agreement with trivial categories inflate kappa?
We also examined whether manipulations of the coding categories can falsely inflate Cohen’s κ. Some coding categories, such as adding a category for missing data, make it easier to reach agreement; however, they may not add meaning to research questions. We tested whether kappa is inflated when easy-match categories that are not important to research questions or hypotheses are introduced.
In our 5,000 simulations, when codes were simulated randomly but included 25% easy matches (as might be the case when missing data are coded), it resulted in an inflation of Cohen’s κ from the accurate measure of 0 to the inflated .30. With two mediocre coders and four categories, including 25% matched because of missing data, Cohen’s κ was inflated from .37 to .55. With good coders and four categories, having 25% matches based on missing data inflated Cohen’s κ from .76 to .83. We conclude that when missing data are not a meaningful coding category, using it as a coding category can falsely inflate kappa.
Matches based on missing data can arise unintentionally when “dummy-coding” categories, such as coding presence or absence of a single code. It is acceptable to use presence or absence of a single code as long as all data are from meaningful categories. When “absence” includes missing or other easy-to-code but not meaningful matches, it can inflate agreement between coders.
To address these concerns, one strategy is to remove missing or nonvalid responses from analyses first and then code the responses from meaningful categories. Authors should report which coding categories were used to calculate kappa. One rule of thumb is to calculate agreement metrics using only the categories that are related to the research questions.
Does consolidating categories inflate kappa?
We further examined whether collapsing categories would inflate kappa. Indeed, with two mediocre coders and three categories (50% A, 30% B, 20% C and 200 observations), κ is about .65; however, combining Categories B and C results in an inflated κ of .71. We acknowledge that there may be legitimate methodological or theoretical reasons to collapse categories (e.g., when use of a category is very low and when categories can be meaningfully collapsed based on theory). However, collapsing categories solely to increase kappa is inappropriate. When categories are collapsed, they should be conceptually similar, and they should be the same categories that are then used for data analysis, reporting, and discussion.
Does data peeking bias agreement scores?
We also examined whether adding more data affects Cohen’s κ. In two simulations, we found only small changes in kappa resulting from adding more data. For example, with two mediocre coders, the average kappa across 5,000 simulations did not change substantially between 50 and 300 cases when stopping at increments of 50 cases (κ was between .530 and .534). In another trial, when stopping at the preselected number of 200, peeking at increments of 50 cases also did not substantially change kappa (average κ ranged between .639 and .642, depending on the sample size). Therefore, data peeking with Cohen’s κ is generally unproblematic because it is relatively robust to changes in sample size. See Table 3.
However, we note that it is possible to achieve a high rate of matches in a single analysis by chance. Therefore, if data peeking is used in combination with optional stopping and selective reporting, it can still be a problem, even though data peeking is not a problem on average.
Does unevenly distributed data bias agreement scores?
With just two categories, some have suggested that it can be challenging to get a sufficiently high Cohen’s κ (McHugh, 2012; Syed & Nelson, 2015). We examined whether kappa provides useful information when there are only two categories of codes. We simulated data with two equally likely categories for which coders were reasonably good. Given that two categories make it possible to match by chance frequently, some reduction in agreement seems appropriate. Indeed, their proportion of agreement was .82, and their Cohen’s κ was .67, averaged over 5,000 simulations.
However, it is more difficult to reach an acceptable kappa when the base rate prevalence is not equal. For example, when there is a 90% chance of one category and 10% chance of the other, our simulations showed that the proportion of agreement between two good coders remained around .82, but κ decreased to .42, on average, over the 5,000 simulations. Even when we used Fleiss’s κ, the proportion of agreement was still substantially higher in every simulation condition. Therefore, we suggest that percentage or proportion agreement could be reported in addition to Cohen’s κ when there are only two categories and especially when base rates are unequal (see also Xu & Lorber, 2014).
Other measures of interrater reliability
The ICC offers a means of reporting interrater reliability when data are continuous (i.e., ordinal or interval). ICC assesses reliability by measuring correlations within a class, such as repeated measures (Liljequist et al., 2019). Fleiss’s κ also allows for more than two coders, but it is used with categorical data. Although similar in intent, these measures are based on slightly different information (e.g., kappa reflects degree of agreement, whereas the ICC can show consistency between raters or degree of agreement; Shrout & Fleiss, 1979).
The same general considerations that apply to the use of Cohen’s κ for interrater reliability also are relevant when using the ICC, Fleiss’s κ, and other metrics. In particular, when data that are not meaningful are included only for the purpose of improving agreement (e.g., including missing data as matches), it can inflate any measure of agreement. In addition, although most measures of agreement account for chance agreement over many tests, individual tests may occasionally be high because of chance. If agreement by any measure is reported selectively (e.g., by repeated testing with different samples or by selecting different constellations of coders), it can lead to artificially high metrics.
Therefore, we suggest that authors should report all relevant design considerations and analytic results to reassure the reader that no such manipulation has taken place. Just as with the interpretation of other metrics, such as effect sizes, prevailing discipline-specific standards also should be taken into account in interpreting the meaning of any interrater reliability values.
Transparent Practices: Recommendations for Journals and Authors
In the sections above, we discussed several practices that often go unreported in research with quantitatively coded open-ended data (e.g., reporting the reliability of identifying units, reporting all kappas in a test phase, reporting all categories tested for reliability). We cannot be sure whether these practices for rigorous coding development, training, and application are common because, as we found in our analysis of published articles, most articles provide very little information about how their coding was conducted. If researchers were more transparent about research practices and if journals supported this effort, it would help readers to assess whether the coding reflects valid and reliable categories.
However, the nature of open-ended data varies greatly across different types of studies (e.g., autobiographical reasoning in an interview study, observations of child behavior, gaze patterns from a visual-expectancy study). Accordingly, the challenges, benefits, and practicalities of implementing transparent practices will also vary greatly across studies (e.g., coding narrative data from autobiographical interviews might call for a more elaborate coding manual than coding infant eye-gaze patterns in an experimental study). We caution against unilaterally adopting the following recommendations without considering the context of each research study. Keeping these caveats in mind, below, we discuss three areas in which more transparency could potentially increase trust in research with open-ended data.
Sharing materials
One way to improve transparency is to share materials on platforms such as OSF. We recommend sharing materials such as the coding manual, reliability coding data and script, and final coding data and scripts. Sharing the full coding manual can help to document how the researchers established coding categories. Sharing the de-identified data and script for interrater reliability can allow others to assess the statistical validity of the agreement metric. Sharing the statistical code or script documents how the data were used for hypothesis testing or exploration. In addition, sharing the rationale for the many tacit decisions can help make the choices better understood.
When privacy and copyright concerns allow, it can also be helpful to openly share the raw data being coded. Sharing private or identifiable data requires participants’ consent. As appropriate, researchers may need to explicitly ask for consent to make data available on a public website for analyses beyond the current project.
Narrative data can be difficult to anonymize, and consent forms can address this by explaining how participants’ data will be shared with raters and publicly, for example, in presentations or in a data repository (Adler et al., 2017; Campbell et al., 2023). When topics are especially sensitive, sharing with participants exactly how data will be de-identified can help them to decide what information is safe to share with researchers (Campbell et al., 2023).
Even with informed consent to share open-ended data, researchers should make a serious effort to de-identify data, especially when the safety of participants is at stake. Although direct identifiers, such as social security numbers, are clearly problematic, it is also possible to identify participants through voice or images or through combinations of seemingly innocuous variables, such as race, gender, and age. Furthermore, when some data come from focus groups or other interactions, it may be possible for “insiders,” such as a domestic-violence perpetrator, to identify participants (see Campbell et al., 2023). Some researchers also offer participants the option to redact specific statements at the end of the session. Campbell et al. (2023) created a codebook of the types of information that might be identifiable using guiding questions to evaluate ambiguous information (e.g., “Who else would know this information?” “How would they know?” “What other records exist that contain the information?”). Coders attempted first to blur the information by altering specific words to make them more general. If that was not sufficient, coders used redaction.
When data need to be restricted but can otherwise be made available to people outside the research team, it can be shared via repositories that are not public, such as Databrary (https://nyu.databrary.org/), where access to sensitive or identifiable data requires access control. Researchers should also take special care regarding what laws apply regarding personal data (e.g., the Family Educational Rights and Privacy Act in the United States and General Data Protection Regulation in the European Union).
Usability of shared materials
Transparency includes usability. Too much information (e.g., providing copies of every iteration of the coding manual) or information that is hard to navigate may not be useful. We therefore recommend making information as user-friendly as possible (e.g., including a README file with data set name and structure, variable names and how they are coded, and any other helpful information for getting started).
When done ethically and carefully, transparent reporting can allow people who are not affiliated with the project to understand what is being claimed, coded, and reported, which allows for better assessments of validity and replication.
Preregistration
Given that it is possible to inappropriately inflate measures of agreement and otherwise hide bias in coding, there are advantages to prespecifying plans and hypotheses through preregistration or Registered Reports. Registered Reports have the additional advantage of allowing researchers to receive external peer feedback on their design and preregistration decisions (e.g., Chambers & Tzavella, 2022; Henderson & Chambers, 2022; Nosek et al., 2018). Prespecifying some of the process-level decisions can be helpful for avoiding inflated kappas and can help to transparently communicate which data-analysis decisions were made in advance.
We provide a template for the preregistration of coding open-ended data quantitatively (shared on OSF: https://osf.io/du6gy/). Some examples of information to include in the preregistration template are information about the plans for establishing agreement or interrater reliability (including information on practice and test phases), whether there will be a gold-standard coder, and what the threshold for agreement will be, among other things. However, we also acknowledge that each study has different features and goals and that authors should decide what is useful to preregister based on their specific study.
Reporting coding in the manuscript
Finally, we suggest that reporting in articles, even with limited space, could be more transparent than the current practices we found. Specifically, we recommend that authors regularly report (a) the method of selecting materials and when they are ambiguous, the method of establishing units; (b) the coding categories used in interrater-reliability metrics and analysis of research questions, their definition, and inclusion and exclusion criteria; (c) the qualifications of the coders, including whether there was a gold-standard coder and potentially, positionality; (d) the results of all agreement tests from the test phase(s) and how they were conducted (e.g., masked, independent); and (e) how the final codes were determined. For an illustration of such a report, see Figure 3.

A sample of the proposed format for reporting interrater reliability.
In Table 4, we offer more details about what information we recommend should be disclosed in the article and supplemental materials, aiming to distill the considerations we covered throughout this article into specific strategies for authors that supplement our preregistration template (see SOM, https://osf.io/du6gy/). We also offer guidance to help editors and reviewers through the process of evaluating this work described in this article for increasing the validity of quantitative coding of open-ended data. The proposed guidelines are of a global nature, and we encourage editors, reviewers, and authors to tailor them for the specific needs and challenges in their relevant research communities. Because each study has different goals and different researchers have different resource constraints, each research team should consider how their practices aid reproducibility and allow readers to make accurate judgments about the validity of the research. We do not believe that the questions in Table 4 should be criteria that are applied to every study. Instead, researchers and editors should consider the specific features of each study and the context in which implications may apply. Therefore, the questions from Table 4 should be adapted to the specific study.
Questions to Consider Across Different Stages of Coding Open-Ended Data

Conclusion
The rich nature of open-ended data means that it can provide deep insights into participants’ thinking and behavior. Indeed, we are glad to see that open-ended data are commonly used in the journals we assessed. However, a key challenge for doing valid research is to represent open-ended data accurately and credibly. When topics are sensitive or have implications for policy or could provide the basis of future research, it is especially important to convey the meaning credibly. Questionable research practices in the quantitative coding of open-ended data—many of which we have seen in practice—can undermine scientific progress and harm those affected by the research. Unfortunately, with current standards, these questionable practices remain hidden from research reports.
Increased transparency allows other researchers to assess the fidelity of the interpretation of data. With better documentation, researchers could have the information they need to evaluate whether data accurately represent participants’ thoughts and behaviors. It also provides important information to researchers who want to reproduce or generalize their findings to other contexts.
Increasing transparency about coding practices can also help establish norms for quality coding practices to ensure that valid practices are adopted by the broader research community. Our analysis of current practices in peer-reviewed journals suggests that transparent practices are rare. Academic journals could increase their support for transparency by encouraging more thorough reporting of important information about the coding processes. Authors, reviewers, and editors alike can push for systemic improvement in psychology by encouraging students, trainees, colleagues, and journals to consider the standards we have recommended. We, as researchers, can fulfill our responsibility to participants and others affected by research only if we strive to conduct valid research.
Footnotes
Acknowledgements
This article began as an unconference at the Society for the Improvement of Psychological Science (2021). We thank Jan B. Vornhagen, who worked with T. Waltzer to create a demonstration of the process for developing a coding manual, which is shared on the OSF page for this article (![]() ). We also thank Annayah Prosser and Richard Klein for their contributions during the early stages of conceptualizing and writing this article. We also thank Kyra Larson, Maryam (Aria) Arianezhad, Audun Dahl, and members of the Developmental Moral Psychology Lab at UC Santa Cruz for their inputs on earlier versions of this article.
). We also thank Annayah Prosser and Richard Klein for their contributions during the early stages of conceptualizing and writing this article. We also thank Kyra Larson, Maryam (Aria) Arianezhad, Audun Dahl, and members of the Developmental Moral Psychology Lab at UC Santa Cruz for their inputs on earlier versions of this article.
Transparency
Action Editor: David A. Sbarra
Editor: David A. Sbarra
Author Contribution