
Abstract
Newly developed, web-based, open-repository concepts, such as community-augmented meta-analysis (CAMA), provide open access to fulfill the needs for transparency and timeliness of synthesized evidence. The main idea of CAMA is to keep meta-analyses up-to-date by allowing the research community to include new evidence continuously. In 2021, the Leibniz Institute for Psychology released a platform, PsychOpen CAMA, which serves as a publication format for CAMAs in all fields of psychology. The present work serves as a tutorial on implementing and using a CAMA in PsychOpen CAMA from a data-provider perspective, using six large-scale meta-analytic data sets on the dark triad of personality as a working example. First, the processes of data contribution and implementation of either new or updated existing data sets are summarized. Furthermore, a step-by-step tutorial on using and interpreting CAMAs guides the reader through the web application. Finally, the tutorial outlines the major benefits and the remaining challenges of CAMAs in PsychOpen CAMA.
Keywords
In the last decade, open-science practices have gained more and more attention to provide replicable and reproducible evidence in psychological research. In the field of research syntheses, valuable recommendations have been proposed to enhance transparency and reproducibility throughout the entire methodological process (Lakens et al., 2016). Systematic reviews and meta-analyses can serve as fundamental summaries of a specific research topic for further study planning and provide a valid foundation for evidence-based practical implications and guidelines (Heesen & Halpern, 2021). Therefore, transparency and timeliness of synthesized evidence play a crucial role for researchers and practitioners in psychological science and related scientific fields. However, recent criticisms regarding research syntheses have highlighted that reproducibility and replicability are still insufficient because of a lack of transparent reporting (Polanin et al., 2020) and a failure to provide up-to-date evidence caused by the potential time lag between conduction and publication (Beller et al., 2013). Consequently, such outdated syntheses lead to inaccurate and invalid conclusions (Créquit et al., 2016). Addressing these shortcomings, novel, web-based, open-repository concepts for meta-analyses and systematic reviews emerged in various research areas of psychology and neighboring fields (e.g., Bosco et al., 2015; Elliott et al., 2017; LeBel et al., 2018; Shackelford et al., 2021; Spadaro et al., 2022; Tsuji et al., 2014). Some recent applications provide timely syntheses in urgently relevant topics in health research (e.g., Counotte et al., 2018; Michelen et al., 2021) or use the databases for efficiently searching subsets of studies to answer specific research questions in social sciences (e.g., Steel et al., 2018; Yuan et al., 2022).
One proposed concept, community-augmented meta-analysis (CAMA), has its roots in developmental psychology and describes a meta-analysis stored in an openly available data repository providing full access and disclosure of all data and results (Tsuji et al., 2014). The main idea of CAMA is to keep meta-analyses up-to-date and “alive” by allowing researchers to include new data, thus promoting the continuous expansion of meta-analytic evidence and preventing it from becoming obsolete. A CAMA can be used as a practical tool to reveal potential research gaps, evaluate the quality of a specific research topic, and use the results for prospective power calculations (Bergmann et al., 2018). Thus, a CAMA can support decisions throughout the entire study-planning process and enables adequate theory evaluation (Cristia et al., 2022).
Most existing systems for realizing CAMAs and similar concepts can be divided into either single- or multiple-database frameworks. Single-database frameworks comprise one broad database within one research field and provide functions to search and select meta-analytical subsets (e.g., Bosco et al., 2019; Spadaro et al., 2022). Multiple-database frameworks comprise numerous databases, each encompassing data of separate research syntheses (e.g., Elliott et al., 2017; Tsuji et al., 2017).
PsychOpen CAMA
In 2021, the Leibniz Institute for Psychology (ZPID) released a new system called PsychOpen CAMA (https://cama.psychopen.eu/), which is structured as a multiple-database framework and serves as a publication format for CAMAs in all fields of psychology (Burgard et al., 2022). Currently (June 2023), it contains 23 CAMAs in seven domains: clinical psychology, cognitive development, cognitive psychology, health psychology, organizational psychology, personality psychology, and survey methods.
PsychOpen CAMA comprises the two essential elements of a CAMA system: a data repository for meta-analytical (meta)data and a web application that provides basic meta-analytic tools, both interactively connected (Burgard et al., 2021). The framework’s core is the data repository, storing all CAMA data, including R packages and functions. The stored data are openly accessible via the CAMA web application, which provides a graphical user interface (GUI). The GUI enables the research community to explore, analyze, and visualize CAMA data directly within the web application. Moreover, all data sets are available for download, thus facilitating the reuse and expansion of the data sets. Researchers can serve as contributors and either create a new CAMA or expand an existing CAMA data set by adding relevant new research findings. All CAMA data, metadata, and functions in PsychOpen CAMA are stored in a standardized, interoperable format to ensure automatized processes between the functions and analysis tools in the GUI (for a more detailed description of interoperability in PsychOpen CAMA, see Burgard et al., 2022).
The Present Tutorial
So far, PsychOpen CAMA has been introduced and compared with other systems from a developer perspective, highlighting the required elements of a CAMA system and presenting the platform’s technical architecture (see Burgard et al., 2021, 2022). However, to date, there is no hands-on report on data contribution and the use of the functions in the web application in detail. Hence, the present work serves as a tutorial on implementing and using a CAMA in PsychOpen CAMA from the practical perspective of a data provider and user, summarizing the first experiences of realizing a CAMA in this system. It includes a detailed description of the implementation and transformation of meta-analytic data into CAMAs in PsychOpen CAMA by using six large-scale meta-analyses as a working example. In addition, in the present tutorial, we provide a step-by-step guide on applying and interpreting the functions directly available in the web application, using one of the six CAMAs as an exemplary illustration. The topic of the underlying data sets and the rationale for the meta-analyses are addressed in the following.
Working example: the dark triad of personality
Twenty years ago, Paulhus and Williams (2002) introduced the dark triad of personality, tying together three socially aversive, malicious personality traits in the nonclinical population: Machiavellianism, narcissism, and subclinical psychopathy. Individuals high in trait Machiavellianism are characterized by a devious, manipulative interpersonal style and an absence of conventional morality (Christie & Geis, 1970). Narcissism is defined by entitlement, dominance, and a grandiose perception of self-importance (Raskin & Hall, 1979). The third trait, subclinical psychopathy, has its early roots in the clinical domain and is associated with antisocial behavior, high levels of impulsivity, and a lack of empathy (LeBreton et al., 2006). Although each of the three traits originated separately, they share a substantial empirical overlap (e.g., Muris et al., 2017; Paulhus & Williams, 2002).
Since its introduction, the dark triad has gained enormous attention in the scientific community. The original work of Paulhus and Williams has been cited more than 5,100 times since its publication in 2002, according to a search in Google Scholar on February 12, 2023 (Fig. 1). Especially in the last decade, research interest has been growing extensively.

Citations per year of Paulhus and Williams (2002). Figures are based on a Google Scholar search on February 12, 2023. Blue square points highlight the cutoff years of previously conducted research syntheses focusing on trait interrelations and sex differences in the dark-triad traits.
The quantity of research regarding the dark triad has been repeatedly summarized over the last 10 years. Existing research syntheses on the dark triad of personality have provided extensive literature reviews (e.g., Furnham et al., 2013; Koehn et al., 2019; Kowalski et al., 2021), including critical considerations (e.g., Miller et al., 2019). Existing meta-analyses have investigated the structure and interrelations of the constructs (Muris et al., 2017; Vize et al., 2018), relations to other prominent personality models (e.g., Howard & Van Zandt, 2020; O’Boyle et al., 2015), and relations with various psychosocial correlates (e.g., Lebuda et al., 2021; O’Boyle et al., 2012; Walker et al., 2022; Włodarska et al., 2021). However, existing research syntheses provide only an outdated picture of the current state of the dark-triad research because new evidence appears nearly every day. Thus, a CAMA is a suitable approach for this very field, aiming to keep evidence up-to-date, reproducible, and “alive.” For this reason, it has been chosen as the underlying topic for this tutorial.
The rationale and methodological background of the CAMAs
The CAMAs in this tutorial focus on bivariate trait interrelations (i.e., the overall correlation between Machiavellianism and narcissism, Machiavellianism and psychopathy, and narcissism and psychopathy) and univariate sex differences in each trait, thus resulting in six meta-analyses. Compared with trait interrelations, examining sex differences in the dark-triad traits represents a relatively new topic within this research field (Dinić & Jevremov, 2021). Consequently, only one published systematic review (Furnham et al., 2013) and one published meta-analysis (Muris et al., 2017) focused on component interrelations and univariate sex differences in the dark triad of personality, among other topics by now. In addition, two unpublished meta-analyses investigated trait interrelations and sex differences in the dark-triad traits (Osinski, 2011; Prinz, 2019). 1 Thus, considering the rapidly growing research progress, a CAMA will benefit the field of dark-triad research in at least two ways. First, it allows a dynamically synthesized and expandable picture of component interrelations and sex differences in each trait. Second, it provides an extensive, reusable database for advanced, further analyses.
Disclosures
PsychOpen CAMA and all presented functions in this tutorial are freely accessible via https://cama.psychopen.eu/. The data set and codebook for the presented CAMA in this tutorial are published under a CC BY 4.0 license in PsychArchives (https://www.psycharchives.org/), the repository for digital research objects provided by ZPID, and can be downloaded and used further (https://doi.org/10.23668/psycharchives.7070). In addition, the used data set and detailed information on data acquisition and methodological considerations of the underlying meta-analyses are available in the Supplemental Material available online. The official R package for all outputs in PsychOpen CAMA, uniquely developed by ZPID, is available in a Git repository (https://github.com/leibniz-psychology/PsychOpen-CAMA-R-package).
Tutorial
Navigation in PsychOpen CAMA
We start with an overview of the start page of PsychOpen CAMA (https://cama.psychopen.eu/) and a brief guide for navigation in the web application: The start page introduces the user to the concept of CAMA, highlights the main benefits and use cases for the research community, and gives brief information on how to contribute to PsychOpen CAMA (Fig. 2, Box A). The top menu bar contains all functions directly available in the web application (Fig. 2, Box B). The following sections of this tutorial are divided into two parts: (a) a description of the procedure to contribute and implement data into the current version of PsychOpen CAMA and (b) a step-by-step guide through the functions of the web application.
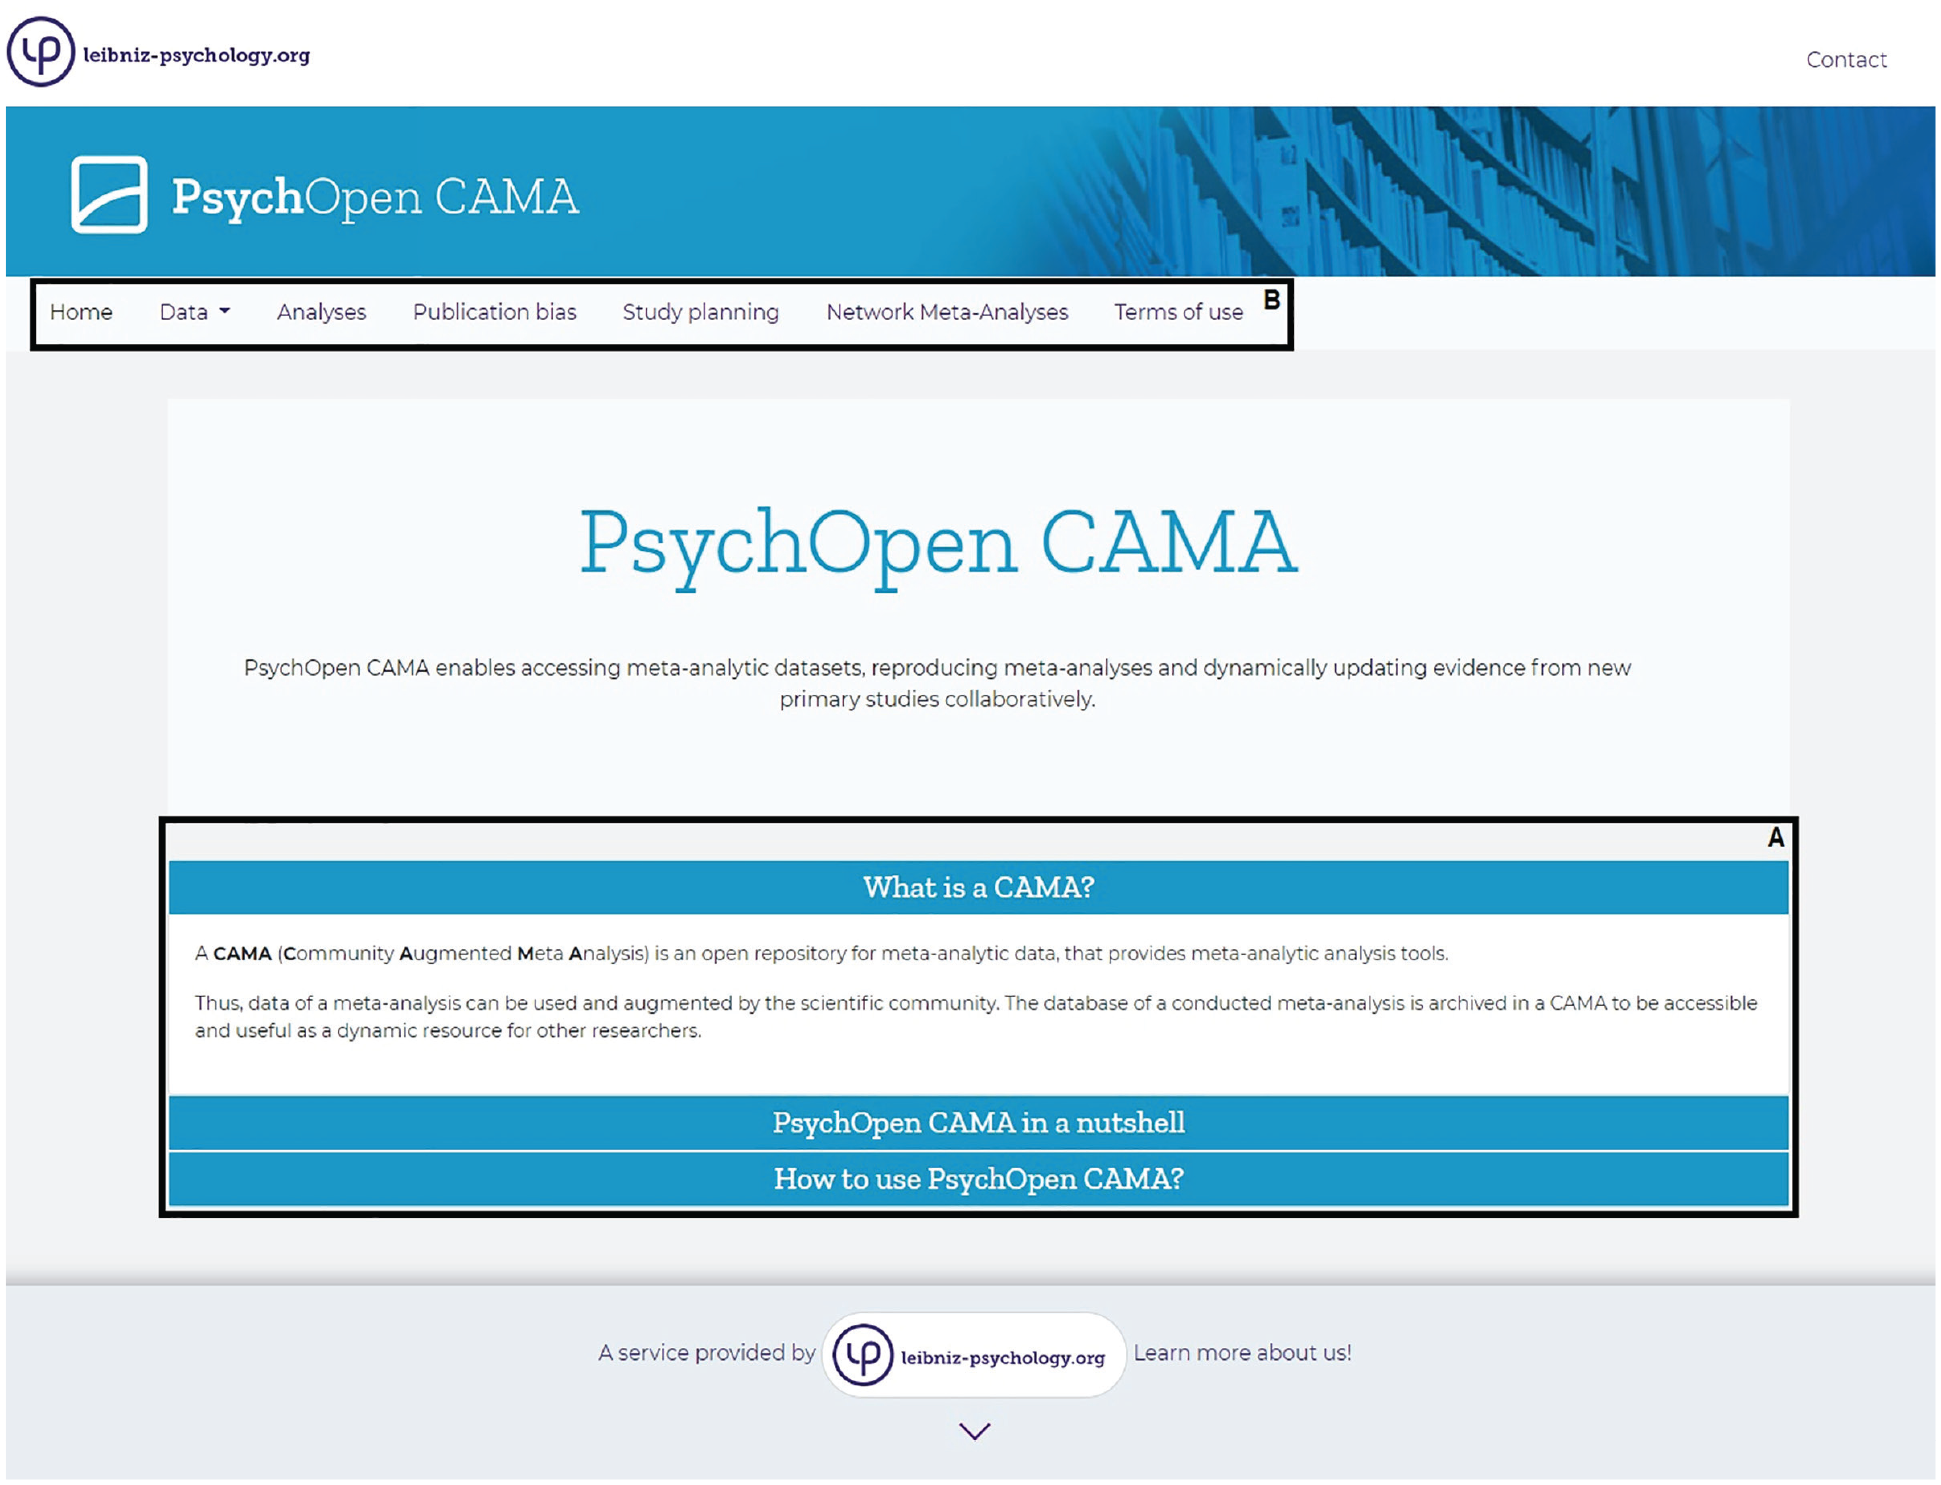
Start page of PsychOpen CAMA. Clicking on the tabs in Box A shows information on CAMA in general, a brief introduction to PsychOpen CAMA, and the use cases of PsychOpen CAMA. CAMA = community-augmented meta-analysis.
Data contribution in PsychOpen CAMA
Along with the framework of CAMA, the whole research community is allowed to contribute and share meta-analytic data in PsychOpen CAMA by either creating a new CAMA (i.e., implementing a meta-analysis as a whole) or adding published or unpublished primary-study data into an existing, fitting data set. All contents regarding data contribution in PsychOpen CAMA are available via the tab “Data” in the top menu bar by clicking “Data Contribution” in the drop-down menu (Fig. 3).
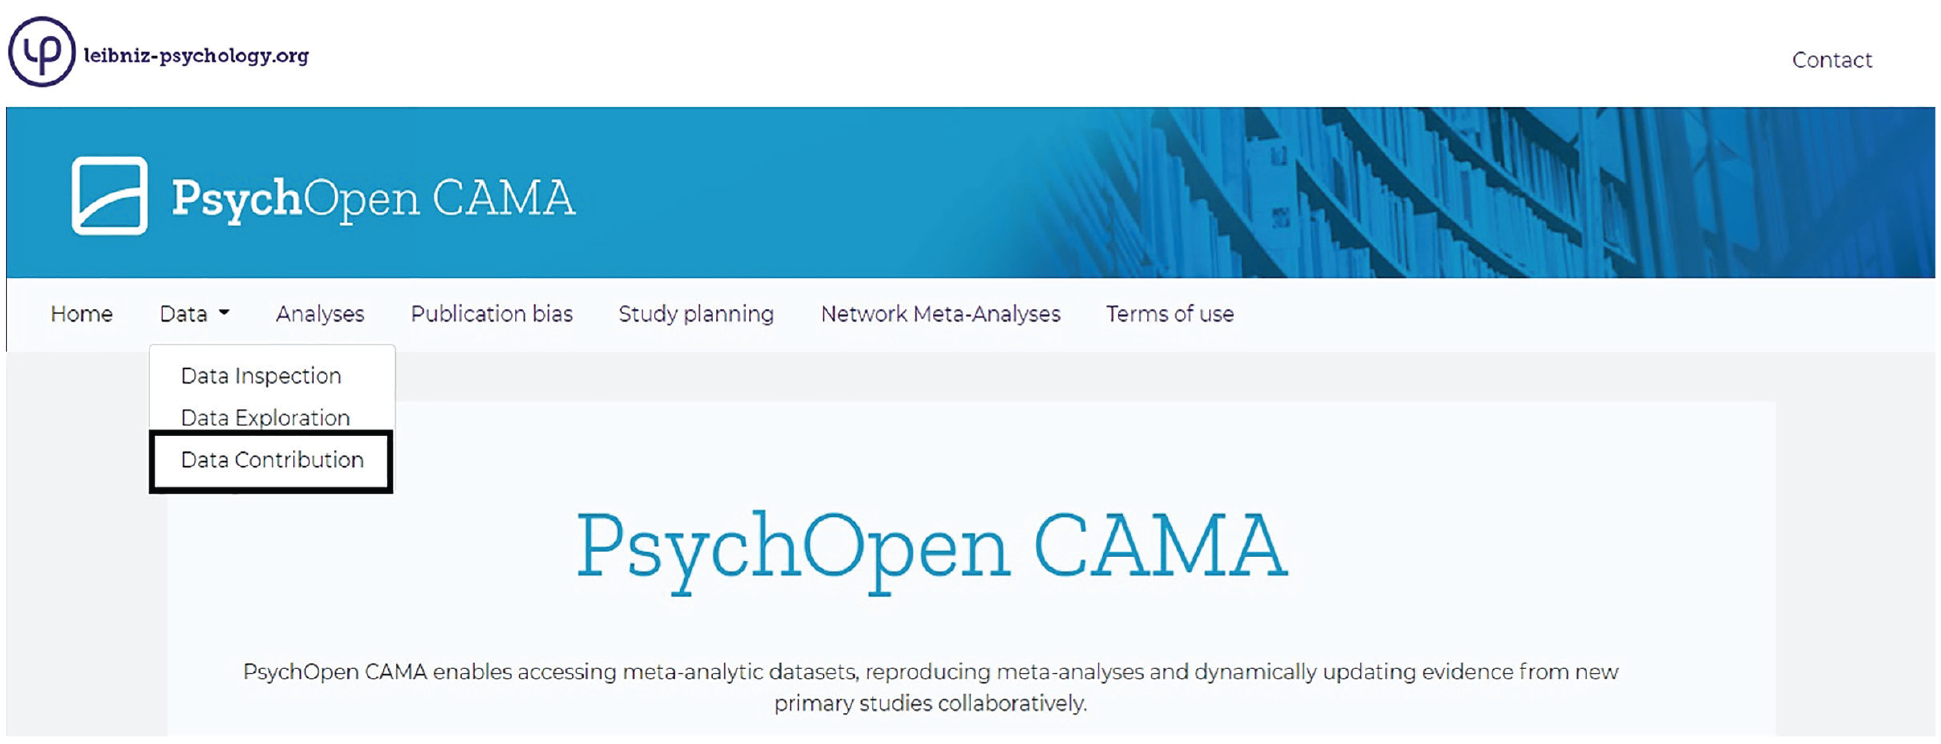
Drop-down box of the menu tab “Data.”
The page includes information on how to share a meta-analysis as a whole and create a new CAMA (Fig. 4, Box A), how to update or add single studies to an existing data set (Fig. 4, Box B) and offers help on how to fill in the standardized data sheets correctly by using example data sets and providing a section for frequently asked questions (Fig. 4, Box C). In the current version of PsychOpen CAMA (July 2022), data contribution has to be made manually by contacting the CAMA team via email.

Information page on data contribution. Box A = download link of the standardized spreadsheet template; Box B = selection and download of available, existing data sets; Box C = frequently asked questions and download links of example data sets.
Creating a new CAMA
Sharing a meta-analysis as a whole and turning it into a new CAMA requires the transformation of the original data into standardized CAMA data. Therefore, a standardized spreadsheet is provided, divided into four levels: (a) outcome information (i.e., all included effect sizes and related information for computation), (b) sample information (e.g., sample size, target group, and mean age of the sample), (c) study information (e.g., country of conduction, type of study, and randomization), and (d) report information (e.g., authorship, publication status, publication year). The variables’ labels are predefined for every CAMA to ensure automatized processes between CAMA data, machine-readable metadata, and all underlying functions in the web application (Burgard et al., 2022). However, further variables (i.e., potential moderators) relevant to a specific topic can be added on each level because not every meta-analysis considers the same moderators. The spreadsheet templates are available for download via the link in Figure 4, Box A.
In addition, all relevant metadata on the meta-analytic data set itself have to be prepared (i.e., the research question and the eligibility criteria of the underlying meta-analysis). In general, when creating a CAMA data set, keeping the inclusion criteria as broad as possible is useful to provide an exhaustive, reusable database in a specific research field. This allows researchers interested in more narrow, in-depth analyses to download and use each CAMA data set further (e.g., by selecting specific subgroups or moderators).
In the empirical example for this tutorial, six existing data sets of a previously conducted but unpublished meta-analysis were used for initial implementation, including data until March 2018 (Prinz, 2019). All included reports (m = 181) were screened again, recoded, and finally used to write the analysis scripts for the proposed meta-analyses. The initial data sets ranged from k = 170 to k = 172 included effect sizes for meta-analyses on trait interrelations and k = 202 to k = 212 included effect sizes for meta-analyses on sex differences.
After data preparation, the contents of the original codebooks have been transferred into the structure of the CAMA spreadsheets to implement these data sets in PsychOpen CAMA. Therefore, some variables in the spreadsheet template have been adapted to fit the type of included studies in the meta-analyses. 2 Finally, the data sets and all relevant metadata (i.e., the study protocol containing the rationale and all data-analytical considerations of the analyses) have been forwarded to the CAMA team of ZPID via email. After the initial implementation, validity checks were conducted with the newly implemented CAMA data and the original data to ensure the results in PsychOpen CAMA were the same as in the original calculations. Any differences and inconsistencies have been discussed and resolved between the CAMA team and the data provider until all data and results are reproduced.
Updating an existing data set
One of CAMA’s advantages is the possibility to keep evidence “alive” by adding relevant new data into an existing, openly available data set. In PsychOpen CAMA, all implemented CAMA data sets are stored in PsychArchives. Each CAMA data set can be selected via the drop-down field in the “Data Contribution” function (Fig. 4, Box B), which provides the link to PsychArchives, where the data sets can be downloaded (Fig. 5). Data sets can be expanded by either adding new rows (i.e., new studies with relevant effect sizes) or new columns (i.e., pertinent new moderators for a meta-analysis). When new moderators are added to an existing data set, the relevant information, if available, must be added for each included study (for navigating to the reference list of a data set, see Fig. 8 in the section, Data Inspection).

Drop-down menu for selecting a community-augmented meta-analysis (CAMA) data set. The drop-down menu lists all CAMA data sets available in PsychOpen CAMA. The labeling of a data set is left to the initial contributors. 3
However, it is essential that the existing variable structure in a data set (i.e., the variable labels) remains the same to enable automatized processes for the data update. Again, the updated data set has to be submitted via email to the CAMA team.
In the empirical example of this tutorial, the initially implemented data sets have been updated and expanded because of the rapid progress of the dark-triad research. Therefore, a literature search was conducted in December 2020, followed by literature screening and coding of the finally included studies. The data-acquisition process has been summarized in a PRISMA flowchart (Moher et al., 2009; see Fig. A1 in the Supplemental Material). 4 Each data set has been downloaded directly from the web platform and filled with the newly included data to implement the update in PsychOpen CAMA. Then, all expanded data sets were forwarded to the CAMA team. Again, validity checks were conducted to ensure the reproduction of the original results in PsychOpen CAMA.
In sum, 213 reports were added to the existing data set, resulting in a current sample of 394 reports (20.6% unpublished) for all CAMAs. The current sample of reports provides 449 independent samples (total N = 205,352), ranging from k = 413 to k = 415 included effect sizes for the meta-analyses on trait interrelations and k = 430 to k = 442 included effect sizes for meta-analyses on sex differences. Overall, the male-to-female ratio amounts to 82,643:122,375 5 (59.6% female).
A step-by-step guide through the GUI of PsychOpen CAMA
Step 1: becoming familiar with the data set
Before users start and (re)run some fundamental analyses, it is helpful to get an overview of the data set of interest, its variables, and all related metadata. Therefore, the user can use the first function in the menu bar, “Data.” It allows users to access all available CAMA data sets in PsychOpen CAMA. Clicking on the menu tab “Data” opens the drop-down menu with three options: (a) “Data Inspection,” (2) “Data Exploration,” and (3) “Data Contribution” (Fig. 3). The first two will be important in this step.
Data inspection
The function “Data Inspection” gives the user access to the entire data set and all related metadata stored in PsychOpen CAMA. Users first will be asked to select a particular domain and an available data set they would like to inspect. By choosing the domain “Personality Psychology,” the user can select one of the dark-triad CAMA data sets, for example, “Sex differences in Psychopathy” (Fig. 6, Box A). After selection, the web application shows a table with essential background information, such as the citation of the original publication, the data provider, and the underlying research question (Fig. 6, Box B). It shows that the underlying research question of this data set addressed univariate and multivariate sex differences in subclinical components of the dark triad of personality.

Data inspection.
The table in Figure 6 fully discloses all included data within this data set, including all moderator variables and outcomes (Fig. 6, Box C). The user can slide through the data using the horizontal and vertical scroll bars. The summary below the table shows that this data set includes 442 entries (i.e., effect sizes provided by studies). By resting the cursor on the variable name, a pop-up appears showing a descriptive summary of the corresponding variable (i.e., descriptive statistics of numeric variables, frequencies of factor variables, and class and mode of character variables).
Users also can sort the variables ascending or descending by clicking on the column title (i.e., the variable name). Moreover, the filter option with the free input field above the table can be used. For example, the user can select all studies in the data set that use student samples by writing “student” into the input field. Then, the user can sort the variable r_year (i.e., the publication year of a study) ascending by clicking the variable header once. As a result, a table is shown with all studies using student samples (k = 163), sorted by year of publication (Fig. 7).

Filtered data set. The subset of studies using student samples, sorted in ascending order by year of publication.
For more information on the data set, users can click “documentation for this dataset” (Fig. 6, Box B). This link opens another window, showing a table with more detailed information on the selected data set, such as information on eligibility criteria, the description of the investigated effect sizes, and the hierarchical structure of the underlying data (Fig. 8). Moreover, users can find the full list of included references and their digital object identifiers (DOIs) in this CAMA data set.
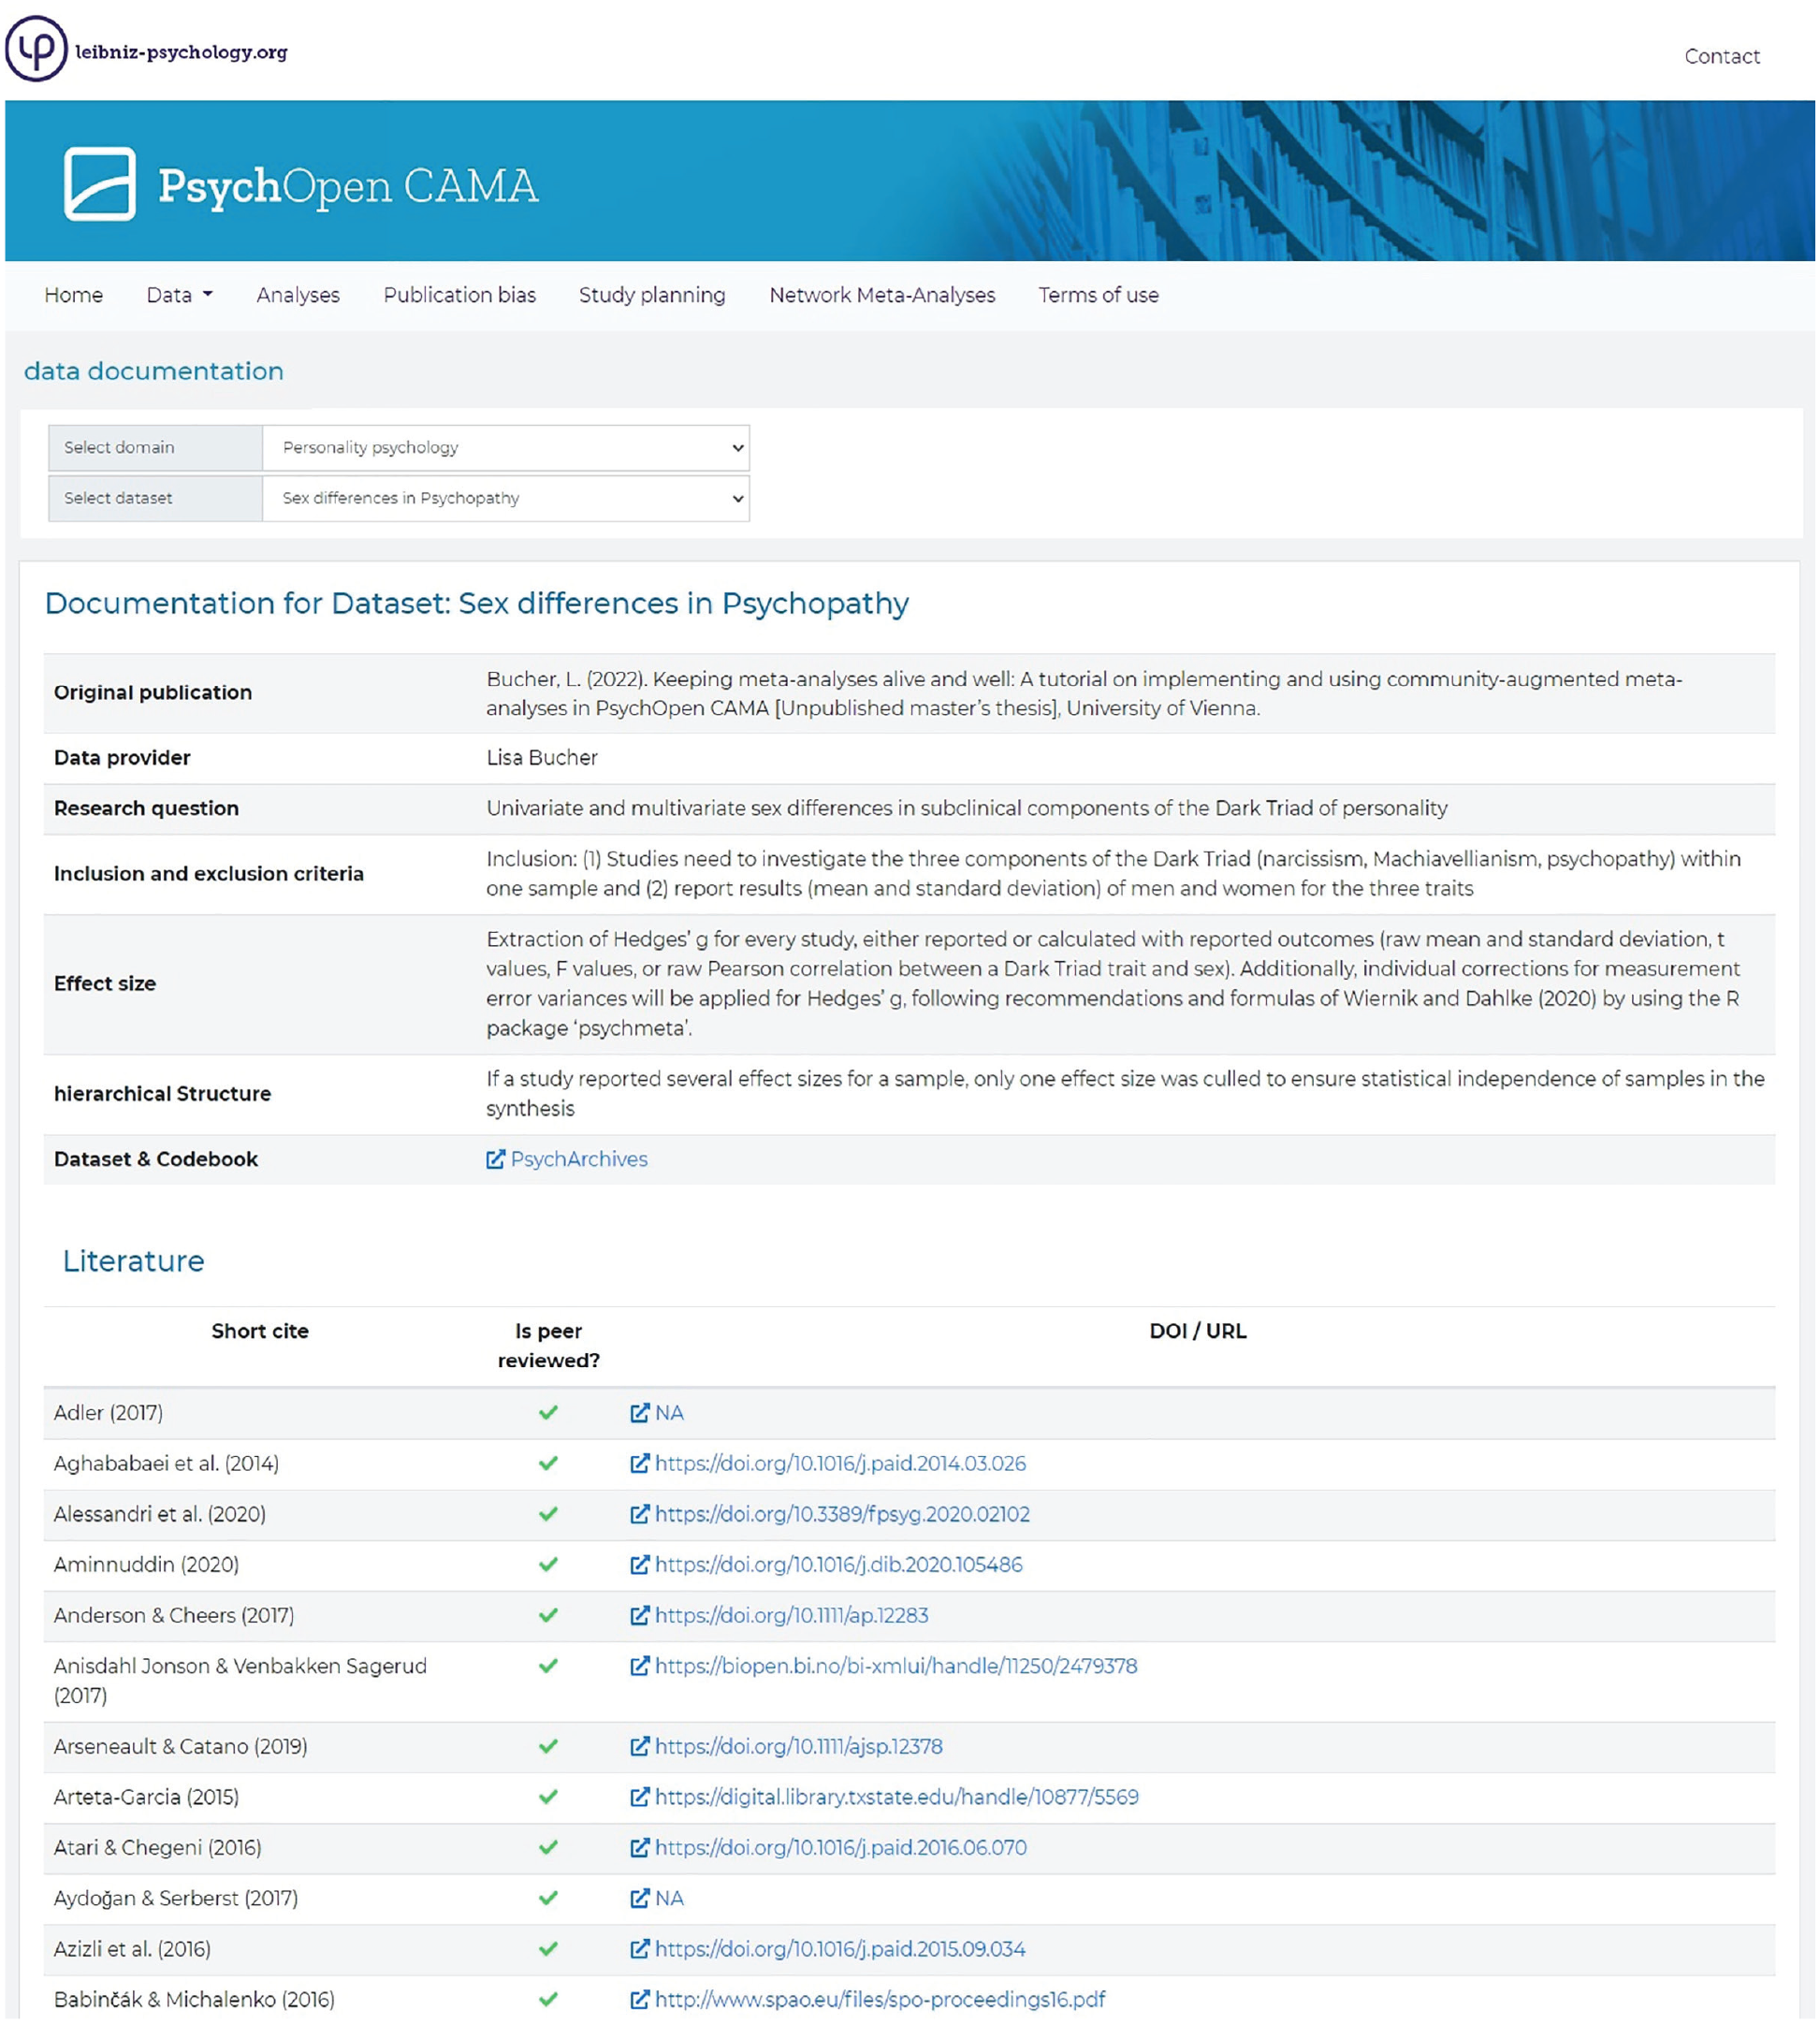
Documentation for the data set.
For the data set “Sex differences in Psychopathy,” the table shows that the value for standardized mean differences, Hedges’s g, was used to reflect sex differences between men and women in trait psychopathy. Furthermore, corrected effect-size estimates (i.e., corrected for unreliability of the measurements) are available, computed with the R package psychmeta (Dahlke & Wiernik, 2019). Moreover, the table shows that all included effect sizes are extracted from independent samples. Thus, there are no dependencies within the data to account for.
The link, “PsychArchives” in Figure 8, leads directly to the storage of the underlying data set in PsychArchives. It is the same link as in Figure 6, Box A. It provides information on the citation of the data set (Fig. 9, Box A), the preview and download links for the selected data set, and the corresponding codebook (Fig. 9, Box B). The codebook lists all variables within the chosen data set and description of the type and meaning of a variable. It gives essential background information to understand the content of a data set to reuse or expand the data adequately. Finally, the tabs above the files give more detailed information (i.e., the version history and the metadata of the selected CAMA data set).

Link to PsychArchives.
Data exploration
Via the main menu bar, the user can switch to the next function in the drop-down field, “Data Exploration,” which provides various visualizations of the effect sizes within a data set. It is helpful to get a descriptive, pictorial representation of the underlying data. To start, the user can again select the data set “Sex differences in Psychopathy” of the domain “Personality psychology” for this step (Fig. 10, Box A). In addition, the user has to choose an available effect-size type, for example, Hedges’s g. The output immediately displays a violin plot that visualizes the effect sizes’ probability density (Fig. 10, Box B). A violin plot shows the effect-size distribution (i.e., similar to box plots) in combination with the density trace of the effect sizes, highlighting the specific shape of the distribution, such as peaks and clusters (Hintze & Nelson, 1998). Wider shapes represent a higher probability of effect sizes. The plot in Figure 10, Box B shows the violin plot for the data set “Sex differences in Psychopathy.” The four horizontal lines in the plot mark the quintiles (20%, 40%, 60%, 80%) of the effect-size distribution.

Data exploration.
In addition, users can explore various potential moderators for the chosen data set. The variables selectable as moderators vary between each CAMA, depending on the available information in each data set. For example, for the data set “Sex differences in Psychopathy,” 15 variables are available, all referring to report, sample, or measurement characteristics (Fig. 10, Box C). A maximum of two moderators can be selected simultaneously by ticking the boxes in the list of variables. The resulting output will show the most suitable plot for the selected data type (i.e., a scatterplot for numeric moderators, grouped violin plots for factorial moderators, or scatterplot matrices if two moderators were set).
Figure 11 shows the violin plot for the data set “Sex differences in Psychopathy” after choosing the potential moderator variable “Scale type.” As noted in the codebook available in PsychArchives, this is a dummy-coded factor variable dividing the sample into studies using “composite measures” (i.e., truncated measures that assess composite scores for the dark triad as a whole by using subscales of Machiavellianism, narcissism, and psychopathy by using only a few items) and studies using “individual measures” (i.e., stand-alone measures for each dark-triad trait, usually consisting of a higher number of items per trait). Figure 11 shows the distribution of the effect sizes for each group (i.e., composite and individual studies). It highlights that both groups’ effect sizes are not merely concentrated around a specific value but are distributed further instead. Moreover, it suggests that effect sizes are slightly larger for studies assessing psychopathy with an individual scale than studies using the shorter, composite scales. Finally, the thin endings in both violin plots highlight the presence of outliers.

Violin plot with a selected moderator variable. The graph shows the probability density of the effect sizes for the studies using composite measures and studies using individual measures. N/A = studies with missing information regarding scale type.
Step 2: (re)running the meta-analysis
After familiarizing themselves with the data set and getting a descriptive, explorative picture of the underlying variables and outcomes, users proceed with the next step and reproduce the meta-analysis with the available CAMA data set directly in PsychOpen CAMA. All available meta-analytic tools are accessible via the tab “Analyses” in the menu bar. As before, users must choose a particular domain, data set, and effect size type they want to (re)analyze (Fig. 12, Box A). Furthermore, potential moderators from the same list of variables as in the step before can be chosen (Fig. 12, Box B).

Basic analysis tools in PsychOpen CAMA.
In this example again, we selected the data set “Sex differences in Psychopathy” and chose the standardized mean difference Hedges’s g as the effect size. We first wanted to explore the basic meta-analytic model. Therefore, we proceeded without selecting any moderator variables and ran the meta-analysis by clicking the blue button below, “Update View.”
The resulting output is depicted in Figure 12, Box C and shows the R output based on the R package metafor (Viechtbauer, 2010). To the right of the output, a brief guide for interpretation of the parameters in the meta-analytic results is shown.
The meta-analytic model
At the top of the output, (1) in Figure 12, information on the computed random-effects meta-analytic model (“RMA model”) is shown. In this model, 442 studies are included. To estimate between-studies variance,
The heterogeneity parameters
The next section, (2) in Figure 12, shows the essential heterogeneity parameters commonly used to interpret the amount of variation found in a meta-analysis. First, the “Test for Heterogeneity,” widely known as the Cochran Q test, indicates statistically significant heterogeneity and thus varying effect-size parameters in the meta-analytic sample, Q(441) = 3,153.581, p < .001. Above, the output shows the estimated between-studies variance (
The summary effect
Finally, the output, (3) in Figure 12, provides the overall summary estimate of the meta-analysis, the standard error, the significance test of the summary effect (i.e., z statistic and p value), and the corresponding 95% confidence interval. The meta-analysis of sex differences in psychopathy yielded a summary effect of g = 0.504 with a corresponding standard error of 0.013. This summary effect is significant (z = 37.99, p < .001); 95% confidence interval ranges from 0.478 to 0.530. Using the convention of Cohen (1992), it can be interpreted as a moderate effect in that overall, males showed, on average, higher levels of psychopathy than females. 6
Step 3: visualization of the meta-analytic results
In the next step, assume the user wants to visualize the previously reproduced meta-analytic summary effect. Therefore, PsychOpen CAMA provides a forest plot and a cumulative forest plot, directly available in the analysis section (Fig. 12, Box D).
Forest plot
By clicking the blue tab, “Forest plot,” above the analysis output, PsychOpen CAMA shows the forest plot, depicting the effect size of each study (alphabetically sorted) included in the selected CAMA data set and its corresponding confidence interval (Fig. 13, A). On the right side of the output, a brief guide for interpreting a forest plot is provided. With the checkbox above the interpretation, the user can switch to another variant of a forest plot, a rainforest plot (Fig. 13, B). Whereas the classical forest plot marks the effect size of each study and its corresponding confidence interval simply with a horizontal line, the rainforest plot improves this visualization by including individual weights and degree of uncertainty by heights, saturation, and shades of the data points, which look like raindrops (Kossmeier et al., 2020; Schild & Voracek, 2015). Dark blue, high, and round raindrops indicate studies with a higher weight in the selected data set. At the bottom of each forest plot, the summary effect of the selected CAMA and the corresponding confidence interval are shown.

Forest plot variants. Users can switch between (A) a classical forest plot and (B) a rainforest plot by ticking the checkbox on the right side of the plot.
The forest plot for the CAMA selected in this tutorial, “Sex differences in Psychopathy,” shows that a large part of included studies indicates a higher value for psychopathy in men, which is in line with the overall meta-analytic result. In addition, studies that showed outlying results or effect sizes in both directions are shown.
Cumulative forest plot
The cumulative forest plot is the second plot available to visualize the meta-analytic summary effect. The plot can be requested by selecting the third tab, “Cumulative Forest Plot,” in the function “Analyses.” It depicts the temporal progress of evidence within a specific data set by plotting all included studies chronologically. The effect-size estimates for each study display the summary effects, synthesizing all effect sizes up to the corresponding study. Again, an interpretation of the plot is provided on the right side of the output.
In the selected CAMA data set for “Sex differences in Psychopathy,” an increase in certainty (i.e., smaller confidence intervals) and a stabilization around the observed summary effect (Fig. 14) are shown.

Cumulative forest plot.
Step 4: considering moderators
The previous investigation of the summary effect in Step 4 revealed a substantial amount of between-studies heterogeneity within the meta-analytic model. Thus, considering variables as potential moderators of the overall effect seems reasonable. Therefore, a user can switch back to the R output of the meta-analysis by clicking the blue tab “RMA model” (Fig. 12, Box D).
All potential moderators that can be added to the meta-analytic model for this data set are available in the list on the right of the primary selection menu (Fig. 12, Box B). In PsychOpen CAMA, up to two potential moderators can be investigated simultaneously. The data set must be downloaded and used individually offline for more complex examinations with a higher number of moderators.
In the data set “Sex differences in Psychopathy,” initial visual inspection suggested that there could be a moderating influence on the effect sizes because of the scale type used in a study (see Step 1, data exploration). The visualization indicated that individual scales revealed larger effect sizes than composite scales in this data set. Thus, the user can include the variable “Scale type” as a moderator in a metaregression model by ticking the checkbox beside the variable name in the list and running the analysis by clicking “Update View.” Figure 15 displays the resulting R output of the metaregression. The headline of the output shows that a mixed-effects model has been computed, including 440 studies.

The output of the selected metaregression model.
The upper part of the output shows the remaining heterogeneity parameters after including the predictor variable “Scale type.” As in the basic meta-analytic model, the output displays the between-studies variance (
One can conclude that this single moderator is not enough to explain the high amount of heterogeneity within this meta-analysis. However, users must keep in mind that the moderator-analysis tools provided in PsychOpen CAMA are too superficial to draw valid conclusions and adequately explain heterogeneity within the meta-analytic model. For users interested in the explanation of heterogeneity, this CAMA data set can be downloaded and examined individually by applying more complex models with simultaneous consideration of more than two potential moderators.
Step 5: detecting possible publication bias
Users can now proceed with the examination of the presence of potential publication bias within this CAMA. PsychOpen CAMA provides various methods to detect publication bias: a funnel plot and Egger’s regression test estimate for funnel plot asymmetry (Egger et al., 1997), a contour-enhanced funnel plot (Peters et al., 2008), and p curve (Simonsohn et al., 2014a, 2014b). The tools are reached by clicking the “Publication bias” tab in the menu bar. First, the domain, data set, and effect size type of interest must be selected. Again, we chose the data set “Sex differences in Psychopathy” and the effect size “Hedges’ g” and clicked on “Update View.”
Funnel plot and Egger’s regression test
The first open tab presents the meta-analysis’s funnel plot (Fig. 16). On the right is a brief guide for interpretation of the funnel plot, including Egger’s regression test estimate marked in bold, which is statistically significant for this data set (z = 2.73, p = .0063), thus indicating a bias within this data set.

Funnel plot and Egger’s regression test estimate (Egger et al., 1997).
Contour-enhanced funnel plot
Users can switch to the next tab and explore the contour-enhanced funnel plot to examine this significant asymmetry further. In contrast to the classic funnel plot, this graph displays the null effect in the center and highlights the conventional significance levels (i.e., .1, .05, .01) at the edges of the funnel (Peters et al., 2008). Therefore, it facilitates further inspection and interpretation of various causes of funnel plot asymmetry.
The contour-enhanced funnel plot of the data set for “Sex differences in Psychopathy” (Fig. 17) indicates that most included studies showed significant sex differences in that males scored higher in trait-psychopathy assessments than females. In addition, fewer studies are located in the funnel’s central area (i.e., nonsignificant results), potentially indicating the preferred publication of significant results. However, users must keep in mind that this CAMA data set includes a substantial amount of unpublished data (k = 114), which implies that one cannot conclude whether the missing studies in the nonsignificant area are due to publication bias by using the full sample. Therefore, PsychOpen CAMA provides the option to create a funnel plot including only published studies by ticking the checkbox “Using peer-reviewed studies only” above the graph (Fig. 17, A). Thus, the user can visually compare the funnel plot including and excluding unpublished studies. Furthermore, additional in-depth investigations can be conducted individually by downloading the data set and applying further bias-detection methods (for an extensive overview of various methods, see Carter et al., 2019).

Contour-enhanced funnel plot (Peters et al., 2008).
P curve
The third tab in the publication bias tools allows users to examine the p curve of the selected data set. This plot includes only published studies with significant results from the sample and allows conclusions about the presence of p-hacking within the data (Simonsohn et al., 2014a, 2014b). In this case, a high number of p values would be right below p = .05 (i.e., a left-skewed curve). PsychOpen CAMA again offers a short description of the plot on the right side to facilitate interpretation. The p curve of the data set “Sex differences in Psychopathy” is right-skewed and indicates evidential value and no threat of p-hacking (k = 286 studies with p < .05; Fig. 18).

p curve (Simonsohn et al., 2014a, 2014b).
Step 6: using a CAMA for study planning
The last function provides a prospective power-analysis tool using the meta-analytic summary effect of a CAMA. Especially for users planning a new single study corresponding with the research questions of the selected CAMA, this could be a useful way to conduct power analyses and determine the appropriate sample size for the planned study.
Users can switch to the tool by clicking the “Study planning” tab in the menu bar. First, users must select the domain, the data set, and the effect-size type they would like to use for the prospective power analysis. Again, we chose “Personality psychology,” “Sex differences in Psychopathy,” and Hedges’s g for this example. In addition, we set the desired significance level (e.g., p = .05) and the aimed sample size (e.g., n = 80) and clicked on “Update View.”
The resulting plot visualizes the result of the prospective power analysis. The interpretation on the right side of the graph summarizes the results for this selection (Fig. 19). The black dot in the graph and the text segment beside indicate that a study with the selected sample size reaches a power of β = 88.7%. The colored lines in the graph mark the 95% confidence interval of the estimation because of the uncertainty of the estimated summary effect size in the meta-analysis. The gray dashed line provides the estimated sample size needed to achieve 80% power for the selected parameters (i.e., n = 63). All results and interpretations are available in the plot description on the right of the graph.

Prospective power analysis and study planning. The black dot indicates the power estimate for the sample size selected (β = 88.7%). The intersection of the gray dashed lines marks the sample size needed for a power of 80% (n = 63). Numeric results are summarized in the text segment right beside the graph.
Step 7: citing a CAMA of PsychOpen CAMA
A final remaining question for users and data providers concerns the reporting of CAMA data sets. The citation policy in PsychOpen CAMA is summarized in the last tab in the menu bar, “Terms of use” (Fig. 20). Generally, if a CAMA data set from PsychOpen CAMA is reported or presented elsewhere, the underlying data set and one of the publications on PsychOpen CAMA (e.g., Burgard et al., 2021, 2022) must be cited. As noted in Step 1, information on a particular data set is documented in the function “Data inspection,” including the citation information of a data set (American Psychological Association format) and its DOI, via the PsychArchives link (see Step 1; Fig. 9, Box A).

Information on terms of use.
Discussion
In the present tutorial, we introduced PsychOpen CAMA from a data-provider perspective and guided the reader through the provided functionalities using a large-scale meta-analytic data set as a working example. In the final sections, we summarize the major benefits of CAMAs, the remaining limitations, and prospects for PsychOpen CAMA in the near future.
Benefits and possibilities of CAMAs in PsychOpen CAMA
PsychOpen CAMA as a publication format for CAMAs in psychology has extensive benefits for the research community, both for users and contributors. For users, PsychOpen CAMA offers an easy-to-use GUI, including several tools to explore, (re)analyze, and use CAMAs interactively. Additional educational descriptions and explanations of basic meta-analytic parameters and methods allow usability also for users new to meta-analysis. The provided functions in the web application can be used to explore potentially relevant moderator variables and reveal research gaps within the included studies of a data set. Together with the integrated study-planning function for prospective power calculations, a CAMA allows conclusions about the status quo of a particular research field and enables the planning of specifications for new studies. Moreover, the transparent data sets of CAMAs can be downloaded, allowing users to explore different research questions and methodological variations. For example, the CAMA data sets on the dark triad of this tutorial can be used to examine other specifications in the growing research field of gender/sex differences in multivariate personality constructs (e.g., Eagly & Revelle, 2022). Finally, practitioners can use the up-to-date results for evidence-based practical decisions, especially when new evidence occurs rapidly and far-reaching practical implications are required urgently (e.g., Allotey et al., 2022; Stroehlein et al., 2021).
From the perspective of data providers, the main advantage of PsychOpen CAMA is that it is not limited to any domain and hosts meta-analyses with various outcomes (i.e., effect sizes). In addition, it yields substantial advantages in the organization of meta-analytic data. Although research planning, literature search, and data selection are still tasks that remain in the hands of researchers, the freely accessible data storage in PsychOpen CAMA helps maintain an overview of all data included. Consequently, continuous updates of existing CAMA data sets can be easily accomplished. In turn, using the available fundamental analysis tools directly in PsychOpen CAMA with new data allows for keeping track of changes in the overall summary effects of the different versions of a meta-analytic data set. Finally, initial data providers benefit from the ongoing citation of the CAMA data set whenever it is used further (see Step 7: Citing a CAMA in PsychOpen CAMA). In addition, for data contributors expanding an existing data set, it is a convenient way to share unpublished data within the research community and prevent its evidence from remaining unconsidered.
Remaining limitations and prospects of PsychOpen CAMA
The first remaining limitation from the perspective of a data provider and user concerns the dynamics of the data itself. For example, the data set used in this tutorial contains three variables whose contents are not static: (a) r_cites, including the total cites of a coded study; (b) r_past, displaying the years passed since publication; and (c) r_citesav, containing the average cites of each study, indicating a comparable value for citation density. Consequently, these three variables are dynamic because the number of citations of each study potentially increases every day. However, because coding eligible studies is still a manual task in CAMA, this variable is valid only until a particular cutoff date (i.e., the coding date). Thus, it needs to be updated along with the data set itself. A possible way for a data provider to keep these variables up-to-date is to plan fixed updates regularly (e.g., every 6 months). Most important is to keep the data set well documented in the metadata to ensure users are aware of the cutoff date.
The second limitation concerns the standardized analysis tools directly available in the web application. Although the GUI provides consistent, useful functions to explore and analyze the data directly, it is yet limited in its flexibility for users who might apply more complex analyses and different specifications in modeling (e.g., considering multiple moderator models or using subgroups of the meta-analytic sample). However, each CAMA data set is freely available for download and can be (re)used offline for in-depth analyses either way.
The technical status of PsychOpen CAMA
At the current developmental stage of PsychOpen CAMA, tasks such as data submission, validation, and implementation must be accomplished manually and require feedback loops and communicative efforts between a data provider and the CAMA team. Moreover, all initial steps of conducting a meta-analysis, such as literature search, eligibility assessment, and coding, are still entirely left to the researchers because it is developed and structured as a multiple-database framework.
Other existing CAMA systems already offer various solutions to facilitate workloads and reduce manual efforts. For example, there are initial approaches to automatize single tasks, such as literature search and data extraction, by using algorithms and reducing the workload for small research teams by crowdsourcing (Thomas et al., 2017). Furthermore, existing CAMA systems use data-validation tools, such as the data validator in MetaLab, to automatically check for content-related errors within the data structure of a newly submitted data set that potentially cause dysfunctionality if filled inconsistently (Gasparini, 2022). Other platforms, mostly single-database systems, use machine-readable data to allow flexible search queries within the data sets of a particular domain (e.g., Bosco et al., 2019; Spadaro et al., 2022).
In PsychOpen CAMA, administrative processes will also be automatized and improved stepwise to facilitate workflows and increase automatization, especially for standardized formats and tasks that are the same for every CAMA. The next improvement will be to process data submission via DataWiz (https://datawiz.leibniz-psychology.org/DataWiz/), an assistance system for data management provided by ZPID. This linkage is currently under development and is intended to facilitate the workflows of adding new CAMA data and reducing the efforts of validity checks for data providers. However, a certain proportion of human monitoring will still be necessary to ensure the correctness and validity of the data.
Summary
PsychOpen CAMA is a novel infrastructure developed by ZPID to realize up-to-date, living meta-analyses called “CAMAs.” It comprises a data repository, which is openly available to the research community via a web application. The research community can either share meta-analytic data as a whole and create a new CAMA or add new evidence (i.e., relevant outcomes of a single study or new moderator variables) into an existing CAMA data set. The GUI of PsychOpen CAMA enables users to explore and reproduce the results of a meta-analysis directly within the web application.
This tutorial serves as an introduction on implementing and using a CAMA in PsychOpen CAMA from a data-provider perspective using six large-scale meta-analytic data sets on the Dark Triad of personality as a working example. The functions available in the GUI are presented in seven interchangeable steps using the CAMA data set “Sex differences in Psychopathy.” A CAMA in PsychOpen CAMA can be used to get an up-to-date overview of a particular research field (i.e., overall effects, relevant moderators, and potential distorting effects by publication bias) and to use the results for study planning (e.g., prospective power analyses). Moreover, it provides all data for download, thus enabling further individual examinations. Finally, the tutorial summarized the main advantages and limitations for users and contributors and highlighted the future technical developments to improve the usability and flexibility of the GUI. PsychOpen CAMA as an openly available infrastructure for sharing, using, and expanding CAMAs in all fields of psychology joins a novel direction for reproducible, replicable, and long-living meta-analyses.
Supplemental Material
sj-pdf-1-amp-10.1177_25152459231197611 – Supplemental material for Keeping Meta-Analyses Alive and Well: A Tutorial on Implementing and Using Community-Augmented Meta-Analyses in PsychOpen CAMA
Supplemental material, sj-pdf-1-amp-10.1177_25152459231197611 for Keeping Meta-Analyses Alive and Well: A Tutorial on Implementing and Using Community-Augmented Meta-Analyses in PsychOpen CAMA by Lisa Bucher, Tanja Burgard, Ulrich S. Tran, Gerhard M. Prinz, Michael Bosnjak and Martin Voracek in Advances in Methods and Practices in Psychological Science
Footnotes
Transparency
Action Editor: Pamela Davis-Kean
Editor: David A. Sbarra
Author Contribution(s)
Notes
References
Supplementary Material
Please find the following supplemental material available below.
For Open Access articles published under a Creative Commons License, all supplemental material carries the same license as the article it is associated with.
For non-Open Access articles published, all supplemental material carries a non-exclusive license, and permission requests for re-use of supplemental material or any part of supplemental material shall be sent directly to the copyright owner as specified in the copyright notice associated with the article.