
Abstract
Mobile sensing is a promising method that allows researchers to directly observe human social behavior in daily life using people’s mobile phones. To date, limited knowledge exists on how well mobile sensing can assess the quantity and quality of social interactions. We therefore examined the agreement among experience sampling, day reconstruction, and mobile sensing in the assessment of multiple aspects of daily social interactions (i.e., face-to-face interactions, calls, and text messages) and the possible unique access to social interactions that each method has. Over 2 days, 320 smartphone users (51% female, age range = 18–80, M = 39.53 years) answered up to 20 experience-sampling questionnaires about their social behavior and reconstructed their days in a daily diary. Meanwhile, face-to-face and smartphone-mediated social interactions were assessed with mobile sensing. The results showed some agreement between measurements of face-to-face interactions and high agreement between measurements of smartphone-mediated interactions. Still, a large number of social interactions were captured by only one of the methods, and the quality of social interactions is still difficult to capture with mobile sensing. We discuss limitations and the unique benefits of day reconstruction, experience sampling, and mobile sensing for assessing social behavior in daily life.
Social interactions are the building blocks of social relationships and are fundamental to well-being (Back et al., 2011; Baumeister & Leary, 1995). Accordingly, many researchers are interested in when and for how long people interact with others and how social interactions affect well-being in everyday life (Krämer et al., 2022; Kroencke et al., 2023; Sun et al., 2019). Research on social interactions in daily life has traditionally relied on daily diaries (Nezlek, 2001), such as the day-reconstruction method (DRM; Srivastava et al., 2008), or experience-sampling assessments (ESM; i.e., repeated short questionnaires administered in daily life; e.g., Hall, 2017). Both daily diaries and experience sampling require effort from the participants in answering questions repeatedly, and thus these methods constrain the study duration and the time resolution of the measurement (Wrzus & Neubauer, 2023). Furthermore, both methods are prone to memory biases, a problem that is aggravated for daily diaries because of the greater temporal distance between assessment and occurrence of the reported behavior (Lucas et al., 2021).
Because of the obtrusiveness and biases of both methods, researchers seek for alternatives, and mobile sensing (MS) promises some solutions (Harari et al., 2016; Miller, 2012). “Mobile sensing” refers to measurement methods in daily life that use the sensors of a mobile device (e.g., smartphones, smartwatches) to acquire data from the person handling the device or from the environment (for a detailed discussion of challenges and advantages of MS, see Harari et al., 2016). Smartphones, which have spread rapidly among large parts of the world’s population (Newzoo, 2021), are currently used most often for MS.
MS with smartphones offers important advantages compared with self-reports. First, sensor measurements decouple the number of assessments from participant burden (Wrzus & Neubauer, 2023), enabling longer assessments with higher time resolution. Second, MS offers access to more objective data than self-reports and thus promises to reduce memory biases (e.g., forgotten interactions) and report biases (e.g., socially desirable responses, demand effects). Third, MS allows automatic event-triggered sampling, that is, presenting questions in response to sensed information (e.g., self-report questions after a call was detected). 1 Last, smartphone usage, for example, of communication apps, may also be assessed and is of great interest for psychological research and beyond (Aharony et al., 2011; Kroencke et al., 2023; Stachl et al., 2020).
Accordingly, MS promises to overcome many drawbacks of self-report methods. Still, interpreting the results of MS studies remains challenging because the quality of the sensed data is largely unknown and researchers mainly assume that MS works accurately. Earlier research compared emotional experiences measured with ESM and DRM (Lucas et al., 2021), yet MS of social interactions has not yet been compared with either ESM or DRM using a comprehensive database. Furthermore, standard practices for gathering, analyzing, and reporting MS data are largely missing (Bähr et al., 2022), and the reliability and validity of sensor data are mostly unknown (Struminskaya et al., 2020).
The Present Study
In a multilaboratory collaboration, we assessed social interactions in daily life with three methods, that is, day reconstruction, experience sampling, and MS, to compare similarities and differences of the methods. Specifically, we examined the temporal overlap between methods, the agreement of the methods, and unique aspects of social interactions that each method captures. Accordingly, we did not regard any of the methods as a “gold standard” and assumed that each method captures unique aspects in addition to shared information on social interactions. For social interactions, we focused on face-to-face interactions, calls, and text messages and posed two research questions:
Research Question 1: How similar are assessments of social interaction quantity and quality using ESM, DRM, and MS?
For a just comparison of the methods, Research Question 1 examines the conditional agreement between methods, that is, how methods compare if they collected data at the same time (i.e., when matched measurements were available for the compared methods). As a prerequisite, we first needed to assess the temporal overlap in measurement coverage between the methods, which also provides information for our second research question:
Research Question 2: What differences exist between the methods, and which social interactions do certain methods overlook?
In general, we expected the agreement between DRM and MS to be lower than the agreement between ESM and MS because of the greater time delay and increased memory biases of DRM compared with ESM and MS. We further expected DRM and ESM to agree more on face-to-face interactions than DRM and MS or ESM and MS because of a closer alignment of operationalizations (e.g., social interactions assessed in DRM and MS may include periods without conversation) and because of technical challenges of MS, such as accurately identifying speakers (e.g., the participant or a surrounding group of people) and filtering out background noise (Hebbar et al., 2021). Accordingly, we derived the following hypotheses:
Hypothesis 1: Regarding the occurrence of face-to-face interactions, we expected higher agreement between the measurements of DRM and ESM than between both methods and MS.
Hypothesis 2: Regarding the occurrence and duration of calls, we expected ESM and MS to show higher agreement than DRM and MS.
Hypothesis 3: We expected ESM and MS to agree more than DRM and MS regarding the interaction partner and valence of calls. 2
Hypothesis 4: Compared with MS (i.e., smartphone logs of messages), people underestimate the number of sent messages in subjective reports (i.e., in ESM). 3
Method
Data collection took part in Germany from September 2021 to mid-December 2021 and from March 2022 to April 2022. We paused study enrollment between January and March 2022 because of increased COVID-19 infections and associated governmental regulations on social events (see Appendix A at https://osf.io/82mu6). Overall, no broad restrictions on everyday social interactions were present during the study period. The preregistration, deviations from the preregistration, documentation of assessed variables, anonymized data sets, preprocessing and data-analysis scripts, and a list of all used software packages are available at https://osf.io/t4c6n/.
We report how we determined our sample size, all data exclusions, all manipulations, and all measures in the study. The raw data cannot be shared publicly because of privacy issues and related data-protection laws. Anyone interested in access to the raw data for research purposes can contact Y. Roos. The study adhered to the principles of the Declaration of Helsinki for research involving human subjects and was given Institutional Review Board approval by Johannes Gutenberg University Mainz (process number: 2018-JGU-psychEK-002).
Participants
Because the majority of previous MS studies contained highly selective samples of well-educated young adults, we deliberately aimed at an age- and gender-heterogeneous sample of 207 to 374 participants (see preregistration for sample-size rationale and power analyses). Thus, we chose appropriate countrywide recruitment strategies such as online advertisements, email lists, flyers, news articles, and word of mouth. The diverse countrywide sample allows a broader generalization of the results, especially given that social interactions differ with age and gender (Sander et al., 2017; Wrzus et al., 2013).
Overall, 320 participants took part in the study, of which 51% identified as female, 48% identified as male, and 1% identified as neither male nor female in terms of their gender identity (e.g., nonbinary). On average, participants were 39.53 years old; 28% were 18 to 30, 24% were 30 to 39, 23% were 40 to 49, and 25% were 50 to 80. Most participants were in a stable romantic relationship (60%), 33% were single, and 8% were divorced; 34% of participants had children. Regarding education, 47% of participants had completed college or university, 34% of participants had completed high school, 17% had completed other schools, and 1% had not yet completed their school education. Regarding occupation, 36% of the participants were working full-time, 32% were students, 15% were working part-time, 9% were retired, and the remaining participants were unemployed or did not indicate their occupational status.
Procedure and measures
The study started for all participants on a Thursday with a video call. Participants received information about the study, gave informed consent, and installed the PhoneStudy research app (Schoedel et al., 2023). 4 Participants answered a baseline questionnaire on their demographics, personality traits, and social network. Over the next 2 days (Friday and Saturday, to capture both workdays and weekends), participants were prompted by the app to answer 10 ESM questionnaires per day between 9:00 a.m. and 9:00 p.m. The prompts were delivered roughly every 80 min to avoid participants knowing exactly when the next assessment would occur (for details see Appendix B at https://osf.io/82mu6). In addition, on Saturday and Sunday mornings, participants received an email reminder to fill out day-reconstruction questionnaires on their computer regarding Friday and Saturday, respectively (Kahneman et al., 2004). MS ran continuously in the background on participants’ phones until Sunday (Fig. 1). We chose this assessment schedule to assess as many social interactions in daily life as possible while keeping participant burden acceptable, especially regarding the number of ESM and DRM reports. Participants received €40 (≈$40) for study participation with the option to receive another €10 if they filled out 17 or more ESM questionnaires out of 20.

Study procedure. DRM = day-reconstruction method; ESM = experience-sampling method.
ESM
Participants reported whether they were in a social interaction at the time of measurement or had had other social interactions (i.e., face-to-face, calls/video calls) since the last assessment. Participants were instructed that being around other people without any direct interaction (e.g., in a waiting room) does not count as face-to-face interaction. For each reported interaction, participants indicated the duration on a scroll wheel (answer options: 5 min, 10 min, 15 min, and 30 min, followed by steps of 30 min until 24 hr), the kind of relationship (e.g., partner, friend), and how they experienced the interaction (using a 7-point rating scale that ranged from 1 = unpleasant to 7 = pleasant). In addition, participants indicated with a slider how many text messages they had sent since the last measurement (range = 1–100 messages, increased sensitivity in the lower range).
DRM
Participants divided their previous day into episodes consisting of activities with a start and an end time (Kahneman et al., 2004). For each activity, participants indicated the location, whom they spent the activity with, and how pleasant they perceived the activity on a scale that ranged from 1 = unpleasant to 7 = pleasant (adapted from Anusic et al., 2017). The online questionnaire initially displayed one episode and allowed participants to add up to 25 episodes to their diary, which proved sufficient in previous studies (Anusic et al., 2017). Episodes with activities that were conducted together with other people (except “calling,” “occupation with computer or internet,” and “end of day”) were used as indicators of face-to-face interactions, and episodes with “calling” were used as indicators for calls. Short calls (e.g., < 15 min) might be less likely to be listed in day-reconstruction diaries because participants were instructed that most people report episodes with durations between 15 min and 2 hr (for a distribution of DRM episode duration, see Appendix D at https://osf.io/82mu6).
MS and event-triggered sampling
In MS, a privacy-protective algorithm inferred whether conversation or noise predominated in ambient sound (AWARE-Conversations plug-in; Ferreira & Mulukutla, 2020). The algorithm was programmed to follow a cycle of 1-min sampling and 3-min pause. In practice, differences in the number of samplings per episode occurred on different smartphone models (for the distribution of AWARE-Conversations samplings, see Appendix E at https://osf.io/82mu6). For each episode (in ESM or in DRM) with five or more samplings, we calculated the proportion of detected conversation as an indicator of face-to-face interactions. The proportion of conversation was calculated as the number of samplings indicating conversation divided by the total number of MS samplings in the respective episode.
Furthermore, information on incoming and outgoing calls was extracted from usage logs of the smartphones’ native call function. Whenever MS detected a call that lasted 10 s or longer, a short questionnaire (available for 15 min) was triggered, asking for the type of interaction partner and the perceived valence of the call using the same answering options as for ESM and DRM. Last, metadata on smartphone keyboard use (e.g., number of outgoing text messages) were collected in the form of time-stamped texting events (Bemmann & Buschek, 2020). We included only messages that were typed in communication apps (which includes SMS and emails sent from the phone; for the app-categorization scheme, see Schoedel et al., 2022) and excluded messages that were typed into search or navigation text fields.
Analytical approach
We differentiate between (a) aggregated agreement, that is, agreement between the methods when indicators were aggregated across all periods in which each individual method collected data, and (b) conditional agreement, that is, agreement between methods if the methods collected data at the same time. For aggregated agreement, Pearson correlations between the aggregated measures were calculated. To examine conditional agreement, the different sampling rates of the raw data from the three methods had to be aligned first. For example, for each ESM questionnaire, all MS data since the previous ESM questionnaire were matched. 5 The details of the matching procedures for face-to-face interactions, calls, and text messages are described in Appendix F (see https://osf.io/82mu6). Temporal overlap between measurements of face-to-face interactions and text messages was calculated by the sum of the duration of matched episodes (see Fig. 2b and Figs. 3b and 3d). Contrary to face-to-face interactions and text messages, calls could be matched one-by-one; accordingly, we present overlap between the methods for calls as the number of calls that were assessed by multiple methods (Fig. 3c).

Schematic data structure for 1 day of one example participant. DRM = day-reconstruction method; ESM = experience-sampling method; MS = mobile sensing; FTF = face-to-face interactions. (a) Social interactions of the example participant were measured with three methods, and there were some gaps in the covered time span of each method. Whereas some social interactions were picked up by all three methods (see the three phone icons across the lines), other interactions were documented in only one or two methods (see the single phone icon). (b) Euler diagram of the temporal overlap in coverage of face-to-face interactions for the example participant. The size of the ellipses is proportional to the time covered with each method, and the size of the intersections is proportional to the temporal overlap between methods. In this example, DRM covered 13.33 hr, ESM covered 10.67 hr (i.e., 8 × 80 min), and MS covered 21.33 hr. The temporal overlap of all three methods (intersection of all three ellipses) in this example was 9.67 hr.

Data availability and temporal overlap for day reconstruction, experience sampling, and mobile sensing. DRM = day-reconstruction method; ESM = experience-sampling method; MS = mobile sensing; FTF = face-to-face interactions. (a) Face-to-face data availability averaged across participants who had at least some data on all three methods. (b) Temporal overlap in coverage of face-to-face measurements. The areas of the ellipses are proportional to the average coverage of the methods depicted in Fig. 3a. On average, there were 13.96 hr of temporal overlap between DRM, ESM, and MS. (c) Overlap in call occurence between the methods. On average, 0.08 calls per person were matched between all three methods, and 0.6 calls per person could be matched between ESM and MS. (d) Temporal overlap in the covered time span of text-message measurements. On average, measurements of ESM and MS overlapped 19.52 hr. Note that participants differed considerably in their data availability.
After preprocessing, the data consisted of matched ESM episodes, matched DRM episodes, or matched calls clustered at the person level. For conditional agreement of continuous variables (i.e., duration and valence), multilevel correlations (rml) were calculated using the R-package correlation (Version 0.8.2; Makowski et al., 2022). Multilevel correlations are a special case of partial correlations in which the grouping variable is included as a random effect in a mixed model and are appropriate because they consider the nested data structure. We further included Bland-Altman plots in the supplement on OSF to provide additional information on whether the methods showed systematic over- or underestimation when compared with each other (Appendix G at https://osf.io/82mu6). For categorical variables (i.e., relationship type of interaction partner), percentage agreement was calculated, that is, the number of matched observations indicating the same relationship type divided by the total number of matched observations.
Results
Previous MS studies often did not report the percentage of the intended sampling period during which data were unavailable. Yet such reports provide information central to the generalizability of the results and—in the context of the current study—on differences between measurement methods. For each type of social interaction—that is, face-to-face interactions, calls, and text messages—we first report the data availability and temporal overlap between the methods and then present results on the conditional agreement of the methods, which are based on the overlapping data segments. An illustration of the data structure is presented in Figure 2.
Data collection lasted for 2 days (i.e., 48 hr). We aimed at measuring as many social interactions as possible with each method, but some design choices restricted the covered time: To reduce participant burden, ESM questionnaires were distributed only between 9:00 a.m. and 9:00 p.m., amounting to a maximum covered time of about 26 hr per participant. 6 DRM was limited to the time from when participants got up until they went to bed, with the maximum total time actually covered being about 30 hr on average (48 hr – sleep; M = 8.9 of self-reported hours of sleep per day). MS was set to sample continuously for 48 hr, but technical issues and participant behaviors led to reduced coverage, especially for face-to-face interactions (Fig. 3a).
Face-to-face interactions
The average time covered with each method was calculated on the basis of participants who had at least one valid data point on face-to-face interactions in each method (n = 256; Fig. 3b). 7
Across both assessment days, participants reported, on average, 9.74 DRM episodes they spent with other people, which lasted, on average, 86.30 min per DRM episode. In ESM, participants reported, on average, 9.38 episodes with at least one face-to-face interaction, with an average of 40.52 min of face-to-face interactions. In MS, an average of 8.85 ESM episodes containing conversations were recorded, with the average proportion of conversation being 0.24 (which could be interpreted, very cautiously, as an average of 19.20 min per ESM episode).
Differences in interaction duration between methods may, to a considerable degree, result from different operationalizations: Whereas participants chose the duration of DRM episodes themselves, ESM episodes were about 80 min long by design. Therefore, it is possible that interactions reported in DRM as one episode were divided across multiple ESM episodes. Furthermore, DRM likely indicated more time spent in interaction because contrary to ESM, participants did not specify how long they interacted with others during an episode but reported only whether the episode as a whole was spent with or without someone. In contrast, MS likely underestimated interaction duration because only conversation was measured, yet social interactions may also include periods without constant conversation, such as watching a movie or having dinner together.
For examining conditional agreement between DRM and MS (Hypothesis 1), we aggregated MS on the level of DRM episodes. The duration of interactions reported in DRM showed a small but substantial association with the proportion of conversation measured with MS (rml = .20; 95% confidence interval [CI] = [.17, .23]). Next, DRM and MS were transformed to match the level of ESM episodes (see Appendix F at https://osf.io/82mu6). As predicted, the association between self-reported duration of interactions in ESM and DRM was stronger (rml = .51; 95% CI = [.48, .53]) than the association between self-reported duration in ESM and proportion of conversation detected through MS, which was again small but still substantial (rml = .24; 95% CI = [.20, .27]). 8 For a comparison of the methods using Bland-Altman plots (Bland & Altman, 1999), please see Appendix G (Panels A, D, and G) at https://osf.io/82mu6.
Calls
Overall, 279 participants had at least one valid data point in DRM, ESM, and MS of app activities including calls. 9 Across the 2 days, these participants reported, on average, 0.42 calls in DRM and 1.57 (video) calls in ESM. In MS, an average of 3.61 calls were recorded, but only 24% of these calls were 5 min or longer (0.86 calls). The aggregated number of calls for each participant correlated between DRM and ESM (r = .27, 95% CI = [.16, .38]), between DRM and MS (r = .19, 95% CI = [.08, .30]), and between ESM and MS (r = .37, 95% CI = [.26, .46]). 10
Because the exact time of calls was reported in neither DRM nor ESM, calls were matched using either liberal criteria (i.e., call occurred in the same period; Fig. 3c) or strict criteria (i.e., excluding calls with substantial deviations in duration, interaction partner, and valence; see Appendix F at https://osf.io/82mu6). The conditional agreement of methods regarding call duration, valence, and relationship type is shown in Table 1. The correlational patterns partly supported Hypothesis 2 (i.e., fewer calls could be matched between DRM and MS than between ESM and MS). Participants reported a considerable number of calls in ESM that were not recorded in MS. This might be because people used other devices (e.g., their landline phone or computer) or used third-party apps to conduct video calls. Only a few calls were reported in DRM—yet contrary to Hypothesis 3, regarding these matched calls, conditional agreement was high. Bland-Altman plots for a comparison of the methods are provided in Appendix G (Panels B, C, E, F, H, and I; Bland & Altman, 1999) at https://osf.io/82mu6.
Conditional Agreement of DRM, ESM, and MS Regarding Duration, Valence, and Type of Relationship of Calls
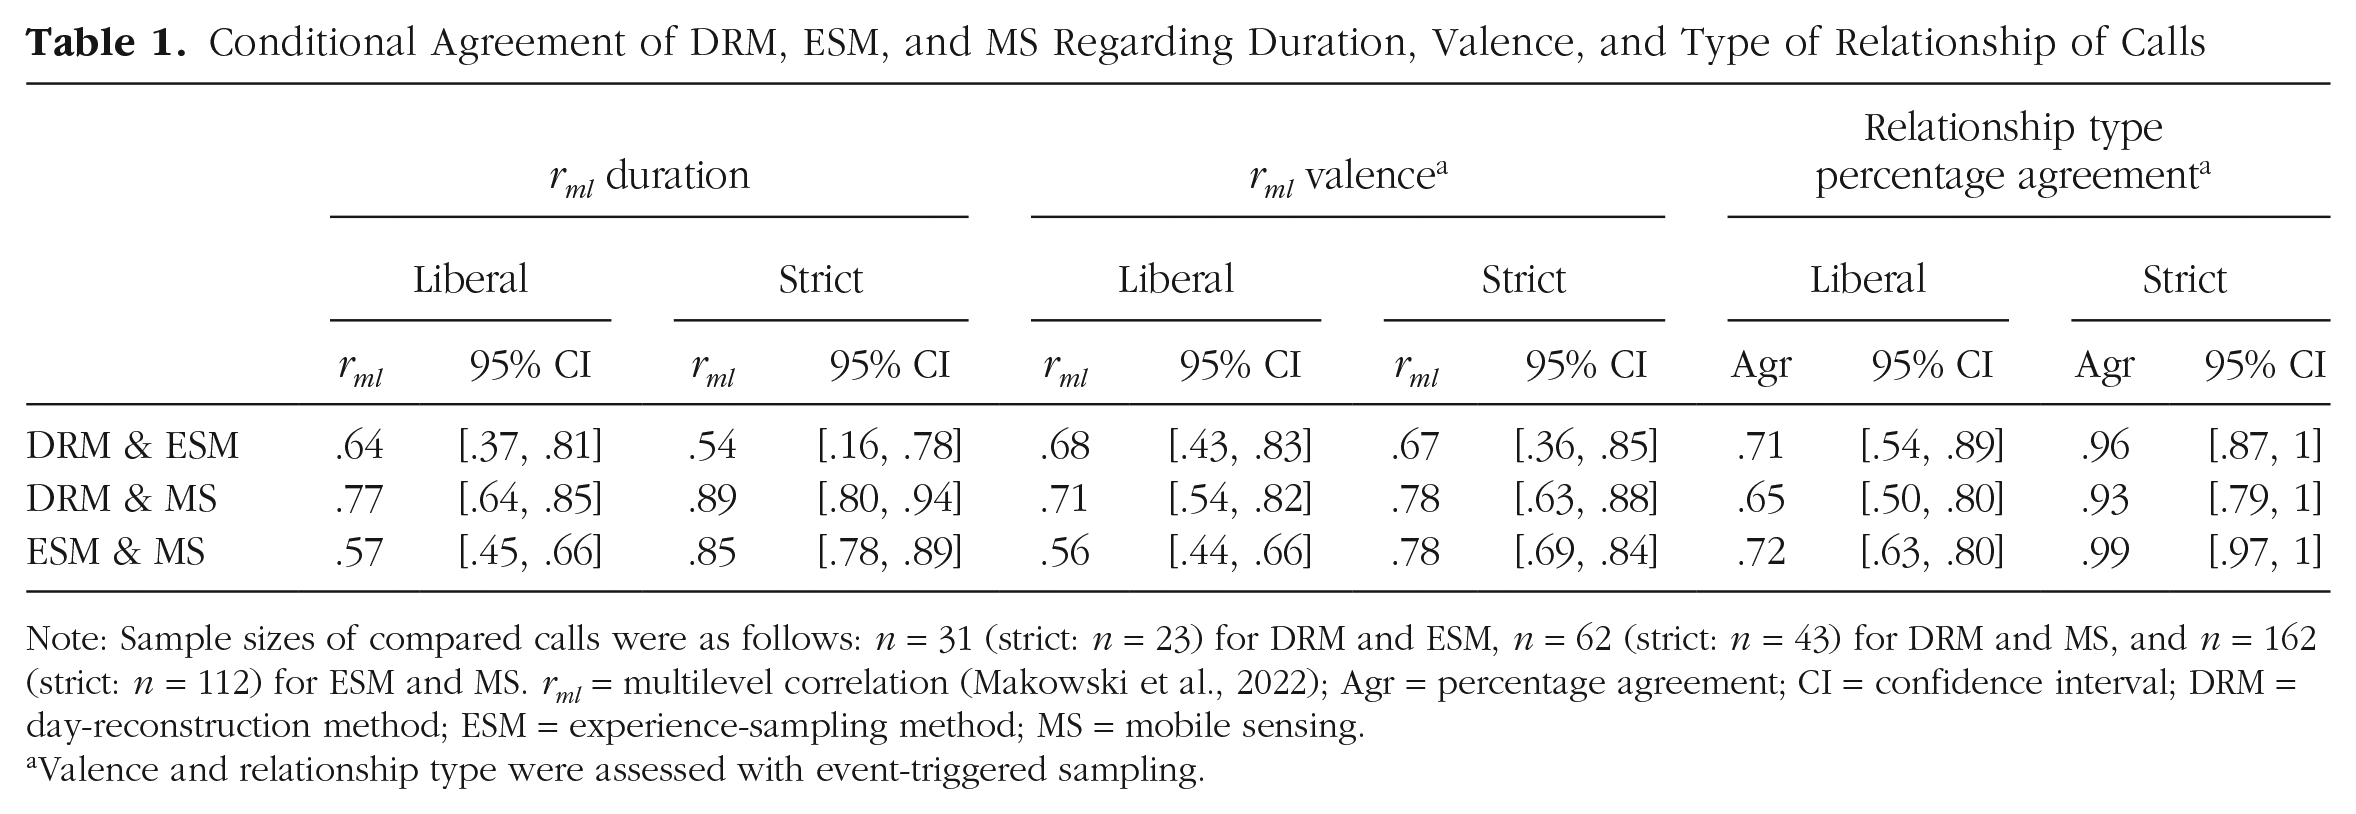
Note: Sample sizes of compared calls were as follows: n = 31 (strict: n = 23) for DRM and ESM, n = 62 (strict: n = 43) for DRM and MS, and n = 162 (strict: n = 112) for ESM and MS. rml = multilevel correlation (Makowski et al., 2022); Agr = percentage agreement; CI = confidence interval; DRM = day-reconstruction method; ESM = experience-sampling method; MS = mobile sensing.
Valence and relationship type were assessed with event-triggered sampling.
Text messages
The following results refer to 250 participants for whom at least one message was recorded in MS and in ESM (Fig. 3d). 11 For these participants, MS recorded more outgoing messages (on average, 33.63 messages across 2 days) than participants reported in ESM (23.81 messages), t(457) = 3.18, p = .002, supporting Hypothesis 4. This is likely because ESM covered a shorter time span than MS. Accordingly, the number of recorded messages did not differ if MS was restricted to episodes for which ESM data were available (22.93 messages), t(495) = 0.32, p > .05, indicating that participants neither generally over- nor underreported sent messages in ESM. In 25% of ESM episodes, participants reported sending out more text messages in ESM than recorded by MS (on average, 3.03 messages more), and in 23% of ESM episodes, participants reported fewer messages than measured with MS (average underestimation in ESM was 3.02 messages). A comparison of ESM and MS regarding the number of sent messages in each episode yielded a correlation of rml = .43, 95% CI = [.40, .46].
General Discussion
Researchers have increasingly called for examining social processes in daily life, such as the dynamic regulation of social behavior (Back et al., 2011; Hall, 2017). Yet measurements of daily social interactions using traditional self-report methods (i.e., diaries or experience sampling) are affected by self-report biases and limited in their comprehensiveness and time resolution because of participant burden (Lucas et al., 2021; Wrzus & Neubauer, 2023). Smartphone sensing was promised to overcome these drawbacks of self-report measures and to become the “gold standard” for many areas of psychological research—up to the point of substituting most questionnaire research (e.g., Miller, 2012). However, 10 years after Miller’s (2012) influential smartphone psychology manifesto, knowledge on the quality of sensor data is still largely missing (Struminskaya et al., 2020), and standard practices for gathering, analyzing, and reporting MS data are just emerging (Bähr et al., 2022; Harari et al., in press; Wrzus & Schoedel, in press).
In a multilaboratory collaboration, we compared the temporal overlap of DRM, ESM, and MS measurements and their conditional agreement on different aspects of social behavior in people’s daily life. In contrast to many previous studies using MS, we recruited a large age- and gender-heterogeneous sample, which increases the generalizability of our findings. The following discussion examines comparisons between the methods from the perspective of MS because it currently is the least established method for measuring social interactions in daily life. Yet these comparisons equally contribute to a better understanding of ESM and DRM. We argue that at present, neither method is necessarily superior, and each can provide unique advantages and insights into different aspects of daily social interactions.
Regarding face-to-face interactions, MS showed some agreement with questionnaire reports of social interactions in daily life, but the methods were far from being interchangeable. This might in part be due to technical limitations of the used MS algorithm: Although the algorithm achieved high accuracies of more than 85% in prior studies (Lane et al., 2012; Rabbi et al., 2011), the algorithm’s accuracy in less controlled environments is probably lower, as indicated by the size of agreement with DRM and ESM in the current study. In the future, researchers will likely have access to more sophisticated algorithms—for example, first evidence suggests that algorithms based on a distinction of foreground versus background sound might outperform more traditional voice-detection algorithms (Hebbar et al., 2021).
Regarding calls, data from the three methods were matched on a call-to-call basis, which provided valuable new insights: Only a subset of calls could be matched between the methods (with DRM performing worst, likely because only longer calls were reported). This suggests that each method captured only a fraction of daily calling behaviors, depending on the duration of calls and which device or app was used (e.g., video calls through computers or messaging apps vs. mobile phones’ native call function). However, for calls that could be matched (i.e., occurred in the same period), conditional agreement between methods was high. This finding indicates that different aspects of calling behavior, such as duration, valence, and the relationship type of the interaction partner, can be measured well (although not comprehensively) with ESM and with MS.
Regarding text messages, in ESM, participants neither generally over- nor underestimated the number of messages they had sent in the last 80 min compared with the MS measurement. This is contrary to estimates of daily messaging, which seem to be more biased (Boase & Ling, 2013). Yet MS allowed a more comprehensive measurement regarding both the covered time span and the ability to measure multiple aspects of texting (e.g., length of message or use of emotion words).
Limitations
Despite the unique contribution of the study, which compared the assessment of both quantity and quality of daily social interactions with MS, ESM, and DRM in a large age- and gender-heterogeneous sample, several limitations became apparent. Some limitations of the methods reported in our study may not be inherent to the methods themselves but may be a consequence of the specific software and design choices applied in this study. Using DRM, ESM, and MS concurrently in participants’ daily lives necessitates restrictions on the study design. For example, whereas passive MS could be conducted 24 hr a day for several weeks or even months (Aharony et al., 2011), ESM and DRM cannot assess participant reports continuously or intensively for long periods because the repeated questionnaires would soon overburden participants (Wrzus & Neubauer, 2023). Despite this design limitation, our study provides first benchmarks on how measurements of social interactions from DRM, ESM, and MS compare with each other. These benchmarks can be built on in future studies with time frames longer than 2 days and different design choices (e.g., different ESM schedules or other conversation-detection algorithms). Finally, future meta-analyses may try to distinguish between specific limitations of the methods that are due to certain design choices and limitations that are largely independent of design choices.
One important limitation independent of the study design is that the quality of the social interaction and the type of interaction partner (e.g., romantic partner, colleague) cannot yet be inferred from passive MS alone. In general, MS focuses on assessing the physical reality of a certain situation or behavior (e.g., volume or pitch of a human voice), and self-reports often aim at the psychological reality, such as the occurrence or quality of social interactions (Mehl, 2017; Rauthmann et al., 2015). Although developments in automatic speaker detection and onboard processing of voice and spoken content might provide MS indicators (e.g., voice tone) for the psychological reality (e.g., social-interaction quality), more theoretical and empirical work is needed on how to interpret rather technical MS indicators.
Although we aimed at including a countrywide sample that was diverse in age, gender, and educational background, the current sample of Android users is prone to coverage and self-selection biases that are present in many MS studies (Keusch et al., 2019). For example, ownership of a smartphone and the kind of smartphone (e.g., iOS) differs somewhat with sociodemographic variables such as age, educational background, and community size. However, only minor differences in personality traits have been found between users of different operating systems (Götz et al., 2017; Keusch et al., 2023).
Issues of the participant-sampling process have been thoroughly discussed during the past few years (Keusch et al., 2023; Struminskaya et al., 2020), yet fewer discussions have focused on how representative the sampled contexts and behaviors are (Fiedler & Juslin, 2005; Yarkoni, 2022). MS showed only moderate agreement with self-report assessments of face-to-face interactions. In addition, in line with the argument that smartphone measurements are restricted to capturing what is happening on and in close proximity to the device (Harari et al., 2016; Keusch et al., 2022), MS probably missed some face-to-face interactions and also calls conducted through other platforms or devices. Likewise, DRM and ESM were also limited in their sampling of behaviors, for example, in underreporting of short interactions and calls, and because of the limited time span covered.
Recommendations
In addition to establishing standard procedures for MS studies (for suggestions, see Harari et al., 2016, in press), we believe that more transparent reporting is key to advance research using MS. For example, most previous MS studies did not report for which percentage of the intended sampling period data were unavailable, for example, because phones were turned off or other apps interfered with MS sampling. Errors in MS studies can have multiple reasons: Total error frameworks (e.g., Bosch & Revilla, 2022; Groves & Lyberg, 2010) differentiate between specification errors (i.e., MS indicators do not correspond to a sufficient degree with the target construct), measurement errors (e.g., technical errors), and processing errors (e.g., inappropriate coding or aggregation procedures during data preprocessing). We recommend transparent reporting of all available information that helps in assessing the magnitude of these errors, which will contribute to more replicable findings (Wrzus & Schoedel, in press).
Specifically, regarding specification errors, we suggest the following minimal reporting requirements: (a) Define the target construct as clearly as possible. For example, in the case of social interactions, we recommend to specify whether the target behavior is face-to-face interactions, calling, or texting behavior, and we additionally recommend to specify the time frame to which results can be generalized (e.g., only daytime behaviors, only weekday behaviors, all social behaviors at any time). (b) Define the periods in which sensors are supposed to measure indicators for the target construct. (c) Define the minimum number of data points required to consider a period a valid indicator for the target construct. 12 (d) Report how the validly measured periods compare with the targeted periods. (e) Discuss how the sampled indicators relate to the target construct, for example, by including a Constraints on Generality statement (Simons et al., 2017). These reporting requirements rely on minimal assumptions regarding different causes of errors and can be applied even in studies in which the technology or study design hinder a more fine-grained differentiation of error sources.
Measurement errors may arise because of technical difficulties (e.g., MS apps being incompatible with the operating system, interference through other apps, or energy optimization stopping MS apps) as well as participant behavior (e.g., not carrying the phone, revoking permissions; see Keusch et al., 2022). Whenever feasible, we recommend a differentiated approach for reporting different kinds of measurement errors, for example, as suggested by Bähr et al. (2022). Yet MS researchers face serious challenges. First, research software running on participants’ smartphones cannot be tested under all field conditions, such as the multitude of devices and conflicting apps. Second, privacy concerns may require researchers to process some kinds of data—such as audio in our study—directly on participants’ smartphones without any storage of the raw data (for more discussion on the topic of privacy in MS studies, see Kargl et al., 2019; Wrzus & Schoedel, 2023). Correspondingly, researchers often have to assume causes for errors without direct insight from the raw data into the causes of these errors. Considering that the field of MS research is still trying to find a balance between rigor and practicability, we believe conducting research with imperfect apps and iteratively improving methods during the process may be more feasible than having too-high expectations of MS apps to be able to perfectly differentiate between different sources of measurement errors.
Regarding processing errors, we encourage researchers to report the used procedures in detail (e.g., in supplements), to upload annotated preprocessing code, and to participate in initiatives that try to standardize preprocessing of sensor measurements (e.g., Vega et al., 2021; Wrzus & Schoedel, 2023).
Conclusion
MS indeed offers some solutions to the shortcomings of self-report methods, for example, allowing for a more comprehensive time span of measurement and reducing memory biases. However, MS comes with some biases itself, such as sample selectivity and limited access to behaviors that happen at a distance from the smartphone as measurement device.
We believe that gathering more knowledge and practical experiences with MS will greatly benefit psychology and the behavioral sciences in general (Harari et al., 2016; Struminskaya et al., 2020). At present, the suitability of MS to answer substantial questions largely depends on the kind of question and the sensors used. In our use case—social interactions—using MS to capture different aspects of smartphone-mediated interactions already seems very promising, whereas methods to measure face-to-face interactions, especially their quality, need more refinement. Further research on the validity of sensor measurements is needed to assist researchers in their decisions about the suitability of the chosen methods for their research question.
Footnotes
Acknowledgements
We thank the PhoneStudy team for making this research possible. Special thanks go to Florian Bemmann for technical support during the study. In addition, we thank all involved student assistants for their help with recruitment and conducting the online introductory sessions.
Transparency
Action Editor: David A. Sbarra
Editor: David A. Sbarra
Author Contribution(s)