
Abstract
When running statistical tests, researchers can commit a Type II error, that is, fail to reject the null hypothesis when it is false. To diminish the probability of committing a Type II error (β), statistical power must be augmented. Typically, this is done by increasing sample size, as more participants provide more power. When the estimated effect size is small, however, the sample size required to achieve sufficient statistical power can be prohibitive. To alleviate this lack of power, a common practice is to measure participants multiple times under the same condition. Here, we show how to estimate statistical power by taking into account the benefit of such replicated measures. To that end, two additional parameters are required: the correlation between the multiple measures within a given condition and the number of times the measure is replicated. An analysis of a sample of 15 studies (total of 298 participants and 38,404 measurements) suggests that in simple cognitive tasks, the correlation between multiple measures is approximately .14. Although multiple measurements increase statistical power, this effect is not linear, but reaches a plateau past 20 to 50 replications (depending on the correlation). Hence, multiple measurements do not replace the added population representativeness provided by additional participants.
A frequent objective of an experiment is to test the effect of one or more independent variables on one or more dependent variables. Statistical tests or confidence intervals can be used for this purpose. In null-hypothesis significance testing, for example, a researcher may calculate the probability (p) of extreme samples that differ between conditions, assuming that the conditions are equal in the population. This p value is helpful to determine whether the variability observed in the data is due to random variations or to other causes, which become more plausible when p is very small.
The probability that a small p value is found depends on only one factor: the separation between the sampling distribution of the true effect and the sampling distribution under the hypothesis tested (often a null hypothesis; Cumming, 2014; Hung, O’Neill, Bauer, & Köhne, 1997; Lazzeroni, Lu, & Belitskaya-Lévy, 2014). This separation can be expressed using what is called a noncentrality parameter (Chartier & Allaire, 2007; Cousineau & Laurencelle, 2011; Goulet-Pelletier & Cousineau, 2018; Hélie, 2007; Lal Saxena & Alam, 1982). Alternatively, it can be expressed using statistical power.
Statistical power is a concept taken from the work of Neyman and Pearson (1933). They proposed selecting a critical p value prior to the statistical test. If the observed p value is greater than this decision threshold, the experimenter concludes that the independent variable has no significant effect on the dependent variable; if it is less than this decision threshold, the experimenter concludes that the independent variable has an effect significant enough not to be due to randomness. It is conventional to use .05 as a decision threshold (but see Benjamin et al., 2018, and Trafimow et al., 2018). This decision threshold, conventionally called α, corresponds to the Type I error rate: the probability of rejecting the null hypothesis when it is true. The corollary to the existence of this critical p value is the existence of another type of decision error, the Type II error (whose probability is quantified as β). Unlike α, the Type II error rate is not chosen directly, because it is a function of α, the sample size, and the population effect size. A small β is obtained when there is a large α, a large sample size, or a large effect size. Because researchers have control over the number of participants in their experiments, the easiest option to reduce β is to increase the sample size.
In a seminal publication, Cohen (1992) calculated the required sample size for many statistical tests and different levels of effect sizes to obtain a recommended statistical power (1 – β) of .80 (also see Cohen, 1969, 1977). The research community realized that to detect small effect sizes, the required sample size can be quite large (e.g., more than 300 participants for analyses of variance, ANOVAs, with three groups). Because this requirement is immense in some areas of experimental psychology, a large number of studies lack adequate statistical power (Sedlmeier & Gigerenzer, 1989). With the emergence of software to calculate the required sample size given an expected effect size (e.g., G*Power; Faul, Erdfelder, Lang, & Buchner, 2007), statistical power in psychological experiments should have increased. However, the situation remains unchanged: Most studies still lack sufficient statistical power (Abraham & Russell, 2008; Button et al., 2013). Even in fields in which effect sizes are reasonably large, such as neuropsychology, the median power is estimated to be below .50 (Bezeau & Graves, 2001).
Statistical power is calculated under the assumption that the measurement is performed once per participant for every condition of an experiment. However, in some areas of psychology, it is conventional to measure participants in each condition multiple times. This method is sometimes referred to as subsampling. Questionnaires, for example, are developed with the objective of regrouping items to quantify different specific psychological constructs. To that end, participants are measured multiple times to increase the reliability of the measure. That said, doubling the number of items does not mean that the questionnaire (and the construct it measures) is twice as valid; the resulting validity is somewhere between 1 and 2 times what it was originally. This attenuation in validity is caused by the measurement covariance across multiple items. Schmidt and Hunter (2015) proposed a post hoc correction to account for this attenuation.
Similarly, in some other areas of psychology (e.g., single-measure paradigms, such as response times experiments), participants may perform multiple trials under the same condition (Rouder & Haaf, 2018). Whereas multiple items are used in questionnaires mainly to increase the reliability of measures and the validity of constructs, there are several reasons for replication in single-measure paradigms. First, if answers can be right or wrong, erroneous answers are often removed under the assumption that they do not adequately reflect the process under investigation. Second, if on some trials participants produce responses whose magnitude is most probably caused by lapses or distraction, these outlying responses are sometimes removed as well. Without replications, there would frequently be empty cells, which complicate data analysis. Third, if measurements were taken only once, the experiment might last only a few minutes, and it would be difficult to attract participants to a controlled environment. Finally, replicating measurement yields a more precise estimate of true performance. As a consequence, statistical power is improved. This last reason is the focus of the present article.
How do replications affect statistical power? If one assumes that there is no measurement covariance, one could argue that when participants are measured twice, the sample size required to achieve a target level of power is halved. Indeed, increasing the reliability of the measure using subsampling reduces the observed variance within each participant. 1 However, this argument ignores the fact that a given participant’s measurements within a condition are correlated: The stronger the correlation is, the less one learns from subsequent measurements.
In this article, we demonstrate how to assess the benefit to statistical power when participants in each condition are measured multiple times. The objective is to extend the work of Cohen (1992) by taking subsampling into account and to help researchers attain adequate statistical power with realistic sample sizes. In the first section, we show how to take subsampling into account using two parameters: the number of measurement replications, m, and the correlation across replications, r. The first step in our approach is to determine the number of participants needed to reach a target level of power without replicated measures. This number is then altered according to the values of these two parameters. The result is the number of participants needed to reach the target level of power with replicated measures.
In the second section, we roughly estimate the magnitude of r in simple cognitive tasks by analyzing data from 15 experiments that used replications. In the third section, we propose recommendations to help researchers adjust the power of their experiments properly. We conclude with general comments.
Correlation Across Replications and Its Effects on Power
In its simplest form, the correlation across replications is just the average Pearson correlation between all the pairs of measures. However, missing and erroneous data can be obstacles to computing the Pearson correlation, and we therefore review three additional methods to estimate the correlation across replications in Appendix A. To evaluate the impact of correlation across replications on statistical power, we first examine two extreme scenarios. We then show that the general case is a linear interpolation of these limiting scenarios.
First scenario: no correlation across replications
In this scenario, the intuitive argument proposed in the introduction is very close to exact: Doubling the number of measurements can be accompanied by halving the number of participants with no loss of statistical power. Consider, for example, the power of a one-group two-tailed t test. Its statistical power (1 – β) is given by
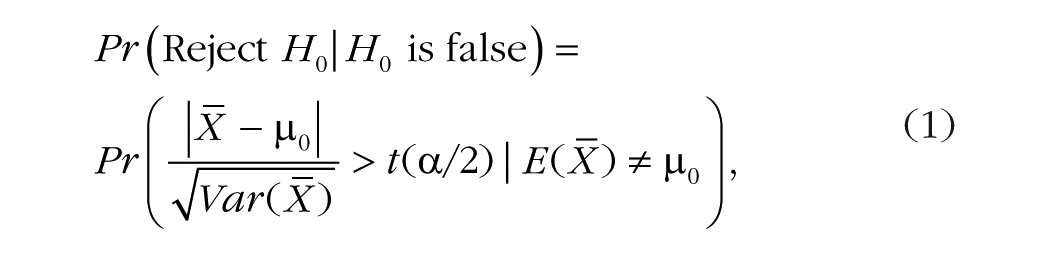
where H0 is the null hypothesis,

To introduce replicated measures in Equation 1, let us use m to denote the number of measurements made and nm to denote the number of participants in the sample with replications. The formula for the power of a two-tailed t test is as follows:
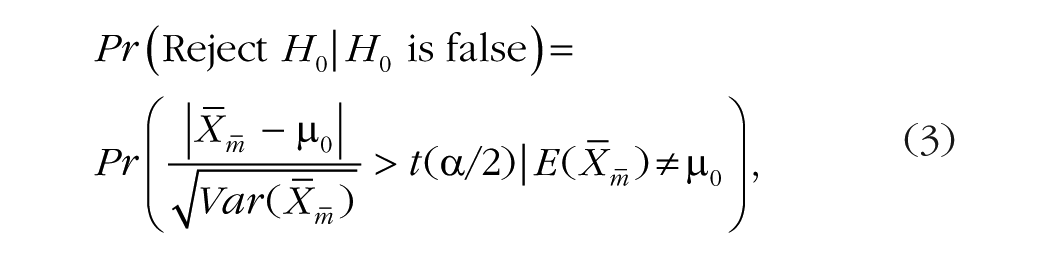
where

Given that the numerators in Equations 1 and 3 are the same, statistical power will be the same in these equations when the denominators are equal. Consequently, for a single-measure design and a design with replications to have the same power, (n1 – 1) must be equated to m(nm – 1). Hence, when r = 0, the following equation can be used to calculate how many participants measured with replications will provide the same power as a given number of participants measured once:

For example, in the absence of correlation across replications, the statistical power obtained by measuring 100 participants once per condition is the same as the power obtained by measuring 51 participants twice (more precisely, the number is 50.5 participants, which is rounded up). For a more striking example, consider that measuring 250 participants once per condition has the same statistical power as measuring 26 participants 10 times per condition (nm is equal to 25.9, which is again rounded up).
The same result can be derived from the following linear model:


where µ is the population grand mean, i is the subject number (i = 1, . . . , nm), j is the replication number ( j = 1, . . . , m), and ε ij is random error added to each measurement. In this model, the variance of the means across replications is σ2/m, and the corrected-for-bias variance of the grand mean is σ2/((nm – 1)m).
This first scenario is highly unrealistic because it assumes that each measurement is independent within and between participants. The next scenario is also highly improbable.
Second scenario: perfect correlation across replications
In this scenario, a perfect correlation between measurements is assumed: Regardless of the number of replications, a participant’s performance is always the same. Consequently, only one measurement per participant is necessary to obtain data with maximum reliability. Therefore,

In other words, the only source of variation is between participants, and adding replications to the experimental design in this scenario is a waste of time and effort. In this scenario, statistical power after measuring 250 participants once per condition is the same as statistical power after measuring 250 participants any number of times per condition.
The second scenario can also be derived from the following linear model:


in which α j is the participant’s deviation from the population grand mean, µ. The unbiased variance of the grand mean is τ2/(nm – 1).
General case: some correlation across replications
Even though the two extreme scenarios just presented are unlikely to occur, they illustrate boundary solutions. As we show next, the general solution is a linear interpolation between these two scenarios based on r. For instance, when r = .5, nm corresponds to the midpoint of Equations 4a and 4b. This demonstration requires the standard error of the mean when 0 ≤ r ≤ 1. It has been shown (Hansen, Hurwitz, & Bershad, 1961; Krotki, 1978) that the variance of the mean of correlated items having the same variance is given by the following equation:
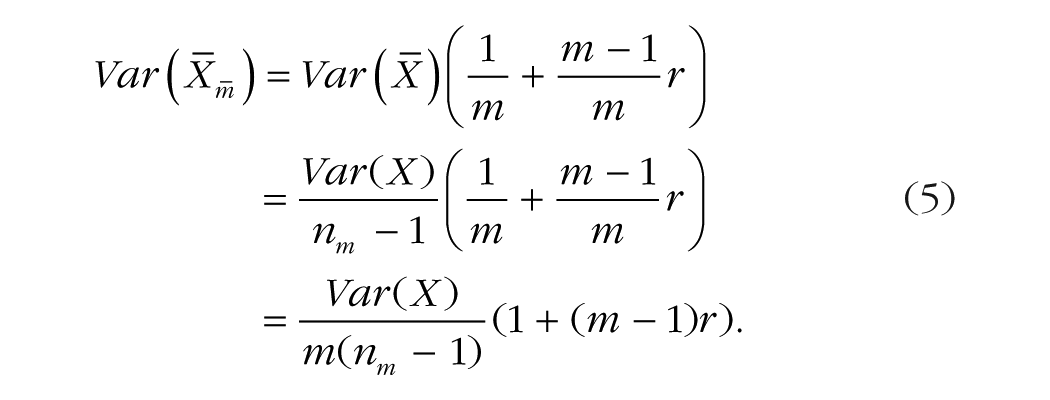
By equating the variance of the means in the absence and in the presence of replications (Equations 2 and 5, respectively), we can measure the impact of r and m on the sample size assuming replicated measures nm:

Solving for nm, we get
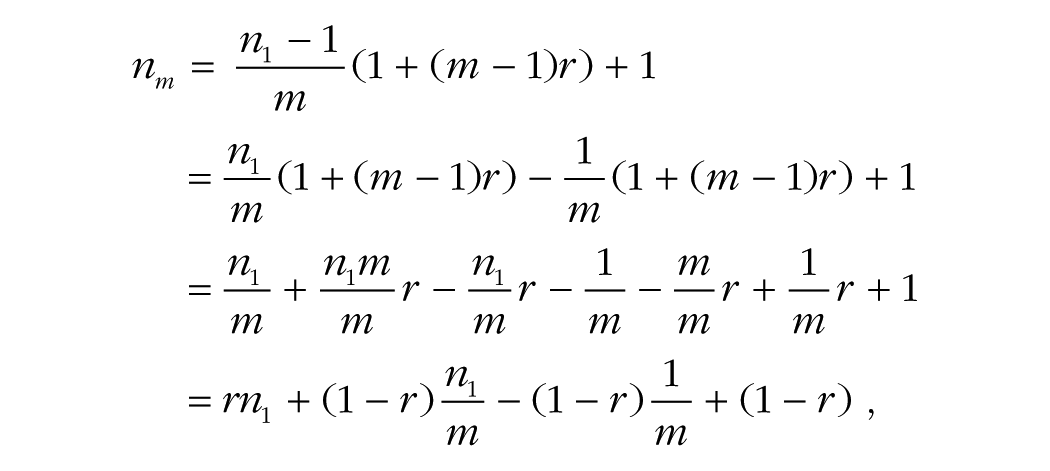
which, when simplified, is clearly a linear interpolation of the equations for calculating the values of n1 and nm that provide equal power in the first two scenarios:
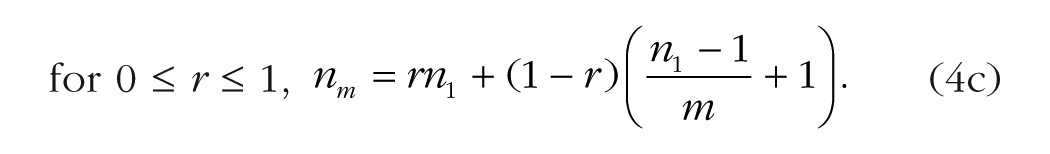
For example, if the correlation across replications is .33, the statistical power obtained from measuring 250 participants once per condition is the same as the statistical power obtained from measuring 100 participants 10 times per condition (after rounding up). By using the mean squared error instead of
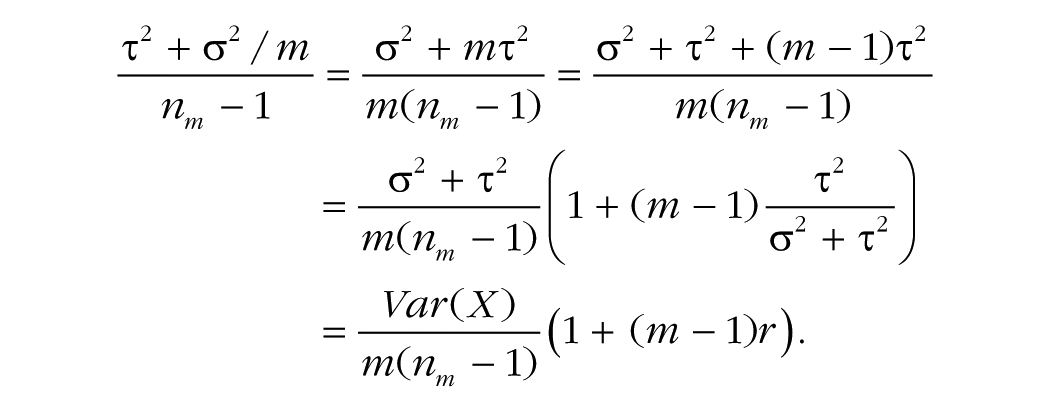
To model this situation, let

where α j and ε ij are defined as previously. The variance of the raw data, Var(X), is τ2 + σ2, and the variance of the means across replications is τ2 + σ2/m, so that the unbiased variance of the population grand mean is (τ2 + σ2/m)/(nm – 1). Because r can be estimated with τ2/(σ2 + τ2) (Appendix A), we easily derive Hansen et al.’s (1961) result:
Overview of Correlations Across Replications in 15 Studies
To perform an a priori power analysis in a study with replications, an estimate of the effect size and an estimate of the correlation across replications must be obtained. Although effect sizes are often reported in empirical studies, or at least can be calculated using the reported descriptive statistics, correlation across replications is not reported in many single-measure studies.
In other areas of psychology, the correlation across replications is more commonly reported. In a review of educational achievement, Hedges and Hedberg (2007) found a correlation value around .2 when all the surveys were included; when the scores were restricted to more homogeneous subpopulations (e.g., those with low socioeconomic status), the correlation was lower, at around .1. Murray and Blistein (2003) found a higher typical correlation, near .3, in their review of medical research and studies of health-related outcomes, whereas in a review of national health surveys, Gulliford, Ukoumunne, and Chinn (1999) reported a low correlation (as low as .01) when clusters were states, but a higher correlation (about .3) when clusters were at the level of households.
For studies involving questionnaires, researchers can use the reported reliability measures (e.g., Cronbach’s alpha) to estimate the correlation across replications (e.g., by using Equation A1 from Appendix A). However, for studies using a single measure, reliability must be computed from the raw data. Although making raw data publicly available is now encouraged by the majority of journals, this practice is still marginal in experimental psychology (Alsheikh-Ali, Qureshi, Al-Mallah, & Ioannidis, 2011; Wicherts, Borsboom, Kats, & Molenaar, 2006).
To estimate the correlation across replications for single-measure paradigms, we obtained the raw data from 15 simple cognitive experiments that used subsampling in their methodology. Some of these experiments were run by teams of which we were members (Boutet, Lemieux, Goulet, & Collin, 2017: 2 experiments; Cousineau & Shiffrin, 2004: 1 experiment; Goulet, 2015: 2 experiments). The data from 9 experiments were obtained after we contacted the authors (Brisson & Jolicoeur, 2007; Carrasco, Ponte, Rechea, & Sampedro, 1998; Fifić, Townsend, & Eidels, 2008; Lacroix, Giguère, & Larochelle, 2005; Miller, 2006; Palmeri, 1997; Reder & Ritter, 1992; Rickard, 1997; Strayer & Kramer, 1994). Finally, the data from 1 experiment were obtained from a Web repository (Visual Attention Lab, 2015).
These studies varied in sample size (nm) from 4 (Fifić et al., 2008; Palmeri, 1997) to 58 (Lacroix et al., 2005), and the number of replications (m) varied from only 2 (Lacroix et al., 2005) to 700 (Strayer & Kramer, 1994; see Table 1). Using the method of Shrout and Fleiss (1979) described in Appendix A (Equation A3), we estimated the correlation across replications. The results are shown in Table 1. On average, the correlation was .14. From the number of replications and the actual number of participants, we computed the number of participants measured once that would have provided the same statistical power by inverting Equation 4c:

Summary of the Analysis of Experiments in Cognitive Psychology
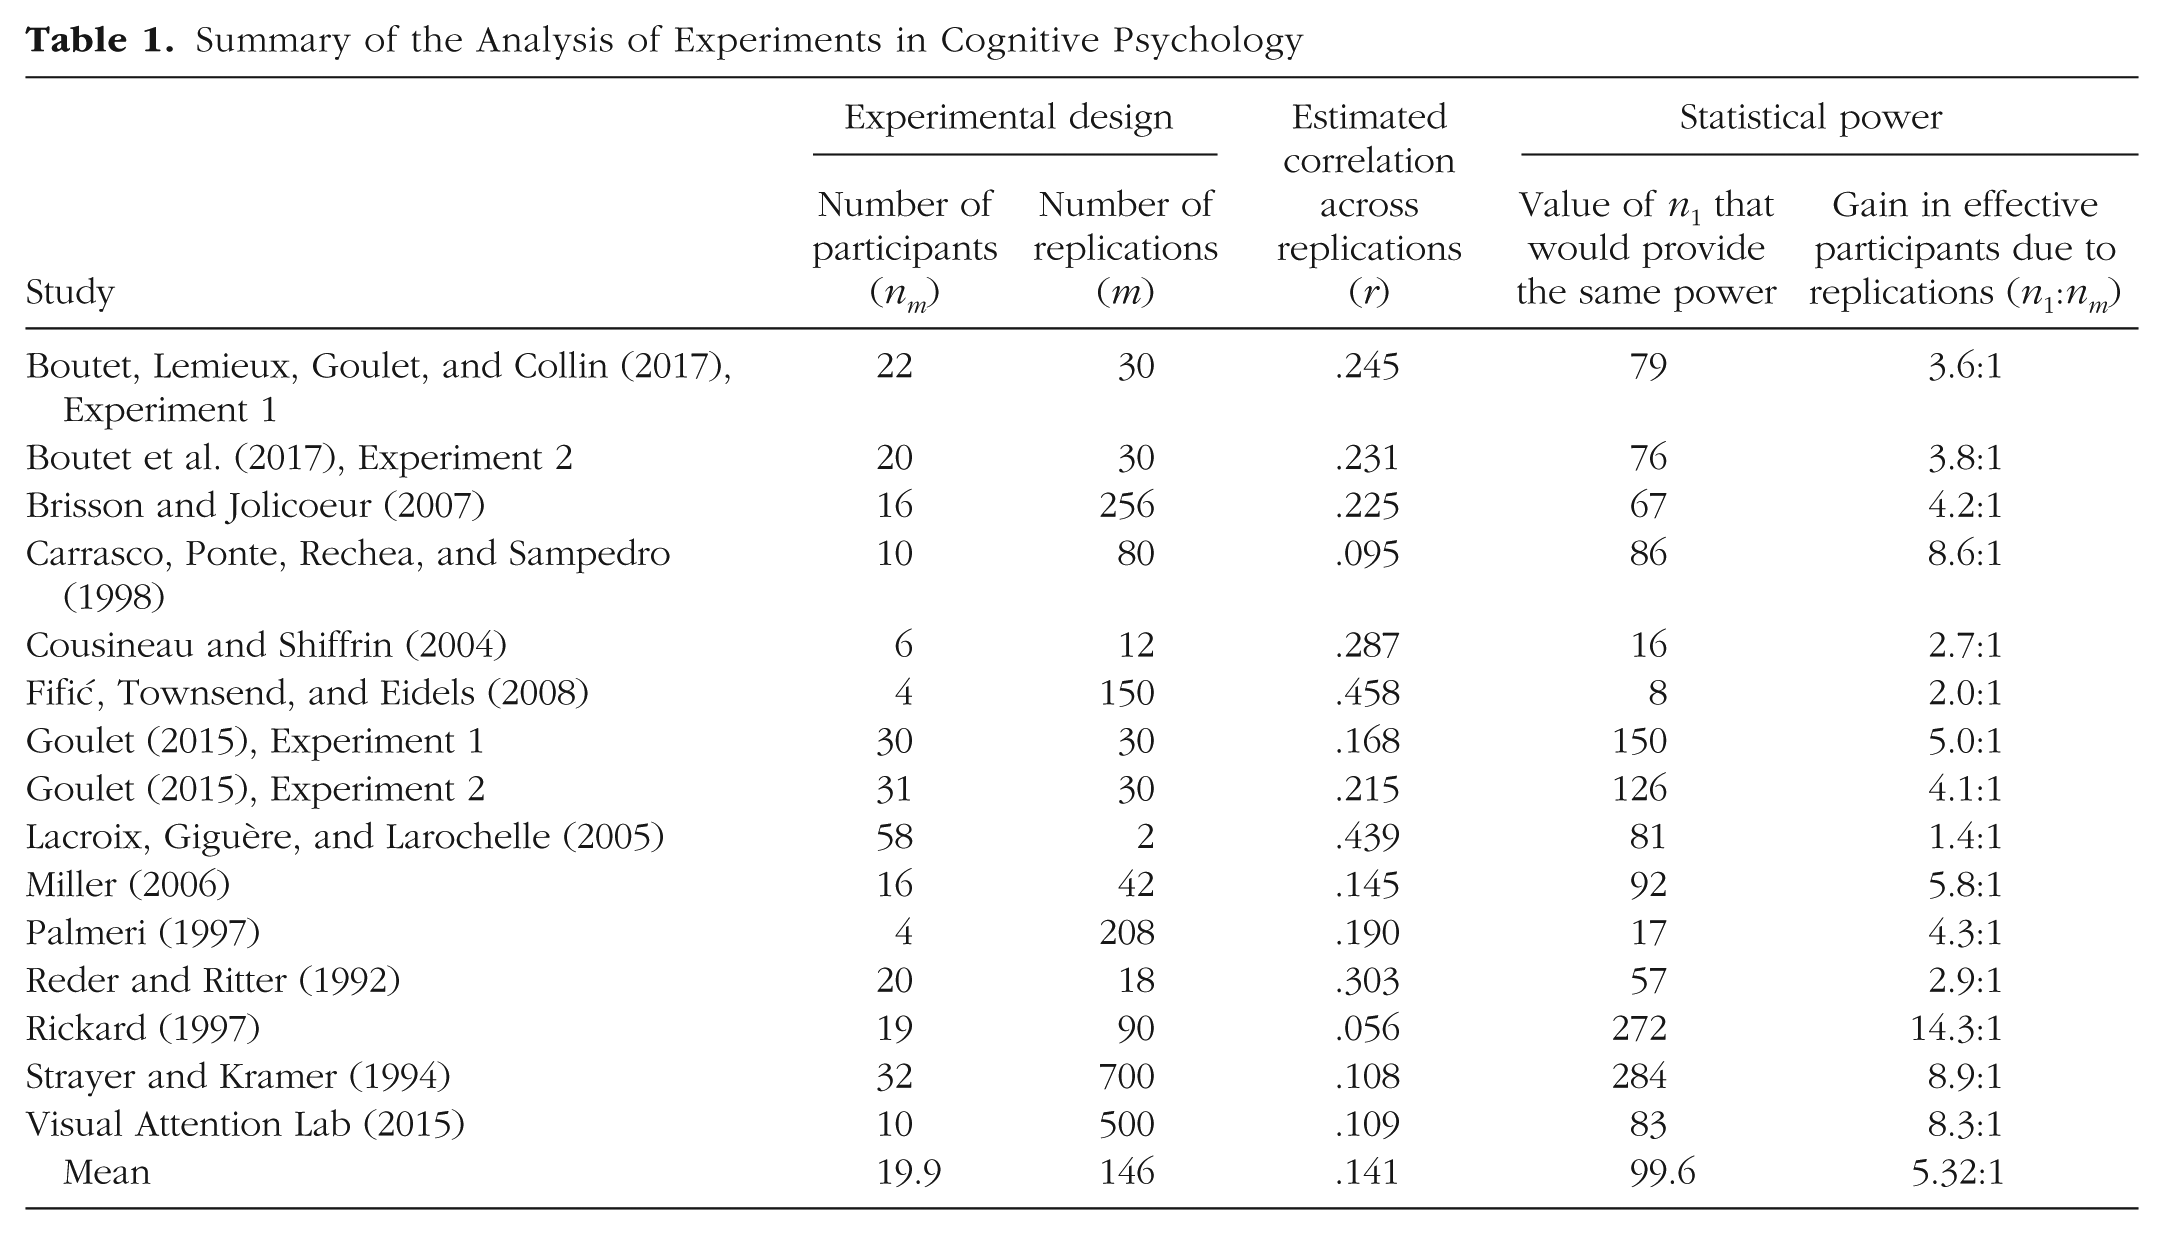
Although these experiments had on average 20 participants (19.9, to be precise), they had the statistical power of experiments with an average of 5 times that number of participants if replications are taken into account (nm = 99.6, on average; see Table 1).
To further illustrate the gain in statistical power, we computed for each study the ratio of participants that this gain represented (n1:nm). The gain in effective participants ranged from 1.4:1 (Lacroix et al., 2005) to 14.3:1 (Rickard, 1997); the average gain was just a little over 5:1 (see Table 1). In other words, measuring participants with replications rather than a single time resulted in a 5-fold increase in the experiments’ ability to detect effects.
Because standard errors are often proportional to the square root of the number of participants, increasing the number of effective participants by, say, 4 divides the effect size that can be detected by 2 (i.e.,
We estimated that without replications, the average Cohen’s d to afford a statistical power of 80% in these studies would have been fairly large, ranging from 0.37 to 2.13, with a mean of 0.92. If the effects investigated had been of average size (d ≈ 0.5), then clearly these experiments would have been very much underpowered without replications. With replications, however, they had 80% power to detect effects of medium size, because dividing 0.92 by 2.2 yields about 0.42, which is just below Cohen’s (1992) definition of a medium-sized effect.
In the extreme case, replications improved the effective number of participants by a factor of 14. In that experiment (Rickard, 1997), the correlation across replications was estimated to be low, so that each measurement was only slightly redundant with the others, a most desirable situation.
Although the average correlation across replications, .14, might not seem large, this value is close to what would typically be considered an indication of reliable data, given the number of replications. By inverting Equation A1, we can use this correlation to calculate Cronbach’s alpha:

When a variable has a correlation of .14 across replications and the number of replications is 146, Cronbach’s alpha is .96, which is considered highly reliable.
Recommendations
These results suggest that researchers should estimate the correlation across replications in their studies. In order to plan statistical power, the following steps can be used:
If the researcher has access to the raw data from previous studies, the correlation across replications can be estimated using one of the methods described in Appendix A.
If the researcher does not have access to raw data, pilot studies can be conducted, and the correlation across replications can be computed using the same method.
As a last resort, the researcher can estimate the correlation to be .14. However, we strongly encourage further research on this issue, as the correlation across replications might be affected by many sources of variation, such as experimental conditions, the nature of the task, and whether trials are blocked or in a random order.
When there are multiple conditions in an experiment, we recommend computing the average correlation across all conditions. In the case of unbalanced designs, we recommend using the smallest number of replications (m) in these computations, to ensure a conservative measure of the desired nm.
Whereas it is typical for reliability measures to be reported for studies involving questionnaires, reliability is almost never reported for single-measure paradigms. We invite researchers to report the correlation across replications more frequently. This measure not only affects statistical power but also can influence the length of error bars.
A potential problem can emerge when researchers are planning to follow the fairly common practice of eliminating from analysis trials on which the obtained measure is unrealistic (outliers) or the response is erroneous. This can result in a data set with fewer replications than planned for, and thus statistical power that is smaller than desired. To alleviate this problem, researchers can use previous data to estimate the number of trials that will be removed in each condition and add this number to the planned number of measurements. For example, if previous data show that about 1% of trials per condition are removed as outliers and that errors occur on about 8% of trials, a researcher planning on replicating a measure 20 times might instead replicate the measure 22 times (20 plus 9% of 20).
General Discussion
We have shown precisely how statistical power is increased by measuring participants multiple times under the same condition. Figure 1 summarizes the potential gain in participants by plotting the n1:nm ratio as a function of the number of replications (m), the measurement correlation (r) and the number of recruited participants (nm). The code used to generate this figure is provided in Box 1. The curves in the figure rapidly reach plateaus (at around 20 to 50 replications) after which very little gain is achieved with additional replications. The number of replications required to reach the asymptotic gain in effective participants (and, consequently, in power) varies as a function of the correlation across replications. When this correlation is high (i.e., little variability between trials is observed), the gain in statistical power is small even if the measure is replicated multiple times (Rouder & Haaf, 2018). However, as we mentioned earlier, the correlation across replications in cognitive tasks seems to be a little below .20. The asymptote for a .20 correlation is reached with approximately 20 replications (providing a ratio of about 4:1). In other words, when the correlation across replications is .20, a researcher would need 4 times fewer participants to reach a desired statistical power if participants are measured 20 times in the same condition than if they are measured only once, and there is little benefit in replicating the measure 100 times rather than 20 times, at least if the focus is on the mean.
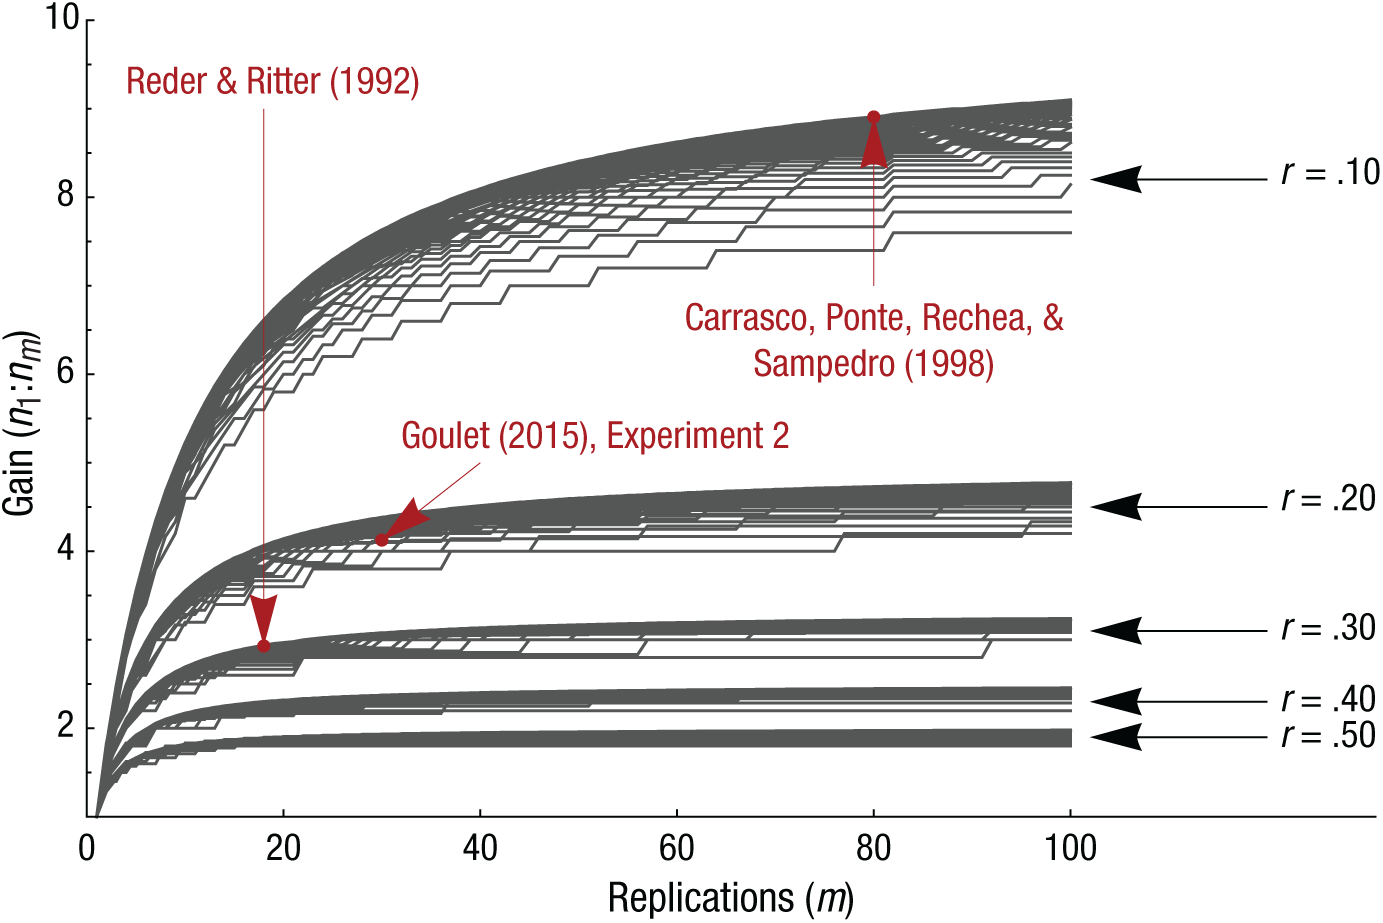
Gain in effective participants (expressed as the ratio n1:nm), computed from Equation 4c reversed, as a function of the number of recruited participants (nm), the number of replications (m, ranging from 1 to 100 in increments of 1), and the true population cross-measurement correlation (r). Each cluster of lines shows results for a given value of r; the different lines correspond to different values of nm, from 5 to 100 in increments of 1 (lower values have lower ratios). The dots illustrate where some of the reviewed experiments in Table 1 fall.
Box 1. Mathematica Code Used to Generate the Plot in Figure 1
(* This function returns the effective number of participants *)
(* given the following parameters: n1, m and r *)
(* This is equation 4c/reversed *)
AdjustedN[n1_, m_, r_] := Ceiling[(n1 - 1)/((1/m) + (m - 1)/m*r) + 1]
(* This specifies the values of the parameters and *)
(* the simulated conditions *)
listofn1 = Range[5, 100];
listofm = Range[1, 100];
listofr = {0.1, 0.2, 0.3, 0.4, 0.5};
(*This simulates all the conditions, returning the ratio n_m : n_1 *)
data = Table[
{m, AdjustedN[n1, m, r]/n1},
{r, listofr}, {n1, listofn1}, {m, listofm}
];
(*This merge the first two dimensions*)
data = Apply[Join, data];
(*This generates the figure.*)
Figure1 = ListPlot[data,
(*The figure is customized with the following options:*)
Joined -> True, Axes -> False,
Frame -> {True, True, False, False},
FrameLabel -> {“Replications (m)”, “ Ratio (n_1 : n_m)”},
PlotStyle -> Darker[Gray],
FrameStyle -> Directive[Black, “Arial”, 16]
Measuring a large number of participants is always the best and recommended scenario for any research. Replications cannot replace the added population representativeness that a participant brings. However, the sample size required to reach sufficient statistical power is sometimes unrealistic. For example, consider a group of researchers who initially think they will recruit two groups of 8 participants for a study (16 participants in total). They perform an a priori power analysis assuming a medium effect size and discover that to reach a power of 80%, they need 32 participants in each group (64 participants in total). Thus, 48 additional participants are required; the researchers need to recruit 4 times as many participants as initially planned.
Replications offer an alternative solution. Assuming a conservative cross-replication correlation of .20 (Table 1 suggests .14, which is more liberal), the researchers can change their design to ensure that they measure each of their 16 participants 21 times. In this study, measuring 16 participants 21 times has the same statistical power as measuring 64 participants only once. This approach is more realistic for this group of researchers. It also offers more precise and valid measurements of the participants and an increase in power compared with the initial plan of measuring 16 participants one time each.
Should review studies’ estimates of the statistical power of published psychological research be reconsidered?
The short answer to this question is no. The adjustment to power calculations that we have proposed in this article shows that it is possible to increase statistical power by replicating a measure multiple times in each condition, but we do not mean to say that participants can be traded for trials. Rather, we are saying that the desired sample size can be more obtainable if it is based on a consideration of the number of replications.
Over the years, there have been critiques questioning the lack of statistical power in psychological studies (Bezeau & Graves, 2001; Button et al., 2013; Sedlmeier & Gigerenzer, 1989). These articles reviewed statistical power in fields in which it is very difficult to replicate the measures. For example, in clinical psychology, it is often not convenient to repeat a full IQ test a second time. In the case of a depression inventory, participants might remember their previous responses and repeat them; with a perfect correlation, there is no benefit in replicating the measures. In social psychology research, questionnaires are already composed of repeated measures that are developed to optimize Cronbach’s alpha with the fewest replications possible. Because there is little benefit derived from replications when r is high, there is little reason to administer such a questionnaire a second time.
In sum, we do not doubt the lack of statistical power reported in the influential review articles that we just cited, and that should remain a great concern. A systematic lack of statistical power can be harmful for cumulative science (Abraham & Russell, 2008; Szucs & Ioannidis, 2017). There are research areas in which replicating the measures is problematic, and in these areas, increasing sample size may be the only possible solution.
Why not analyze the replication effect?
An alternative to averaging measures across replications is to analyze them formally. In an ANOVA. for example, an additional replication variable with m levels can be added. This is very rarely done, though we are aware of one exception (Schneider & Shiffrin, 1977).
There are many reasons not to analyze the replication effect. First, replication has little theoretical importance. Second, the replication effect may be significant because it reflects training in the task, and thus it may interact with the effects of other variables, needlessly complicating the presentation of the results. Third, whether or not the replication effect is analyzed has no bearing on the other effects in linear models (as long as there are no missing data). Fourth, a common practice is to remove from analysis trials on which errors occurred. This can result in a considerable amount of missing data and many empty cells, complicating analyses further (if imputation is used) or reducing power (under pairwise deletion).
The present solution to increase statistical power contrasts with other questionable methods, such as running multiple statistical tests, adding participants until a significant result is found, and adding or removing covariates (Simmons, Nelson, & Simonsohn, 2011). These practices, known collectively as p-hacking, are bad research practices because they increase the probability of observing significant results and create biases for significant results in the literature. The present solution, on the other hand, involves making a decision prior to data collection and therefore does not fit in the p-hacking family of practices. We provide in Appendix B a step-by-step example of how to apply the solution proposed in this article.
Footnotes
Appendix A: Estimating the Correlation Across Replications
The correlation across replications is a measure of the reliability of scores obtained multiple times. It indicates how much the measurement varies across these multiple instances (trials). A high correlation across replications means that individual participants show little variability. Given a data set containing replications, it is possible to estimate the correlation across replications in a variety of ways. Here we describe four approaches.
Appendix B: A Step-by-Step Approach
In this appendix, we provide a concrete example of a power analysis taking into account the number of replications and the correlation across replications. The objective is to compute the effective number of participants required to attain statistical power of 80%. In this hypothetical example, we compare the response times (RTs) for “same” and “different” responses in a same/different task (Bamber, 1969). This task consists of a series of trials in which participants view pairs of stimuli and report whether the members of each pair are the same or different. Responses in the same condition are commonly faster than responses in the different condition, and we would like to investigate this fast-same effect in a new experiment.
First, we estimate the effect size on the basis of unpublished results obtained in previous experiments conducted in our laboratory. At this stage, it is possible to compute the desired sample size if the participants are measured only once, and we do so with G*Power (Faul, Erdfelder, Lang, & Buchner, 2007). Second, we use the data from the same experiments to estimate the correlation across replications. Finally, we compute the required number of participants measured with replications using the values obtained in the previous steps. We use a spreadsheet to keep track of our calculations.
Acknowledgements
We would like to thank Marisa Carrasco, Mario Fifić, Pierre Jolicoeur, Guy Lacroix, Thomas Palmeri, Lynne Reder, Timothy Rickard, and David Strayer for kindly agreeing to provide us with raw data from their studies. We would also like to thank Greg Francis, Jean-Christophe Goulet-Pelletier, Jesika Walker, and an anonymous reviewer for comments on an early version of the manuscript.
Action Editor
Frederick L. Oswald served as action editor for this article.
Author Contributions
M.-A. Goulet and D. Cousineau jointly generated the idea for the manuscript. D. Cousineau contacted researchers to access raw data from the studies included in the correlation analysis. M.-A. Goulet created the figures and table, wrote the code in the boxes, and wrote the appendices. Both authors wrote the main article, critically edited the manuscript, and approved the final submitted version of the manuscript.
Declaration of Conflicting Interests
The author(s) declared that there were no conflicts of interest with respect to the authorship or the publication of this article.
Funding
This research was supported in part by le Conseil pour la recherche en sciences naturelles et en génie du Canada.
Open Practices
Open Data: no
Open Materials: not applicable
Preregistration: no