
Abstract
Background:
Altered vaccine demands and uneven utilization patterns in childhood immunization are evident nationwide. These variabilities may stem from a range of internal and external factors influencing parental preferences. Regular checks and balances are necessary to ensure equal accessibility for all sections of society.
Aim:
To assess the usage trends of childhood vaccines for 5 years (2018–2022) and to monitor instances of delayed/incomplete immunization status within the community.
Methodology:
This study recorded the utilization trends of all recommended childhood vaccines over a 5-year period using an ambispective design. The immunization details from 3 years (2018, 2019 and 2020) were retrieved retrospectively, while those from 2 years (2021–2022) were collected prospectively through the immunization registry. Trends in childhood vaccine utilization were recorded across different years, and delays and incomplete vaccine utilization among children, along with factors resulting in deviated immunization timelines, were analysed and compared. The association of factors with deviated immunization utilization was determined using the chi-square test, and a two-way ANOVA analysed utilization variabilities over 5 years.
Result:
Overall, the study profiled 32,085 children’s (who utilized 87,782 vaccine doses) vaccine utilization pattern for 5 years. Optional vaccines were less utilized (18.12% doses by 25.14% children) compared to mandatory vaccines (81.88% doses utilized by 74.86%). The most utilized mandatory vaccine was oral polio (17.48%) and for optional vaccines, it was measles mumps rubella (MMR; 28.31%). Boys had the highest utilization (55.97%) with a significant male preponderance in optional vaccine utilization (p value <0.05). Overall, there was a 26.12% decline (percent change) in vaccine utilization in 2022 compared to 2018. Among children with delayed immunization timelines (6.02%), 3.38% were on catch-up, and 2.45% were not. The most commonly delayed vaccines were diphtheria + tetanus + pertussis boosters (30.90%), Tdap (26.19%) and MMR vaccines (20.65%). Influenza vaccines (28.08%) were the most partially utilized optional vaccine, followed by varicella vaccines (20.92%). Factors such as gender (female), age over 1 year, rural residence and low- to middle-income families were significant predictors of deviated immunization status in children.
Conclusion:
The study mapped the utilization trends of immunizations at a tertiary care hospital in south India over the past 5 years, including the COVID-19 years. Gender inequality in the utilization of optional vaccines is a concern that warrants further research and redressal. Timely administration of childhood vaccinations is crucial for reducing susceptibility to vaccine-preventable diseases and promoting overall well-being.
Plain language summary
The study profiled the utilization of childhood vaccines over a five-year period (2018 to 2022), including the impact of the COVID-19 pandemic on vaccine utilization patterns in children. The study revealed significant socio-economic inequalities, particularly regarding incomplete immunization status. Boys benefited more from childhood vaccinations than girls in all years. There was a lower utilization of optional vaccines, which required to be paid from the beneficiaries’ pocket among girls in the study community. Additionally, partial utilization, where full doses were not received as recommended, was more common among girls. Children older than one year and those from lower and middle-income families were identified as the most vulnerable groups with deviated or incomplete immunization timelines. The authors recommended a focus on remedial actions for these disparities, extending services to the weaker sections of society. Effective immunization coverage is crucial as an indicator of the performance of various government immunization programs.
Keywords
Introduction
Many deadly infectious diseases from the past are well-tamed due to the timely intervention of vaccines. In a developing country like India, which constitutes 17.7% of the world’s population, 1 the government has launched many immunization programmes such as India’s Expanded Programme of Immunization (EPI; 1978), Universal Immunization Programme (UIP; 1985), Mission Indradhanush (2014) aiming to vaccinate 27 million newborns annually. However, despite these efforts, the country still struggles with an Infant Mortality Rate of 27.69 deaths/1000 live births and an Under-five Mortality Rate (U5MR) of 35 deaths per 1000 live births. 2
The child mortality rates in low- and middle-income countries remain disproportionately high. 3 Achieving effective immunization coverage for children from birth to the first 5 years of life is crucial, especially in India with a high prevalence of vaccine-preventable diseases (VPD). 3 Ensuring childhood immunization coverage is consistently a top priority for nations, prominently listed among the goals to achieve in the Sustainable Development Goals (SDGs). 4 However, India was listed as one of the countries that failed to meet the Millennium Development Goals, with the National Family Health Survey-4 (NFHS-4, 2015–16) reporting only 62% of children aged 12–23 months have been fully immunized. 4 On the other hand, the NFHS-5 conducted between 2019 and 2021 estimated more than three-fourths (77%) of the children aged between 12 and 23 months were fully immunized as compared to NFHS-4 (2015–2016). 5 This indicated that over 30% of children in the same age group are under-utilized or partially vaccinated in the country. This is far from the universal coverage targeted by SDG 3.
Ensuring equal accessibility to immunization, despite cultural, regional, geographical and socio-economic disparities remains a significant priority in low- and middle-income countries. India with its diverse population and numerous health inequalities faces substantial challenges in achieving complete childhood immunization. 6 Several South Asian studies outlined various internal barriers that hinder the attainment of full immunization among children such as maternal education, low vaccine literacy, larger family size, place of delivery, poor infrastructure, household poverty, migration, parent’s forgetfulness, vaccine hesitancy, etc.6–9 Lower privilege of these populations renders them vulnerable to many infectious diseases, highlighting the risk of outbreaks and potential pandemics. United Nations International Children’s Emergency Fund has already cautioned South Asian countries about sporadic outbreaks of various VPDs, particularly measles and diphtheria. 10
Furthermore, the impact of the COVID-19 pandemic was another major factor that significantly affected childhood vaccine utilization in the country. 11 According to the World Health Organization, there has been a notable reduction in global coverage for the DTP (diphtheria + tetanus + pertussis) vaccine over the past 28 years with a large decline in the number of children completing three doses of the DTP3 by mid-2020. 12 Additionally, the pandemic led to rapid decrease in vaccine procurement, utilization, delayed timelines and missing immunization schedules, further impacting childhood immunization coverage.13,14 The areas such as missing vaccine schedules, delayed immunization, new catch-up programmes, new community outbreaks, low utilization and its barriers, etc., should be the prime focus in this post-pandemic era.
Across different states of India, variations in childhood vaccine utilization are evident, influenced by regional recommendations. In India, childhood vaccinations are available at various facilities, including Primary Health Centres (PHCs), government hospitals, private clinics and tertiary care hospitals. PHCs primarily offer free government-distributed vaccines, while tertiary care hospitals, like the one in this study, provide both free government vaccines and optional paid vaccines. This study attempted to chronicle the vaccine utilization patterns observed in an immunization centre located in south India for 5 years. Additionally, it seeks to explore socio-economic inequalities in vaccine utilization within the community. Analysing trends in vaccine utilization and delays in immunization timelines can help us to understand the various pitfalls present in the system and provide valuable insights for future decision-making processes.
Methodology
An ambispective study was conducted in the immunization centre of a tertiary care hospital in South India for a period of 32 months (January 2021–August 2023). The vaccine utilization details for 2 years (2021–2022) were collected via the immunization registry implemented at the study site in the year 2021 (January), while 3 years of data (2018, 2019 and 2020) were retrieved retrospectively from the paper-based hospital records (manual registers) maintained at the study site. The study site (immunization centre) was located in the paediatric outpatient department (OPD) of a tertiary care hospital (1800 bedded multi-specialty hospital) in a populated city (populated with 1,261,000 in the year 2022) in South India. 15 The hospital caters to urban and rural residents of Mysuru, Chamarajangar, Mandya and Kodagu districts. All the subjects vaccinated as per the UIP between the age group of 0 and 18 years and obtained at least one vaccination at the study site were included.
Study procedure
The retrospective data from 2018 to 2020 were collected during the last 8 months of the study period (January–August 2023) and were initially transferred to an Excel spreadsheet. The data included all immunization details such as the name of the vaccine, dose and type of the vaccine, previous vaccination dates, vaccine utilization pattern, basic demographics and age of the vaccine beneficiaries. The electronic immunization registry allowed for the inclusion of previous visits identified through unique registration numbers, thereby avoiding duplication of records. This registry maintained a single immunization profile for each child, which was also updated prospectively by cross-checking their immunization cards during subsequent visits to the study site. This approach minimized duplicate records within the study, ensuring accuracy in the count of vaccine beneficiaries. The study separately categorized the number of vaccine beneficiaries and the utilized vaccine doses based on the year of vaccine administration, without repeating the count of children. The doses and schedules of routine childhood vaccines available in India (Supplemental Table 1) were referred from the Indian Academy of Paediatrics Advisory Committee on Vaccines and Immunization Practices (ACVIP) 16 and National Immunization Schedule (NIS), 17 along with the yearly updates from the State government. Both the NFHS-4 (2015–2016) and NFHS-5 (2019–2021) are integrated state-wise surveys conducted by the Ministry of Health and Family Welfare of the Government of India and were used as primary references for comparison. 5
The immunization details collected prospectively from 2021 to 2022 were updated daily in the database. This included vaccination dates, vaccine doses, types and brands, and demographic details of the child. These details were either added to an existing profile (for subsequent visits) or used to create a new profile (for first-time visits to the study site). The ‘immunization card’ provided to parents at birth and issued nationwide at any immunization centre was used to track the vaccination timelines during each visit. This card includes a list of all childhood vaccines recommended by the country’s immunization program (UIP), along with spaces to document the current vaccination date and the due date for the next immunization, the type and brand of vaccines and the batch number of vaccine vial. This enabled the researchers to accurately record immunization timelines and utilization details, even if the child received doses at sites outside of the study hospital.
The timeline for vaccination was considered from the birth date to the next recommended age of the vaccine schedule as per NIS; hence, any delay from the recommended age/timeline (with a grace period of 15 days) was termed as delayed immunization. The vaccinees with a delayed immunization timeline (for mandatory vaccines) were further divided into delayed (on catch-up) and delayed (not on catch-up). The children with a delayed immunization timeline (for any mandatory vaccines) but were caught up before their next due dose were categorized as the ‘delayed (on catch-up)’ group. However, those children with a delayed vaccination timeline and continued to have delayed timelines for subsequent doses were termed as the ‘delayed (not on catch-up)’ group. The children who adhere to the recommended immunization timelines were termed as not delayed groups. Partial immunization refers to children who do not receive full doses of any of the optional vaccines as recommended. Children who are not eligible for the next-due vaccine (as per the recommendation) were excluded from the partial immunization category. Hence, children with delayed or partial immunization status were termed as deviated immunization timelines in the study. Additionally, the most commonly delayed/missed vaccines and the demographic status of the child with a delayed immunization timeline were recorded.
The study population was categorized into various socio-economic classes using the modified Kuppuswamy scale 2022. 18 This scale assigned scores based on the education, occupation, and monthly income of the family head, and categorizes individuals into different economic classes based on these scores.
The vaccine utilization patterns within specific areas served by the immunization centre were observed by dividing subjects into different districts to which they belong. To compare the vaccine utilization patterns across each year included in the study period, the year 2018 was considered as the base or reference year.
Statistical analysis
All relevant details related to immunization were compiled and entered in an Excel spreadsheet and analysed using IBM Statistical Package for the Social Sciences software version 22.0 (licensed to JSS University). Quantitative data were expressed in mean, standard deviation, and percentages. The percentage change in the number of vaccine doses utilized each year was compared keeping the number of vaccine doses utilized in 2018 as the reference.
The percent change was calculated using the formula,
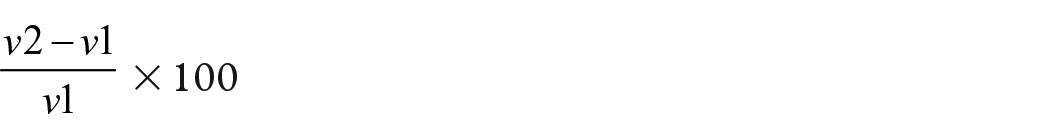
where v1 – number of vaccine doses utilized in the reference year, that is, 2018
v2 – number of vaccine doses utilized in the respective year.
The study evaluated the association between various demographic variables such as age, gender, residence, type of population (urban or rural), and socio-economic class and the patterns of immunization utilization (delayed immunization timeline and partial immunization status). The data were categorized and analysed to assess year-wise trends in both mandatory and optional vaccine utilization. The chi-square test was employed to determine the relationship between categorical variables, while the two-way ANOVA test was conducted to determine the interaction effects between different variables on immunization outcomes (Supplemental Table 2). The significance was expressed as a ‘p’ value of <0.05 with a 95% confidence interval.
Results
During the 5-year study period, a total of 150,211 children visited the paediatric OPD of the hospital. Among them, 32,085 children utilized a total of 87,782 different vaccine doses from the immunization centre, representing a vaccination rate of 21.36% (n = 32,085/150,211). The vaccine utilization trends of 19,996 children (62.32%) who received 57,854 doses (65.91%) were analysed using paper-based records, while another 29,928 doses (34.09%) utilized by 12,089 children (37.68%) were electronically recorded via the digital registry. The study observed a percent change decline of 53.01% vaccinees and 25.72% vaccine doses in the year 2020. The distribution and vaccine utilization patterns of the study population in each year are depicted in Figure 1.
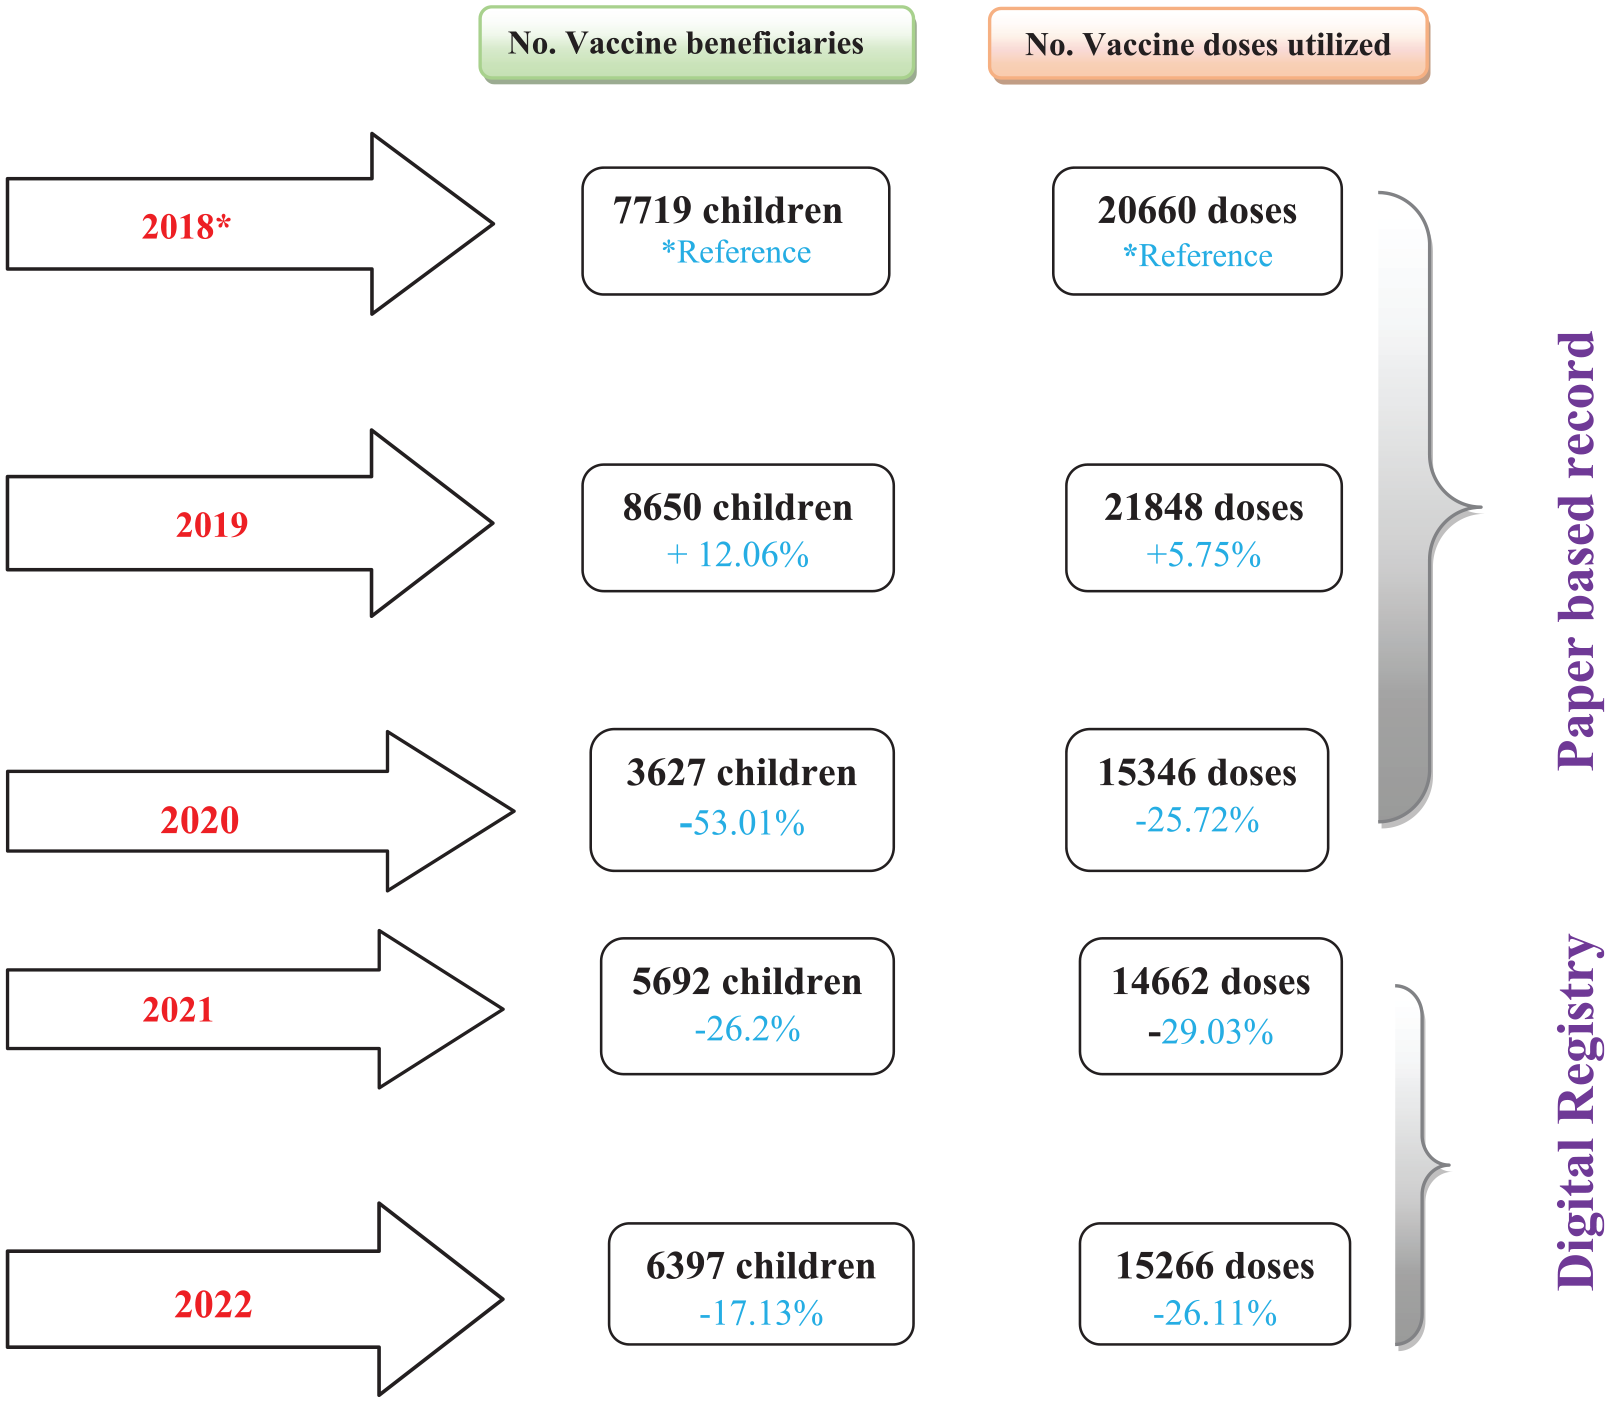
Distribution of the vaccine doses and beneficiaries along with the utilization trend in different years of the study period.
Demographic distribution of the study population
The demographic characteristics of the study population were analysed for different years from 2018 to 2022. The study population predominantly consisted of boys accounting for 56.53% (n = 18,137) and 43.47% (n = 13,948) of girls. The maximum number of vaccinees (26.96%, n = 8650) was observed in the year 2019 while the least number was seen in the year 2020 (11.30%, n = 3627). Across all years, the highest number of vaccinees (47.90%) fell within the age group of 0 to 6 months, while the least utilization was observed in the age group 15–18 years. In 2020, there was an increase in the number of vaccinees from the same district as the study site (67.77% from Mysuru) compared to the reference year (43.98% in the year 2018). A majority of the study population resided in urban areas (63.02%) and 36.98% (n = 11,865) were from rural areas. The study site noted that the majority of the vaccinees belonged to upper-lower (40.71%) and lower-middle (25.08%) classes of the society. Detailed descriptions of the demographic distribution of the study population from 2018 to 2022 are provided in Table 1.
The demographic representation of the study population.*

Age categories mentioned in the table based on the NIS age chart. 17
The utilization of mandatory vaccines
As per the immunization schedule given by the government, there are mandatory vaccines at birth (which every newborn receives) and certain vaccines are optional (according to the affordability and geographical preferences). Three of the vaccines (Bacille Calmette-Guerin (BCG), oral polio vaccine (OPV) and Hepatitis B) are scheduled as mandatory birth vaccines for newborns within 24 h or as early as possible (for those children born with low birth weight). A total of 38.35% (n = 33,666) of the doses were utilized by 34.97% (n = 11,222) of newborns at the study site. The utilization of other mandatory vaccines was 43.53% (n = 38,209) doses by 42.17% (n = 13,530/32,085) vaccine beneficiaries. OPV (N = 9964) was the maximum utilized mandatory vaccine across all the years, while the utilization of MR (measles rubella) (N = 198 (2018) to 6 (2022)) vaccine gradually decreased. The rota vaccine was introduced to UIP in the third week of August 2019 19 which accounts for the increase in the utilization of the rota vaccine in post-2019. The variations in the utilization pattern during different years of the study are shown in Figure 2.

The utilization of different mandatory vaccines in various phases of the study.
The utilization of optional vaccines
During the study period (5 years), a total of 18.12% (n = 15,907/87,782) of optional vaccine doses were utilized by 22.85% (n = 7333/32,085) of the study population. In 2022, a decline in the utilization of certain optional vaccines (Hepatitis A, Varicella, typhoid conjugate vaccine) can be noticed, while a gradually increased demand was observed among influenza, pneumococcal conjugate vaccine (PCV) and human papillomavirus (HPV) vaccines. During the study, PCV was changed from optional to mandatory vaccines (introduced to UIP in October 2021 20 ). The utilization graph of optional vaccines among the study population during different years of the study is shown in Figure 3.

The utilization of optional vaccines during various study phases.
The utilization trends among the study population
The utilization pattern for both mandatory and optional vaccines among different population characteristics was able to be outlined in this study. Boys consistently had the highest utilization each year, regardless of whether the vaccine was mandatory or optional. For mandatory vaccines, the percentage difference between boys to girls was substantial in 2018, with boys utilizing vaccines 4.96% more than girls. This gap gradually decreased in the subsequent years. However, in 2022, there was a notable increase in the utilization of mandatory vaccines among girls. By contrast, for optional vaccines, the percentage difference between girls and boys was significantly higher in all years. A detailed representation of gender-based utilization for both mandatory and optional vaccines is shown in Figure 4, graph 4(a).

Utilization trends of mandatory and optional vaccines among the study population.
During the study period, 7.81% delays in immunization timelines were observed among mandatory vaccine utilizers, while 10.30% partial immunization status was noted among optional vaccinees. The distribution of deviated immunization timelines among children with different socioeconomic statuses and areas of their residence is depicted in graph 4(b) of Figure 4. Among those with delayed immunization timelines for mandatory vaccines, 4.38% (n = 1083) were identified as delayed (on catch-up), while 3.43% (n = 849) were identified as delayed (not on catch-up). Delayed vaccinees not on catch-up were predominantly observed in the lower-middle class (43%) residing in rural areas (52.06%) of Mysuru district (38.28%). However, children with a delayed timeline but on catch-up were predominantly observed among lower-middle class (60.48%) residing in urban areas (80.61%) of Mysuru district (61.03%) compared to other groups. A similar observation was found among children with a partial vaccination status for optional vaccines. The maximum partial utilization of optional vaccines was observed among the lower-middle class (45.16%), in rural areas (53.40%) and in Mysuru district (49.80%).
The vaccine with the most delayed timeline was the DTP booster dose (n = 597) followed by the Tdap vaccines (n = 506) and MMR vaccines (n = 399). Overall, 36.08% (n = 438) delayed at least two vaccines and 31.79% (n = 386) delayed more than four vaccines during the study period. Among the optional vaccine utilizers, children who were vaccinated with the influenza vaccine (n = 212) observed the highest rate of partial vaccination, while PCV vaccines (n = 1830) had the maximum number of children who received full doses during the study period. A detailed representation of delayed and partial immunization among the study population is shown in graph 4(c) of Figure 4.
Percent change in vaccine utilization trends in different years
The study compared the percent change in the utilization of each childhood vaccine dose during different years of the study period (2019–2022) with the reference year (2018) (Figure 5). Apart from DTP boosters (first and second booster doses), all other routine childhood vaccine utilization was high in the year 2019 as compared to the reference year (graph 5(a)). In 2020 (graph (b)), most of the mandatory vaccines excluding the Rota vaccine (which was an optional vaccine in 2018) showed a decreased percent change in the utilization as compared to the reference year. However, a few optional vaccines such as PCV and influenza vaccines showed an increase in utilization of more than 100%.

Comparison of vaccine utilization percent change difference in various years with 2018 (reference year).
The graph 5(c) showed a slight recovery in the percent change in utilization of some mandatory vaccines such as DTP booster 2 (improved from −17.18% in 2020 to −12.82% in 2021) and MMR vaccine (−30.23% in 2020 to −22.855 in 2021). However, utilization of optional vaccines increased, including varicella (+10.89%), HPV, PCV and influenza (with >100% utilization than the reference year). Graph 5(d) in Figure 5 shows a gradual recovery in the utilization of some mandatory vaccines in 2022. The change in the vaccine utilization percentage compared to the previous year (2021) is summarized below; a 1.42% increase in birth vaccines in 2022 as compared to 2021, similarly 13.08% recovery for OPV in 2022, and an increase of 9.17% and 9.56% for Penatvac and inactivated polio vaccine, respectively. However, certain other mandatory vaccines such as DTP boosters 1 and 2, MMR vaccine and Tdap vaccine experienced declines of 12.1%, 37.44%, 13.68% and 19.5%, respectively.
Factors affecting deviated immunization timelines among the study population
The influences of various factors among the study population that were associated with the immunization timelines were determined using Chi-square statistics. Factors such as gender, age group, area of residence, and socio-economic status were considered as parameters that can affect the utilization of mandatory and optional vaccines. A detailed representation of these factors and their association with utilization is shown in Table 2. Here the group with the lowest incidence rate was considered as the reference group for comparison in each parameter. The study revealed that a delay or partial utilization of vaccines was observed more among girls than boys in the study site (p value <0.0001). An increased occurrence of deviated immunization timeline was observed with a higher age group; children less than 1-year old had fewer occurrences of delays and partial immunization compared to the children older than 1 year in the study population.
The association between various factors and deviated immunization timelines in children.

The category with the lowest incidence rate was considered as the reference.
Children belonging to the Mysuru district (chi-square = 120.46) were found to have the highest deviation in the immunization timeline, followed by Mandya (chi-square value = 97.86) and Kodagu districts (chi-square value = 67.72). Although both urban and rural populations showed an association with delayed or partial vaccine utilization, a slight increase was observed among children residing in rural areas. Additionally, the upper-lower class showed more frequent deviations in immunization timelines compared to other economic classes in the study population. However, children belonging to the lower-middle class and lower-class families were also found to have a significant association with a high incidence of delayed or partial immunization.
Discussion
This study maps the utilization trends in childhood vaccines over the past 5 years, including the COVID-19 pandemic period from 2019 to 2021. The country reported its index COVID-19 case in January 2020 in south India. 21 During 2018–2019, childhood immunization showed a progressive trend nationwide, and a similar increase in utilization was observed in this study. In 2019, there was a 5.75% and 12.06% increase in the utilization of vaccine doses and the number of beneficiaries respectively (F ratio; 10.743, p value; 0.005; Supplemental Table 2), compared to the reference year (F ratio; 9.16, p value; 0.009). This indicates active immunization coverage among the study community just before the pandemic. However, in 2021, a decline in the number of vaccine doses from the reference year by 29.41% was observed. This decline suggests that fewer children utilized a higher number of vaccine doses during the pandemic.
Subsequently, a decline in the utilization of childhood vaccines was observed in 2021 (F ratio: 8.94, p value: 0.009) compared to the year 2020 (F ratio: 9.23, p value 0.008) (Figure 1 and Supplemental Table 2). In 2021, the number of vaccine utilizers increased while the total number of doses utilized remained lower than in 2020. Various public concerns and transportation difficulties likely contributed to this decline,22–24 while the suspension of immunization services (in April 2021) due to a surge in COVID-19 cases (India reported with highest number of COVID-19 cases in Asia by August 2021 11 ) can also be the reason for this decline. The people may have gotten vaccinated at centres closer to their homes. However, a gradual recovery in 2022 (F ratio: 9.94, p value: 0.007) can be observed compared to 2020–21, both in terms of vaccine utilizers and doses utilized. A retrospective study based on NHFS-5 data found that Indian children experienced lower routine immunization coverage and greater delays in immunization during the pandemic compared to those who were unaffected by it. 13
Although the study encompassed a slightly larger representation of boys (55.97%), it was not statistically significant (p value >0.05). The highest vaccine utilization among boys occurred in the year 2020 (F ratio: 8.285, p value: 0.02), whereas girls never showed a higher utilization than boys across any of the years. This indicates that boys benefited more from childhood vaccination at the study site as well as more boys were vaccinated during the pandemic. Debnath et al. stated that girls encountered heightened obstacles in accessing routine childhood vaccination due to increased restrictions on movement during the pandemic. 25 According to the NFHS-5 survey, the sex ratio at birth for children born in the last 5 years in the district (Mysuru) was reported as 1123 females per 1000 males. 26 Although more females were born in the region, male vaccinees were more at the study site. This could also be attributed to factors such as the residential proximity of vaccinees to the study site or the prevalence of institutional births.
Several studies have reported gender inequalities regarding girls’ access to basic health necessities like childhood immunizations.27,28 In this study, no significant gender disparity was found in the utilization of mandatory vaccines (p value > 0.05). However, the utilization of optional vaccines was more common among boys (p value: 0.02, 0.01 and 0.02 in the years 2019, 2020 and 2022, respectively) at the study site. Nevertheless, this male preference in utilization varied depending on the vaccine (based on the affordability) and the year of utilization. The study identified a gender disparity especially in the utilization of the influenza vaccine, with 70.07% of doses being utilized by boys from 2020 to 2022. Among the 29.93% (n = 126/421) of girls who received at least one dose of influenza vaccines, only 17.01% (n = 72/421) of them received the second dose; 47.03% (n = 198/421) of the boys received two doses of influenza vaccine. A study conducted in the eastern parts of the country reported similar male preferences on the majority of the optional vaccines (excluding varicella and measles). 29 In 2022, there was a significant increase in optional vaccine utilization among girls (p value 0.03). This increase may be linked to the rise in HPV vaccine utilization among adolescent girls at the study site (where no girls were vaccinated from 2018 to 2020, but 22 girls were vaccinated in 2022). However, the majority of HPV vaccine utilizers belong to upper-middle-class families and have well-educated parents. Shah et al. explained the importance of educating parents and addressing their concerns that will promote HPV vaccine utilization. 30
The percent change in individual vaccine utilization each year can reflect the interplay of various factors influencing demand and acceptability from the public perspective. A sudden fall and gradual recovery were traced for the majority of the mandatory vaccines following the pandemic, while a mixed trend was seen in the optional vaccine utilization. However, vaccines such as Rota vaccines and PCV showed an upward graph across all the years due to their introduction into the UIP programme of the country as mandatory vaccines in 2019 and 2021, respectively. 20 It follows that the acceptability of the vaccines is influenced by socio-economic factors (affordability) and government policies as confirmed by Krishnamoorthy 31 and Schueller. 32 By contrast, the MR vaccine utilization (mandatory vaccine) declined progressively from the base year, whereas the utilization of MMR vaccine (paid vaccine, cost ranges from INR 200 to 600; TRISEVAC) gradually picked up despite the cost. This could be because the parents are more aware of the consequences of viral infections and are willing to pay from their pocket for the additional immunity. As reported by Vadiya and Hamed, there is low seropositivity for mumps among the Indian population and only two doses of the mumps vaccine can bring about seroconversion and boost immunity. They also recommend that the nation should make efforts to understand the burden of the disease to enable the decision to include the mumps vaccine in the UIP programme. 33 Such a decision can decrease the economic burden on parents as well as the disease burden on the nation.
Several mandatory vaccines such as DTP booster 2 (−37.44%), Tdap (−19.5%), MMR vaccines (−13.68%) and DTP booster 1 (−12.1%) showed a further decline in their percent change utilization in 2022 (graph 5(d)) as compared to 2021 (graph 5(c)). Both the DTP boosters (booster 1: −9.07% and booster 2: −20%) in the study population had already observed a decline before the pandemic (graph (a)), suggesting that the pandemic impact may have had less effect on the utilization of these vaccines. On the other hand, DTP booster (30.90%) vaccines were associated with the most delayed immunization timeline among the study population, followed by Tdap (26.19%) and MMR (20.65%) vaccines, of which 36.13% had delayed immunization timeline and not on catch-up status. Other Indian studies also reported low vaccine coverage with partial or missed booster doses observed in children aged above 5 years.34,35
Apart from the utilization decline and gradual recovery following the pandemic years, this study highlights deviated timelines and partial utilization of childhood vaccines. Age-appropriate timely vaccinations within the recommended window not only boost children’s immunity but also indicate the quality dimensions of immunization programmes in the country. 36 During the study period, 8.37% (6.02% delayed and 2.35% partial vaccinations) of deviated vaccine utilization was identified, with the majority traced following the pandemic. Various factors such as gender (girls), higher age group (more than 1 year), area of residence and lower socio-economic status were found to have significant associations with deviated immunization status among the study population. A study conducted in 2019 by Choudhary et al. determined that India has a high proportion of children with delayed mandatory vaccinations ranging from 23.1% to 34.8% and low birth weight were more likely to cause delayed vaccinations. 37 However, a contemporary study indicated that religion and maternal education were also determinants related to delays in childhood. 38 This study highlights different external factors that can lead to delays and partial utilization of childhood vaccines. At the same time, these disparities may also be significant potential socio-economic inequalities existing in the current system of the country. The area of residence of the child, such as a child from a rural area, showed a slightly higher chance for deviated vaccine utilization, while all the four districts’ populations enrolled in the study showed a significant chance of deviated immunization patterns. However, children from Mysuru district had a higher chance of delayed or partial immunization. This is because more vaccine utilizers were enrolled from the same district (where the immunization centre was located).
Finally, this study concludes that regardless of the year, the most vulnerable group in the study population is girls aged over 1 year from lower- and middle-income families, for an incomplete immunization status in childhood. The preferences for complete immunization status and accessibility to various optional vaccines need to be urgent concerns that require in-depth study to assess internal variations in society. At the same time, this study did not identify any missed vaccination among the study population, which may be due to the strengthening of various catch-up programmes in the country on taking into consideration the negative impact on routine childhood immunization caused by the pandemic. 39
Limitations of the study
Despite the comprehensive nature of this study, several limitations should be acknowledged. Firstly, the reliance on retrospective data for the years 2018–2020 may have introduced recall bias in the recorded information. Additionally, the data from the manual immunization register required extensive data cleaning to avoid duplication and ensure accuracy. Secondly, the study was conducted in a single tertiary care hospital, which may limit the generalizability of the findings to other settings or regions. The socio-economic and geographic characteristics of the study population might differ from those in other areas, affecting the applicability of the results. Thirdly, the study did not account for potential confounding factors such as parental education level, access to healthcare facilities, and cultural beliefs, which could influence immunization utilization. Finally, the study’s observational design does not allow for establishing causal relationships between the identified factors and immunization utilization. Future studies with larger sample sizes, multiple sites, and longitudinal designs are recommended to validate and expand upon these findings.
Conclusion
This study provides a detailed representation of childhood immunization and its utilization trends in a South Indian hospital. Apart from the decline caused by the pandemic, the study could also illustrate the altered vaccine preferences and variabilities in the region over 5 years. The influence of socio-economic factors and government initiatives (awareness and education) on the acceptance and active coverage of childhood immunization was observed. The persistence of gender inequality for optional vaccines is a concern that deserves further research and redressal.
Both the delayed immunization timelines-not yet caught up, and those with an incomplete immunization status warrant significant threads that can lead to further outbreaks or pandemics. Appropriate remediation plans need to be enhanced, especially targeting the weaker sections of society. Equal accessibility to vaccines needs to be a prime focus of authorities, particularly in financial and social aspects. The authors recommend a focus group approach to ensure timely vaccinations and catch-up programmes, which can directly contribute to a healthier society better equipped to handle future outbreaks.
Supplemental Material
sj-docx-1-tav-10.1177_25151355241287705 – Supplemental material for Mapping changes in the utilization of childhood immunization over 5 years in a south Indian tertiary care hospital
Supplemental material, sj-docx-1-tav-10.1177_25151355241287705 for Mapping changes in the utilization of childhood immunization over 5 years in a south Indian tertiary care hospital by Merrin Mathew, Savitha Rajapur Sanathan, Juny Sebastian, Mandyam Dhati Ravi, Taniya Joy, Rovin Mathew Theempalangad and Panchaksharappa Gowda in Therapeutic Advances in Vaccines and Immunotherapy
Footnotes
Acknowledgements
The authors would like to acknowledge the support and encouragement of the Principal, JSS College of Pharmacy and JSS AHER. We express sincere thanks to all the faculty and students in the immunization center, Department of Paediatrics at JSS Hospital for their support. Special thanks to the Information Technology Department of JSS Hospital for the maintenance of the digital registry.
Declarations
Supplemental material
Supplemental material for this article is available online.
References
Supplementary Material
Please find the following supplemental material available below.
For Open Access articles published under a Creative Commons License, all supplemental material carries the same license as the article it is associated with.
For non-Open Access articles published, all supplemental material carries a non-exclusive license, and permission requests for re-use of supplemental material or any part of supplemental material shall be sent directly to the copyright owner as specified in the copyright notice associated with the article.