
Abstract
Introduction:
Imaging-based diagnosis of intra-axial contrast-enhancing brain tumors is frequently challenging. We show that the diagnosis of medulloblastoma (MDB) versus pilocytic astrocytoma (PA) and ependymoma (EPM) profit from computational analyses, based on quantitative image properties (i.e. textural features from apparent diffusion coefficient (ADC)-maps) and an automated machine learning classification (random forests (RF)).
Methods:
Forty patients who were diagnosed with three types of brain tumors were included in this study: 16 with MDB, 4 with PA, and 10 EPM. Based on the analysis of multi parametric preoperative magnetic resonance images, neuroradiologists gave a clear-cut diagnosis if they were sure of the diagnosis; however, most diagnoses comprise several possible tumor types. To distinguish between the named tumor types, a computer-based differential diagnosis (DD) tool was developed. Tumor lesion volumes were manually defined using ADC-maps only. From the demarked ADC-map, texture-parameters were extracted to train RF classifiers for pairwise DD. Performance of the RF models and reproducibility of the manual segmentation were evaluated.
Results:
Neuroradiologists gave correct and clear-cut diagnoses for 31% of MDB, 14.3% of PA, and 10% of EPM. Most diagnoses comprised several tumor types and altogether diagnoses containing the right tumor were given in 69% of true MDB, 64% of true PA, and 30% of true EPM. Ambiguous diagnoses could be improved by RF classifiers showing the following PA versus MDB performance: sensitivity 0.888 ± 0.031, specificity 0.886 ± 0.036; EPM versus MDB: sensitivity: 0.938 (95% CI = (0.677, 0.997)) and specificity: 0.7 (95% CI = (0.354, 0.919)); EPM versus PA: sensitivity: 0.786 (95% CI = (0.488, 0.942) and specificity: 0.100 (95% CI = (0.005, 0.458). An inter- and intra-rater analysis (three human raters) was performed and the Fleiss’ kappa test revealed high inter-rater agreement of κ = 0.821 (p value << 0.001) and an intra-rater agreement of κ = 0.822 (p value << 0.001).
Conclusion:
In the frequent case of ambiguous neuroradiologist diagnoses, a subsequent differential RF classification improves the diagnoses in all cases. The largest benefit is gained for the discrimination PA versus MDB with an accuracy of 88.0 ± 3.0% followed by EPM versus MDB with an accuracy of 84.6%.
Keywords
Introduction
Noninvasive differentiation between medulloblastoma (MDB), pilocytic astrocytoma (PA), and ependymoma (EPM) using conventional magnetic resonance imaging (MRI) techniques is frequently prone to misinterpretation, since these tumors may have similar appearance on, for example, diffusion-weighted imaging (DWI), T2w/Fluid-attenuated inversion recovery (FLAIR), and T1 contrast-enhancing images. To illustrate the difficulty to distinguish these diseases by visual inspection, Figure 1 displays the apparent diffusion coefficient (ADC)-maps of three typical patients suffering from the above mentioned tumor types. A major difference between the tumor classes is achieved by the cellular density and organization patterns, which directly influence the diffusivity of protons in the extracellular space, which is characterized by the so-called ADC. Many studies using ADC-map information in diagnosing brain tumors have been performed. For instance, Rumboldt et al. 1 found significant differences in ADC mean value between PA, MDB, and EPMs. Schneider et al. 2 used the combined value of DWI and proton magnetic resonance spectroscopy (1H-MRS) for the same differential diagnosis (DD). Yamashita et al. 3 found that minimum apparent diffusion coefficient is significantly correlated with cellularity and found differences between the tumor types. Jaremko et al. 4 showed that MDB and PA could be differentiated but EPM could not be reliably differentiated from MDB or PA. Gimi et al. 5 used a tumor/normal brain ADC-ratio threshold and used ratio thresholds only for tumor discrimination. Bull et al. 6 used more sophisticated ADC-based histogram parameters to discriminate the tumors, however, on a very small number of patients. Koral et al. 7 studied the impact of diffusion MRI on accuracy of visual diagnoses, and concluded that ADC-maps help to improve the diagnosis. Pierce and Provenzale 8 also found that minimal ADC values can be used to differentiate brain tumors. Another method for differentiating these brain tumor types was proposed by Gutierrez et al., 9 using support vector machine-based classifiers using ADC histogram features that yielded very good discrimination among pediatric posterior fossa tumor types, and ADC-extracted textural-features that show promising results for further subtype discrimination. The approach of Gutierrez et al. 9 uses classification algorithms applied to radiological image data for diagnosis. Such an approach in diagnostics can be regarded as computer-aided radiological diagnostics (CARD).

Illustrative ADC-maps of three patients suffering from (a) PA, (b) MDB, and (c) EPM. By only visual inspection, it is very difficult to distinguish these brain tumors from each other. As shown in this article, quantitative texture parameter analysis, combined with machine learning can improve diagnostic accuracy substantially. PA: pilocytic astrocytoma; MDB: medulloblastoma; EPM: ependymoma.
In this article, we describe a different type of CARD method aiming at application in a clinical routine setting. This approach is based on random forests (RF) of Breiman. 10 Our novel semiautomatic CARD method should enable the neuroradiologist in daily clinical routine to obtain support for choosing the most likely diagnosis (in this case PA, MDB, or EPM). The presented method is also based on ADC-map features as MRI surrogate markers to tumor-specific molecular processes. The method combines expert-based segmentation of the complete tumor-affected volume, with RF classification for diagnosis. Since the contouring of the tumors is performed manually, it’s inherent that the reproducibility cannot be 100%. Hence it is to be conceivable that the RF classification performance, that is diagnostic performance, will be randomly influenced by this. One aim of this study is to evaluate how big the inter- and intra-rater influence of manual segmentation is on the RF-classification performance, in order to test the robustness of the classifiers obtained.
The following research questions were investigated: (1) how does the CARD method performs compared to expert-based diagnosis, (2) does the intra- and inter-rater variability in segmentation affect the RF prediction, and (3) is it possible to improve the individual clinical diagnosis, without the need of additional image data, that is, by utilizing the available digital MRI information and previously confirmed diagnoses in a quantitative way.
Methods
Included patients
Patients with newly diagnosed and histologically confirmed PA, MDB, or EPM, preoperatively submitted to our institution between January 2009 and July 2015, were included in this retrospective study. Exclusion criteria were incomplete image acquisition and previous cranial neurosurgery. Quantitative brain tumor textural information of a total of 40 patients was extracted from ADC-maps only. The ADC-map data were either acquired in each of our standard brain tumor protocols or from ADC-maps outside our institution. Therefore, except for one patient, all ADC-maps were, however, acquired on the scanners of the same manufacturer. All clinical diagnoses, which served as ground truth, were histologically certified.
Ethics
This retrospective study was performed conform to the Swiss Human Research Act and was approved by the Bernese Cantonal Ethics Committee (KEK-Berne, Switzerland).
Magnetic resonance imaging
Several different 1.5 T MR-scanners (Siemens Erlangen, Germany) from the same manufacturer have been used to record the apparent diffusion ADC-maps. The images were recorded typically on a 128 × 128 image k-space matrix and interpolated by zero-filling to a 256 × 256 image reconstruction matrix. The manufacturers’ standard product EPI-pulse sequences with a typical TE = 89 ms and TR = 3000 ms was used. The slice thickness was 5.0 mm with a gap of 1.5 mm between the slices. The interpolated pixel size was typically in the order of 1.2 × 1.2 × 5.0 mm3. Since data from various scanners and hospitals were over a time period of more than 10 years, the MR-acquisition parameters were not identical in all cases.
Extraction of image features
The CARD method which is used in this article is a radiomics variant (see e.g. Lambin et al. 11 ), due to the fact that it combines image feature extraction with machine learning. Please refer to the Online Supplementary Material for more details on the method variant of this article, more specifically, how exactly the image feature extraction was performed.
RF classifiers in diagnostics
Classifiers can be viewed as algorithms that can decide between several possible diagnoses, that is, they return the most likely diagnosis class. The main requirement is that the patient data used for the training of the classifier are representative for de novo patients. In this article, RF classifiers as proposed by Breiman 10 were used. This type of classification has been used in a large number of studies performed in different fields of application 12,13 and carry a high prediction accuracy (see e.g., Breiman, 10 Liaw and Wiener, 14 Strobl et al. 15 ). The RF consist of several hundred different decision trees. Each decision tree corresponds to a set of rules that leads for each feature set to a clear-cut diagnosis along with a probability measure (in case of equal probabilities for each diagnosis, the decision is taken at random). Each tree is trained on a different bootstrap sample of the training data.
During training, the split rules are optimized such that the training observations with known diagnosis label get most possible unmixed with regard to their diagnosis labels. If a new observation follows the decision rules and ends up in one leaf of the tree, then the probability for a certain diagnosis is given by the proportion of this diagnosis among all training observations corresponding to this leaf. That diagnosis which gets the majority of the votes of the RF-classifier is the predicted clinical diagnosis.
The diagnosis of the whole RF is derived by letting the trees majority prediction vote or by averaging the probabilities over all trees and pick the diagnosis with the highest probability. Aggregation of many independent and unbiased predictions yields in general a highly accurate prediction since the variance of the individual classifications is averaged out. The performance is given as out-of-bag (OOB) error, which corresponds to the misclassification rate of the classifier when each observation is only classified with that subset of trees that did not have this observation in the bootstrap training set. Therefore, we expect the OOB error rate to resemble the test error rate when classifying completely new patients with the RF.
Application of computer algorithms in neuroradiology to aid the neuroradiologist in finding the most likely diagnosis can be called CARD. A software was developed to make CARD practically feasible in a clinical setting offering the following functionality: (i) a simple way to create novel disease specific databases; (ii) add the relevant radiological data of patients for which histological asserted findings are available into these databases; (iii) automatic training of RF classifiers based on this data; and (iv) extracting the same type of image data for new, for which the diagnosis is unclear; (v) performing the diagnosis, based on a given DD formulated by the neuroradiologist. In Figure 2, the principle of CARD is displayed. A prototype software for these purposes was developed in our institute in the programming language JAVA (version 1.7), using the RCaller-class (version 2.0.7) 16 to enable the usage of the R-implementation Breimans’ RF algorithm 10 to perform the classification.

Principle of CARD. The extracted image and clinical data of N patients having histologically certified tumor diagnosis are stored into a database. With these data, RF classifiers can be computed for any given DD. For the (N + 1)th patient, for which only a DD can be defined, the same image-related parameters are extracted. With these data and the DD, the RF classifier computes the most likely diagnosis. CARD: computer-aided radiological diagnostics; DD: differential diagnosis; RF: random forests.
Computed texture features
In the first step, the developed computer program computed for each ADC-map a total of 17 derived texture maps (see Figure 3 for an illustrative example for a PA). A graphical interpretation of the relationship between the original ADC-map and its associated texture parameter maps and texture parameters is displayed in Figure 4. From these texture maps, a total of 94 texture parameters are computed. More details on the computation of the used texture parameters are given in the Online Supplementary Material.

Texture maps of the ADC-values of a patient suffering from PA. The image shows the ADC-map itself, all 17 texture parameter maps that are output of the developed software. All maps were color-coded using a rainbow color map lookup table: highest values in red, lowest values in blue. PA: pilocytic astrocytoma; ADC: apparent diffusion coefficient.

Graphical model of the relationship between the measured ADC-map (red box, also denoted as ORIG), the texture parameter maps computed from it (yellow boxes), and finally the texture parameters (green ellipsoid) that were taken as feature inputs of the RF classification algorithm. ADC: apparent diffusion coefficient; RF: random forest.
Manual tumor segmentation and reproducibility of classifiers
Three independent raters segmented the tumor volume slice by slice in the ADC-maps of all 40 included PA, MDB, and EPM patients, by drawing manually contours that surround the complete tumor-affected tissue (i.e. solid parts and edema). Per slice, per contour, and per texture map 94 texture parameters are computed. The number of pixels within one contour defines the weighting factor for computation of the averaged mean value of the parameter over all slices. In this fashion, 94 texture parameters are obtained per patient to characterize the tumor. These values are the input features of the RF algorithm.
Measures for neuroradiological diagnostic performance
To investigate the diagnostic neuroradiological performance in our department, we retrospectively analyzed the neuroradiological diagnostic texts, stored in our institutes’ Radiological Information System (RIS)-system for all study patients. All diagnostic texts in our institute are based upon the four-eyes principle, where a junior neuroradiologist and a senior neuroradiologist analyze all images of the examination. Additionally, the final diagnostic text is approved by a senior neuroradiologist.
To evaluate the diagnostic performance, we created a diagnostic score (DS). Three possible situations were discriminated: (1) the neuroradiological diagnosis was correct and identical with the histological and the best possible DS = 100% is assigned; (2) the correct DD was within the formulated stating
Demographical data: sex (male:female), and mean age in years ± standard error of patients with different tumor types.

PA: pilocytic astrocytoma; MDB: medulloblastoma; EPM: ependymoma.
ADC values (in 10−6 mm2/s) information grouped by disease type and a p value corresponding to an ANOVA testing for differences between all three groups.
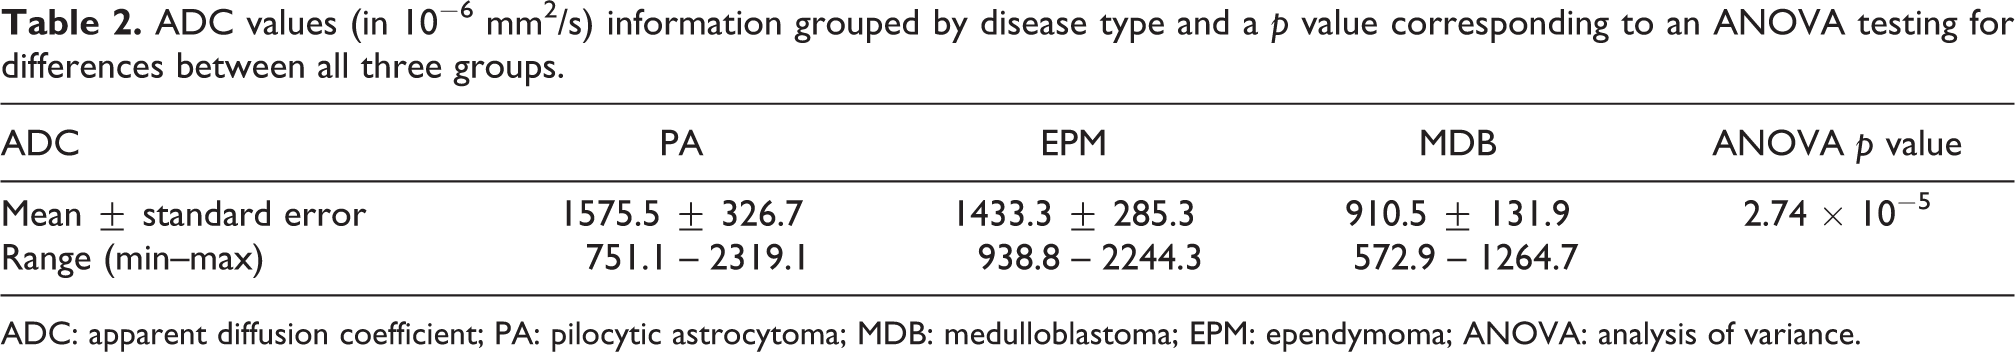
ADC: apparent diffusion coefficient; PA: pilocytic astrocytoma; MDB: medulloblastoma; EPM: ependymoma; ANOVA: analysis of variance.
Results of two-group comparison of ADC values given as multiple testing corrected p values from Wilcoxon rank sum tests.
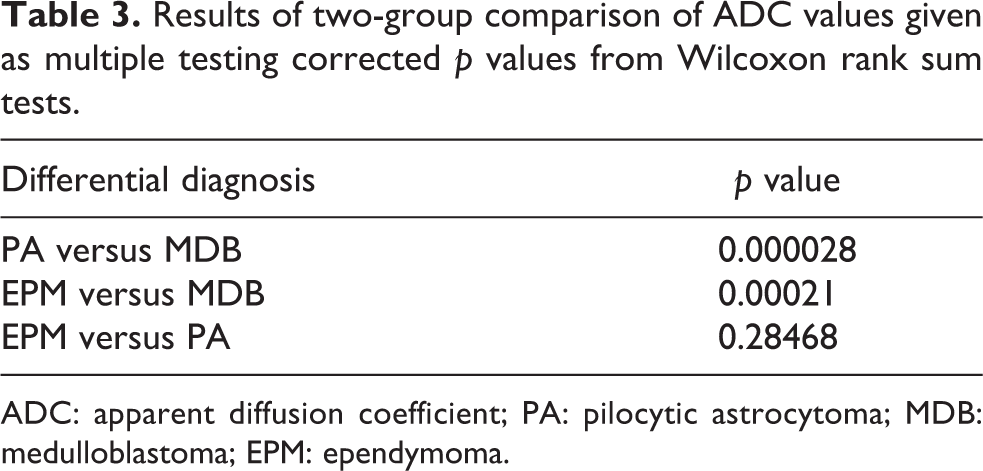
ADC: apparent diffusion coefficient; PA: pilocytic astrocytoma; MDB: medulloblastoma; EPM: ependymoma.
Confusion matrix for the inter-rater and intra-rater reproducibility of the CARD method applied to the DD of MDB versus PA.

CARD: computer-aided radiological diagnostics; PA: pilocytic astrocytoma; MDB: medulloblastoma; EPM: ependymoma.
The variability on the classification performance parameters (sensitivity, specificity with their CI boundaries CI-min and CI-max) due to inter-rater and intra-rater differences in contouring was examined for the DD of MBD versus PA.a

CI: confidence interval; DD: differential diagnosis; PA: pilocytic astrocytoma; MDB: medulloblastoma; OOB: out-of-box; CI-min: minimal 95% confidence range; CI-max: maximal 95% confidence range.
a R1.1, R1.2, and R1.3 refer to one single rater doing three different evaluations and reveals information on the intra-rater variability. Raters R1, R2, and R3 are three different independent raters and reveals information on the inter-rater variability. The errors indicated are standard errors.
RF classifier performance of the classifiers for the DD of PA versus MDB and EPM versus PA.a

CI: confidence interval; DD: differential diagnosis; PA: pilocytic astrocytoma; MDB: medulloblastoma; OOB: out-of-box; RF: Random Forest; CI-min: minimal 95% confidence range; CI-max: maximal 95% confidence range.
a The best classification performance obtained is indicated. Apart from the sensitivity and specificity, the OOB error rate estimates are indicated.
Histological diagnosis compared to the radiological diagnosis for PA.

PA: pilocytic astrocytoma; MDB: medulloblastoma; EPM: ependymoma; DD: differential diagnosis; DS: diagnostic score; PNET: Primitive NeuroEctodermal Tumor; WHO: World Health Organization.
Histological diagnosis compared to the radiological diagnosis for EPM.

PA: pilocytic astrocytoma; MDB: medulloblastoma; EPM: ependymoma; DD: differential diagnosis; DS: diagnostic score.
Histological diagnosis compared to the radiological diagnosis for MDB.

PA: pilocytic astrocytoma; MDB: medulloblastoma; EPM: ependymoma; DD: differential diagnosis; DS: diagnostic score.
Results
Study population
A total of 40 patients were retrospectively analyzed. All patients received their preoperative MRI scan from January 2005 until July 2015. A total of 14 PAs, 16 MDBs, and 10 EPMs were included. Quantitative textural information was extracted from ADC-maps described above. For demographics, please see Table 1.
Comparison of average tumor ADC values
In addition to the textural analysis, the group-mean ADC values for the three different tumor types were computed and are listed in Table 2. For the three different tumor types, a significant difference between group-means was found regarding the tumor average ADC values. Equivalent values are reported by other authors in the past.1,9,17
To further assess where the ADC differences between the three tumor types arise, we used the Wilcoxon rank sum test for two-group comparisons. The Benjamini–Hochberg method to correct for multiple testing was used. Strong evidence for differences in ADC group-means when comparing PA versus MDB or EPM versus MDB with p < 0.001 (see Table 3) was found.
Intra- and inter-rater reliability
We base this reliability analysis on the two-group comparison of PA versus MDB.
Inter-rater variability
Three raters (R.1, R.2, and R.3) have segmented the tumors and used the RF classification for a CARD diagnosis. The Fleiss’ kappa test used to quantify the agreement of the diagnosis results revealed a κ = 0.821 with z = 7.79, and a p value = 6.88 × 10⁻¹⁵ (Subjects = 30). For a graphical interpretation of the classifier performance as a function of the rater, the confusion matrix is displayed in Table 4.
Intra-rater variability
One rater has segmented the tumors on three different days one time and used the RF classification of each segmentation to obtain three times a separate CARD diagnosis for the same case. The Fleiss’ kappa test used to quantify the agreement of the diagnosis results revealed a κ = 0.822 with z = 7.15 and p value = 6.22 × 10⁻¹⁵ (subjects = 30). The confusion matrix is also given in Table 4.
From this, we can conclude that the inter-rater as well as the intra-rater agreement is very high.
Classification performance
The overall classification-error rate performance for five times repetitive contouring (thus averaging over inter- and intra-rater results) was 11.3 ± 2.7%. The average sensitivity was 0.888 ± 0.031 and the average specificity was 0.886 ± 0.036 and together with the individual scores they are listed in Table 5.
Diagnostic performance of the RF-based CARD method
In Tables 5 and 6, the performance of the classifiers to distinguish between MDBs, PAs, and EPM are
For the MDB versus PA DD, an average sensitivity of 0.888 ± 0.031, an average specificity of 0.886 ± 0.036, and an accuracy of 88.0 ± 3.0% was obtained, with an OOB error rate of 11.3 ± 2.7% (Table 5). The intra-rater variability alone was additionally computed, and a mean sensitivity of 0.896 ± 0.042 was obtained; for inter-rater variability of the sensitivity, a value 0.882 ± 0.036 was found. For the intra-rater variability of the specificity, a value of 0.929 ± 0.041, and for inter-rater specificity, a value of 0.893±0.040 was found.
The EPM versus MDB DD was not part of the reproducibility study, and the classifier was determined only once. A sensitivity of 0.938 with 95% CI range of (0.677, 0.996), and a specificity of 0.70 with 95% CI range of (0.353, 0.919), the mean accuracy was 84.6% and the mean OOB error rate was 15.38% (Table 6).
Also for the PA versus EPM, DD was not part of the reproducibility study but the performance of the classifier was determined. Here a sensitivity of 0.786 with 95% CI (0.488, 0.943), specificity was only 0.100 with a 95% CI (0.005, 0.459) (see Table 6), and the mean accuracy as well as the OOB error were both 50%.
Clinical differential diagnostic performance
Tables 7 to 9 list the diagnostic performance of neuroradiologist to diagnose the tumor types correctly. The neuroradiologists had access to all multiparametric images of the complete MR-examination (including at least T 1, T 1,c, T 2, FLAIR, and ADC imaging). However, the neuroradiologists had to decide between all possible tumor types, which is a much more demanding task than CARD as described here, namely to decide between given disease alternatives.
The best performance was obtained for the diagnosis of MDB, for which in 31.25% of the cases there was a single correct diagnosis, and in 37.5% of the cases a correct DD was formulated: therefore in a total of 68.75% of the cases, the diagnosis contained MDB as alternative. The DD score DS mean was 46.9%, weighting the DS with the amount of differentials stated by the neuroradiologist (see the definition above).
Second best diagnostic performance was obtained for PA, with only 14.3% correct diagnoses and 50.0% stating the correct DD (making 64.3% correct or correct DD). However for PA, a DD score DS mean of 30.5% was obtained.
For radiologists, the most difficult diagnosis seems to be that of EPM. Here only a correct radiological diagnosis score of 10% was obtained and in 20%, a correct DD. This makes a total of only 30% for correct or correct DD. With a DD score DS mean of just 17.6%, it is clear that diagnosis of this type of brain tumor is the most difficult to diagnose out of the three types examined in this article.
Discussion
Observed ADC values
We have determined the ADC-mean values and standard deviations for PA, EPM, and MDB and obtained results which are comparable to the ADC values published earlier in a pediatric cohort study and other studies 2,9,1,18 despite the high age variation in our group. MDB showed significantly lower ADC values than PA and EPM, whereas EPM and PA showed similar ADC values not finding evidence for significant different mean values.
Clinical routine tumor DD performance
Tables 7 to 9 give insight into the performance of tumor diagnostics in daily routine. Neuroradiologists give infrequently preoperative clear-cut diagnosis. In our study with 40 patients, correct and clear-cut diagnosis was given for 31% of 16 MDB tumors, 14.3% of 14 PA tumors, and 10% of 10 EPM tumors. Most of the diagnosis comprises several tumor types and together with the clear-cut diagnosis the neuroradiologists diagnosis contained the right tumor in 69% of true MDB, 64% of true PA, and 30% of true EPM. DD scores DS mean for the three tumor types were determined and are listed in Table 6. With a DS mean of 57% for MDBs, this tumor type was best distinguished and most frequently correct, on average the DD contained less than two alternatives. For PAs, on average nearly three possible tumor types were formulated in the DDs, and for EPMs even more than three tumor type differentials were formulated. These numbers show that visual discrimination of these tumor entities is an extremely challenging task for the human visual system, even having access to multiple MR modalities beside the ADC-maps.
Computer-aided radiological diagnostics
It should be noted that the CARD-algorithms starts with a DD formulated by a neuroradiologist. For the clinical important DDs of MDB versus PA and EPM versus MDB, useful RF classifiers could be developed. For the DD between MDB and PA, the best performance was observed, namely an average sensitivity of 0.888 ± 0.031 and specificity of 0.886 ± 0.036 with an average classifier OOB error of 11.3 ± 2.7%. This means that for this DD, application of CARD could substantially improve radiological diagnostic quality. The DD between EPM and MDB, however, was little less performing, with a sensitivity of 0.938 and specificity of 0.700 together with accuracy of 84.6%.
For the DD between PA and EPM, which has a sensitivity of 78.6%, a specificity of only 10% was found. With such a poor performance, it is clear that such a classifier cannot be used in practice. One has to conclude from this that PA and EPM do not differ sufficiently in ADC-heterogeneity parameters in such a way that they could be used to distinguish these diseases from each other’s in a meaningful way. A substantial improvement is expected in case more data and additional image series of the MRI-examination (e.g. perfusion imaging) are provided for the RF training and classification.
Dependency of CARD results on rater segmentation
Since the CARD method depends on manual segmentation of the complete tumor-affected area, the classification performance could, in principle, strongly depend on the individual segmentation of each individual rater. Therefore, a reliability analysis was performed to investigate the reproducibility of the CARD diagnosis. For the inter- and intra-rater reproducibility, a Fleiss’ kappa test value of κ = 0.821, 0.822, respectively, was found, which means that there is a very high agreement in obtained classifiers. 19 Since the inter-rater and intra-rater reproducibility seems to be nearly identical, one may conclude that small differences in the human contoured tumor volumes do not really affect classification performance. Additionally one rater can reproduce its contouring as good as different raters among each other’s. It can be concluded that the task to segment to “whole tumor affected volume” can be reproduced to a high level of agreement.
Diagnostic performance of machine versus man
For the presented CARD method, it is not possible to directly compare the diagnostic performance of the machine to the human diagnostic performance. We want to emphasize that the success of any CARD method depends on the posed DD by the neuroradiologist, that is, a DD in which the correct diagnosis needs to belong to the solution set. The performance of the RF is quantified by the probability to find the correct diagnosis within a DD. This probability is given by one minus the OOB-class error. However, in practice, this performance needs to be down-corrected with the probability of a correctly posed DD by the neuroradiologist (see Tables 7 to 9). Moreover, neuroradiologists frequently indicate in their DD more than two options (DS mean takes into account the number of options). In these cases, several trained RFs need to be applied to determine which tumor we are dealing with.
Practical benefit of CARD
In practice, knowing the tumor type is critical for the therapeutic option stratification, for example, deciding and planning the extent of resection. However, based on MRI scans, neuroradiologists can often give only a set of possible tumor types. In such cases, the presented CARD results are valuable. Since the presented semiautomatic statistical method for CARD can be performed time-efficiently, it is feasible for the usage in clinical practice. The accuracy of the method can be further improved by also taking other modalities into account, for example, textural information derived from FLAIR or T 1c-imaging. Combination with complete automatic segmentation algorithms like Porz et al. 20 could improve the reproducibility of the method further.
Limitations
Our patient collective is relatively small for further sub-classification or investigation of genetic differences. Again one should realize that a classifier can only be used for the purpose it has been trained. The classifier can only provide more confidence about the diagnosis, if the DD includes the correct diagnosis. It should be noted that this is not only the case for the proposed CARD but is true for all machine learning-based classifiers.
Conclusions
Reproducible and highly accurate, sensitive and specific classifiers for CARD can be obtained by feeding texture parameters extracted of ADC-maps only into an RF classification algorithm for deciding which brain tumor is most likely in the DDs of PA versus MDB or MDB versus EPM. For the DD of PA versus EPM, the classifiers were less accurate, specific, and sensitive but still can be used to improve the clinical neuroradiological diagnostics. Interesting aspect of the presented CARD method is the fact that all data of the past can simply be used to enhance the diagnostics of future patients.
Supplementary material
Supplemental_Material - Computer-aided radiological diagnostics improves the preoperative diagnoses of medulloblastoma, pilocytic astrocytoma, and ependymoma: A reproducibility study
Supplemental_Material for Computer-aided radiological diagnostics improves the preoperative diagnoses of medulloblastoma, pilocytic astrocytoma, and ependymoma: A reproducibility study by Nicole Porz, Urspeter Knecht, Beate Sick, Elvis Murina, Nuno Barros, Philippe Schucht, Evelyn Herrmann, Jan Gralla, Roland Wiest, Marwan El-Koussy, and Johannes Slotboom in Clinical and Translational Neuroscience
Footnotes
Authors’ note
Nicole Porz and Urspeter Knecht are equally contributing first authors.
Declaration of conflicting interests
The author(s) declared no potential conflicts of interest with respect to the research, authorship, and/or publication of this article.
Funding
The author(s) disclosed the receipt of the following financial support for the research, authorship, and/or publication of this article: This work was funded by the Swiss National Foundation, grant number 140958.
Supplementary material
Supplementary material for this article is available online.
References
Supplementary Material
Please find the following supplemental material available below.
For Open Access articles published under a Creative Commons License, all supplemental material carries the same license as the article it is associated with.
For non-Open Access articles published, all supplemental material carries a non-exclusive license, and permission requests for re-use of supplemental material or any part of supplemental material shall be sent directly to the copyright owner as specified in the copyright notice associated with the article.