
Abstract
Background:
The choice between locking and nonlocking plates for ankle fracture fixation is guided by implant cost, patient factors, fracture morphology, and clinical outcomes. Locking plates offer increased stability, particularly in osteopenic bone, and are available in low-profile, anatomically precontoured designs, though they are generally less malleable than nonlocking plates and are associated with higher cost. This study evaluates the cost-effectiveness of these methods by PROMIS (Patient-Reported Outcomes Measurement Information System) scores and complication rates. The primary outcome was defined as postoperative PROMIS pain interference and physical function scores.
Methods:
We conducted a retrospective review of ankle fracture fixations at our institution from 2016 to 2021. Surgical cost, outcome, and complication data were obtained through chart reviews. PROMIS scores were collected via structured telephonic interviews. PROMIS scores were analyzed with 2-sided t tests (Python 3.11.4, SciPy). Complication rates were evaluated with χ2 tests (Python 3.11.4, statsmodels).
Results:
Of 493 patients, 283 received locking plate fixation and 210 nonlocking. Locking plate fixations cost 3.61 (95% CI: 2.81-4.64) times as much as nonlocking plate fixations, and reoperations cost 4.15 (95% CI: 1.11-15.47) times more. PROMIS pain interference and physical function scores did not differ significantly. Complications requiring reoperation occurred in 17.31% of locking plate patients and 21.9% of nonlocking plate patients (P = .20). Hardware removal occurred more often in the nonlocking group (P < .001), whereas infection was more frequent with locking plates (P < .05).
Conclusion:
Locking plates are significantly more expensive than nonlocking plates and did not demonstrate statistically significant differences in union rates, complication rates, or PROMIS scores between patients in this retrospective cohort. However, nonlocking plates had higher rates of uncomplicated syndesmotic screw removal rate whereas locking plates were associated with increased deep infection, resulting in a greater cost of reoperation compared with nonlocking plates. Although conclusions are limited by the study’s retrospective nature and a significantly greater proportion of elderly and female patients in the locking plate cohort, it appears to demonstrate similar PROMIS scores and union rates outcomes.
Level of Evidence:
Level III, retrospective cohort study.
Introduction
Ankle fractures are a common traumatic orthopaedic injury, affecting approximately 184 in 100,000 adults annually. 4 Within the elderly population, ankle fractures are the third most common fracture type and are expected to triple in incidence by 2030.10,12 Similarly, the volume of ankle fixation procedures has been increasing, with an estimated growth of 72% between 2005 and 2014, as surgical intervention is the gold standard for management of unstable traumatic injuries.3,10
However, there is notable variation in operative technique and cost associated with these surgeries, predicated on the decision to use either locking or nonlocking plates. 1 As a result, overall cost estimates for these surgeries include significant variability according to regional and institutional idiosyncrasies. 1 In the US Medicare population alone, ankle fixation represented an economic burden of more than $650 million in 2011. 16 Some data suggest that limiting the unwarranted use of the more expensive locking plates could meaningfully reduce the annual cost of ankle fixations.6,16
The proportion of surgeries using locking plates has increased in recent years, up to 34% in 2019. 14 Locking plates have screws that anchor directly into the plate via threaded heads, creating a fixed-angle construct that does not rely on compression at the bone-plate interface. 13 The significant low profile provides a desirable fit and congruity to the lateral malleolus and the fibula. This construct minimizes interference with the periosteum and vascular supply of the bone and provides angular stability. In clinical practice, locking plates offer distinct advantages in specific scenarios. In osteopenic bone with low bone mineral density, conventional nonlocking plates may fail because of insufficient screw purchase and loosening. 13 However, locking plates maintain fixation strength independent of bone quality, making them particularly appealing for use in elderly patients and complex fractures. These benefits must be weighed against certain drawbacks. Locking plates are more expensive and may not reduce complication rates, such as infection or hardware removal, compared with nonlocking plates.6,8 Nonlocking plates remain a cost-effective option and can achieve similar functional outcomes and union rates when bone density is sufficient.6,10
Although several studies have examined the differences in clinical outcomes between locking and nonlocking plates, few have evaluated cost-effectiveness based on patient-reported outcomes, an important metric with demonstrated reliability across orthopaedic literature.6-8,19,21 Therefore, the purpose of the present study is to provide a robust, cost-informed efficacy analysis of anatomic locking and nonlocking plates for ankle fractures as validated by clinical and patient-reported outcomes in order to better guide clinician decision making.
Methods
We conducted an institutional review board–approved retrospective cross-sectional exploratory analysis using data from patients undergoing traumatic ankle fracture fixation at our institution between January 2016 and December 2021. Our inclusion criteria were defined as all patients ≥18 years of age. Patients were not excluded on the basis of demographic information, including language or sex. Entries without clinical follow-up records and duplicate records were excluded. Open fractures and pilon fractures were also excluded. The majority of fractures included in the data set were unstable external rotation-supination Weber B fractures. Locking plate procedures used either an Acumed Lateral Fibula Plate or a Stryker Pangea Plate. Nonlocking plate procedures used a Synthes one-third tubular plate.
Primary outcome measures of interest included in our analysis were PROMIS scores, cost, complications, and reoperation rates. PROMIS pain interference and physical function scores were designated as the primary outcome measures for comparative effectiveness. Specifically, PROMIS 2.0 physical function short form 10a and PROMIS 1.1 pain interference short form 8a were used to assess patient-reported outcomes. Physical function short form 10a comprises 10 questions with a maximum raw score of 50. Pain interference short form 8a comprises 8 questions with a maximum raw score of 40. These PROMIS forms are scored by converting the raw scores to T scores standardized to have an average of 50 and a standard deviation of 10, wherein a higher score for physical function is indicative of better function, and a higher score on pain interference is indicative of worse function. 9 The PROMIS computer adaptive test has demonstrated validity in a foot and ankle cohort.11,19 Medical students blinded to the fixation method contacted patients by telephone to complete interviews using the Patient-Reported Outcomes Measurement Information System (PROMIS) framework of assessment.11,19 Data on sex, race, age, BMI, procedure cost, reoperation cost, and subsequent complications were collected from our institutional database. Reoperations included plate and screw removals, screw removals, Kirschner-wire removals, and incision and drainage procedures for joint infection. Data on patient comorbidities were not available and were not evaluated.
Two-sided t tests were used to assess the relationship between PROMIS scores and fixation type, as well as the association between cost and fixation type, using the SciPy library (version 1.15.1). χ2 analysis was performed to evaluate complication rates by fixation type, using the statsmodels module (version 0.14.4). Fisher exact test was applied for complication subtypes where appropriate, because of low event frequencies and small expected cell counts in the 2 × 2 contingency tables under the null hypothesis. To compare costs between fixation types, we calculated the mean cost ratio and constructed 95% CIs by applying a log transformation to the cost ratio, estimating the standard error of the log ratio, and exponentiating the resulting confidence bounds. This approach accounts for the skewed distribution of cost data and provides interpretable estimates of relative cost differences. All statistical tests were conducted at an alpha level of .05. Given the retrospective nature of the study, randomization was not possible, as patients were grouped based solely on their type of ankle fixation. All analyses were performed using Python (version 3.11.4; Python Software Foundation, Wilmington, DE).
Results
Cohort Demographics
Over the study period from 2016 to 2021, a total of 756 patients who underwent ankle fixation were available within our institutional database. Application of the above-listed inclusion and exclusion criteria produced a study cohort of 283 patients who underwent fixation with a locking plate and 210 patients who underwent fixation with a nonlocking plate. Two-thirds (62.9%) of patients undergoing locking plate fixation and 51% of patients undergoing nonlocking plate fixation were women (P < .01). The locking group also had a higher median age of 51 (IQR: 24.5-64) compared with the nonlocking group’s median age of 35 (IQR: 27-46). The difference in median age was statistically significant (P < .01). No significant differences were found between the two groups with respect to BMI (P = .98), smoking status (P = .06), or race (P = .70). The study cohort is described in Table 1.
Demographic Characteristics of the Study Sample.
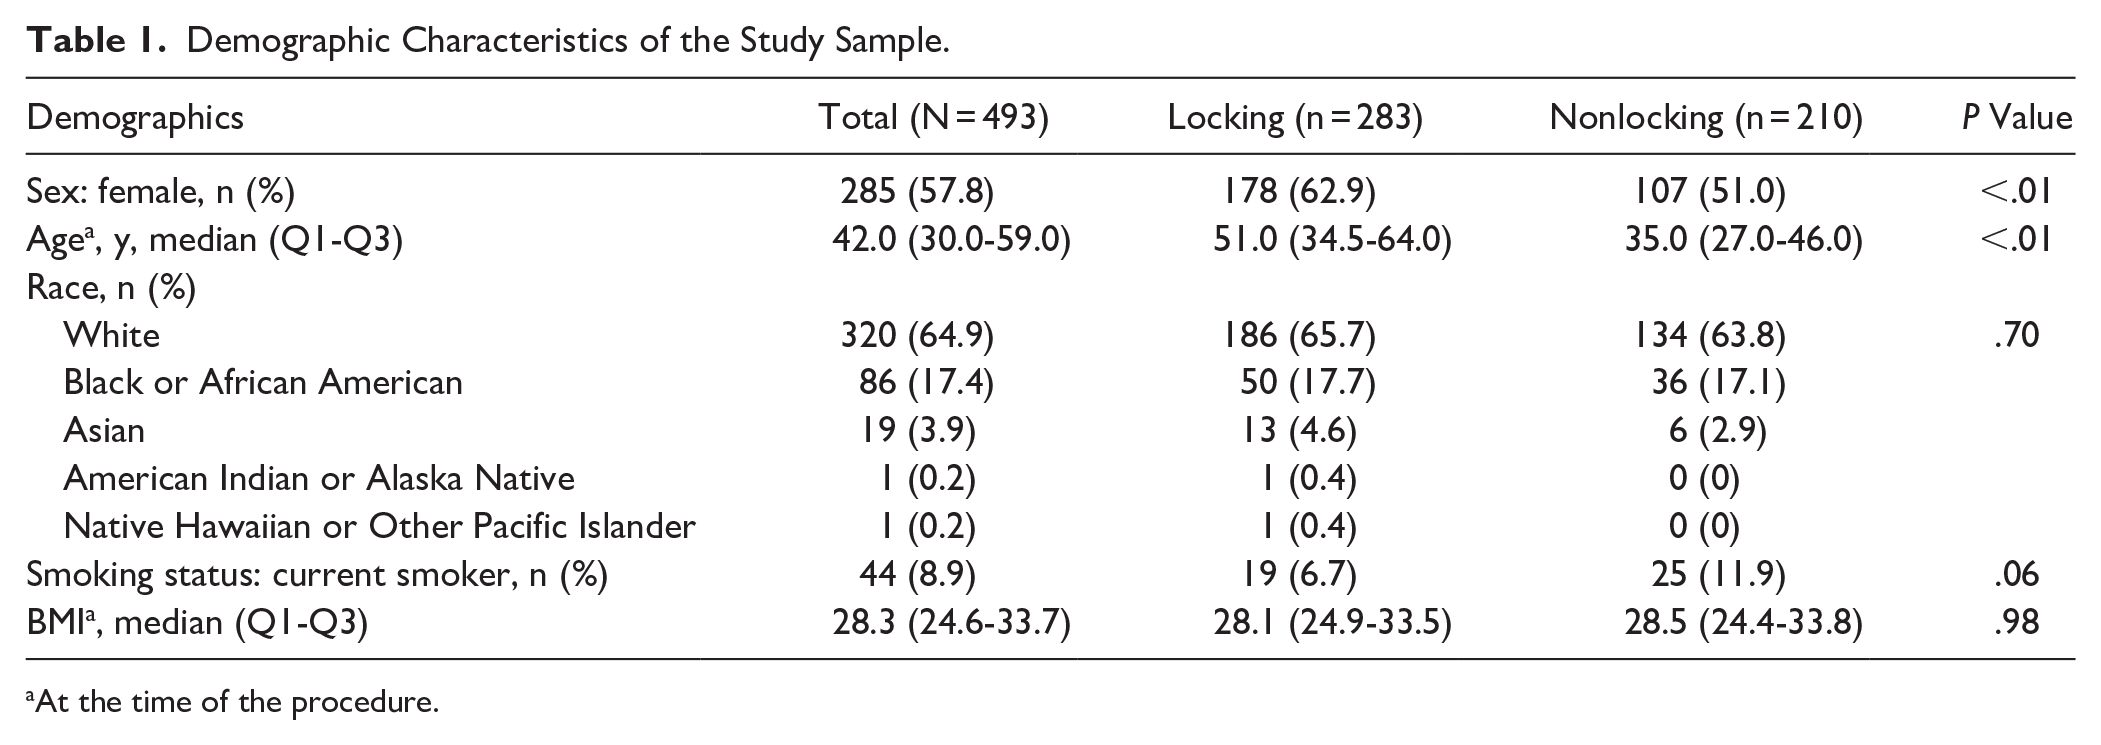
At the time of the procedure.
Cost by Fixation Type
Overall operative cost of ankle fracture fixation with locking plates was 3.6 (95% CI: 2.81-4.64) times as much as fixation with nonlocking plates (Table 2). The specific implant cost mirrored this trend, as locking plates cost 5.80 (95% CI: 4.04-8.31) times as much as nonlocking plates. This relationship also held true when evaluating the costs associated with revision of the more expensive locking plate, with locking plate reoperations costing as much as 4.15 (95% CI: 1.11-15.47) times the amount of nonlocking plate reoperations.
Relative Cost Ratios for Locking Plates Compared to Nonlocking Plates. a

Nonlocking plates are reference value standardized to 1.0.
Patient Outcomes
The locking plate patients had a mean PROMIS physical function score of 51.3, whereas nonlocking plate patients averaged 52.6 (P = .51) (Table 3). With regard to PROMIS pain interference scores, locking plate patients had a mean score of 47.2 while nonlocking plate patients had a mean score of 47.9 (P = .71). There was no significant difference in union rates between the locking (99.0%) and nonlocking (99.6%) groups (P = .83).
PROMIS and Union Outcomes Between Locking and Nonlocking Fixations.

Complications by Fixation Type
Overall, 18.7% of locking plate patients and 21.9% of nonlocking patients required reoperations. It was found that 19.05% of the nonlocking group underwent hardware removal, as opposed to 10.60% of the locking group (P < .05). When broken down by hardware removal subtype, 11.4% of nonlocking patients required surgery for elective screw removal compared with 2.1% of locking patients (P < .05). Plate removal rates were nearly identical between the 2 plating modalities, with 8.5% of locking patients and 7.6% of nonlocking patients undergoing removal (P = .87). Table 4 demonstrates the various types of hardware removal reoperations. The incidence of infections was significantly higher in the locking plate group than the nonlocking plate group (4.9% vs 1.4%, P < .05).
Comparison of Hardware Removal Rates Between Locking and Nonlocking Fixations.

Discussion
Our findings indicate that while locking plates pose a significantly greater cost to the health system than nonlocking plates, they are associated with a lower incidence of reoperations for hardware removal (P < .05) and fewer reoperations overall. However, the cost per reoperation was significantly greater in the locking plate cohort. Notably, patient-reported outcomes did not differ between the 2 groups at either a statistical or clinically meaningful level. This suggests that in this retrospective cohort, locking and nonlocking plates yielded similar PROMIS outcomes and union rates, although confounding due to baseline group differences may limit the reliability of cost-effectiveness conclusions. In this retrospective cohort, PROMIS scores were the primary outcome for evaluating clinical effectiveness, supported by union rates and complication data. With regard to achieving successful union outcomes, the vast majority of current clinical literature reports both locking and nonlocking plates to be equivalent.6,10,22 Our study corroborates these findings, demonstrating nearly identical union rates between locking and nonlocking plating constructs (P = .83). Additionally, postoperative PROMIS scores for physical function and pain interference were nearly indistinguishable between the 2 cohorts, indicating that patients achieve comparable levels of activity with relatively mild pain regardless of plating type. These clinical outcomes align with biomechanical studies showing no significant differences in stiffness or torque to failure, with some suggesting greater torque tolerance in nonlocking plates.5,13,17
Although primary union outcomes appear comparable between the 2 groups, the value of this study lies in its detailed analysis of complications and their associated costs. Existing clinical data on complication rates remain heterogeneous. Schepers et al 20 reported a 17.5% complication rate in the locking plate group compared with 5.5% in the nonlocking cohort, largely because of major complications requiring plate removal. Conversely, Moriarity et al 15 reported similar complication rates of approximately 15% for both locking and nonlocking plates, attributing this to the reduced thickness of the locking plate in their analysis compared with Schepers et al. In the present study, although overall reoperations due to complications were comparable at around 19% to 20% (P = .20), locking plates required significantly fewer reoperations for hardware removal (P < .05).
When analyzed by type of hardware removal, plate removal rates were similar in both cohorts (8.5% vs 7.6%, P = .87). However, syndesmotic screw removal constituted the vast majority of hardware removal reoperations in the nonlocking cohort (11.2%) and occurred significantly more frequently than screw removal in the locking plate cohort (P < .05). These syndesmotic screw removals were quick, low-cost operations that typically occurred in younger, healthier patients in our study cohort, a finding previously described in the literature. 2 As a result, the cost per reoperation was significantly higher in the locking cohort compared with the nonlocking group.
An observed difference in infection rates between cohorts may have contributed to cost differences, although a causal relationship cannot be established given the retrospective design and lack of control for confounders. Deep infections at the bone-plate interface or fracture site necessitate extensive debridement and revision that pose a significant cost to the health system. The present study is not the first time locking plates have been shown to produce a higher infection rate. Moss and colleagues reported an infection rate of 6.2% in the contoured locking plate group compared with 1.4% in the one-third tubular plate group (P = .017). 16 Similarly, despite using multiple different locking plates, Patel et al 18 found the use of a locking plate to be an independent risk factor for deep infection (P = .014). It is impossible to ascertain a causal relationship between locking plates and deep infection in a retrospective study. A randomized, prospective study with matched cohorts is needed to truly elucidate the impact of locking plates on deep infection rates. It is possible that the patients in this data set were more prone to soft tissue compromise unrelated to the locking plate itself, particularly given that locking plates are more commonly used in patients with complex fractures and poor bone quality, which are independent risk factors for infection.16,18,20
The primary limitation of our study was the retrospective study design. Because this was not a prospective study, we were unable to balance for factors such as fracture complexity, degree of comminution, bone quality, or medical comorbidities when choosing a plating construct, leading to heterogeneity in our groups as seen in Table 1. Specifically, there was a significantly greater proportion of elderly and female patients in the group undergoing fixation with a locking plate. This potential selection bias limits the ability to draw definitive causal relationships about outcomes such as complication rates and implant removal based on implant type. However, nonlocking plates still demonstrated comparable stability relative to the locking plates. A randomized approach would have been preferred to eliminate these confounding variables. Similarly, data regarding medical comorbidities that increase risk for poor bone or wound healing were not readily available for assessment between groups. Furthermore, the choice between locking and nonlocking plates may be affected by the clinical judgment and experience of each surgeon and their preferred method of practice. These clinical considerations, which are closely tied to patient-specific factors, further contribute to the heterogeneity observed in our cohort. We did not perform statistical adjustments such as propensity score matching or multivariate analysis, which may limit the validity of between-group comparisons. Additionally, we report data from a single center only within a limited timeframe. As such, our conclusions may not be generalizable to the broader population. Additionally, our outcome analysis was limited by the absence of baseline PROMIS scores, preventing us from measuring change in function or pain following surgery. This introduces potential for bias due to variable preinjury status or recall effects.
Although we acknowledge that statistical matching techniques like propensity scoring may improve balance across comparison groups, these were not applied in the present analysis and should be considered in future work.
Conclusion
Although locking plates are significantly more expensive than nonlocking plates, there is no clinically significant difference in overall union or complication rates as well as PROMIS scores between patients treated with either modality. However, nonlocking plates were associated with a significant increase in uncomplicated, often elective, syndesmotic screw removal rate whereas locking plates were associated with a higher deep infection rate. Although our conclusions are limited by the retrospective nature of the study, a significantly greater proportion of elderly and female patients in the locking cohort, and a lack of adjustment for confounding, it appears that nonlocking plates provide clinically equivalent outcomes to locking plates at a significantly lower cost to the health system.
Supplemental Material
sj-pdf-1-fao-10.1177_24730114251351632 – Supplemental material for Cost-Effectiveness of Locking vs Nonlocking Plates for Ankle Fracture Fixation: A Retrospective PROMIS-Based Cohort Study
Supplemental material, sj-pdf-1-fao-10.1177_24730114251351632 for Cost-Effectiveness of Locking vs Nonlocking Plates for Ankle Fracture Fixation: A Retrospective PROMIS-Based Cohort Study by Abhinav R. Balu, Rohan Bhargava, Mehul Mittal, Rachel Bergman, Milap Patel, Anish R. Kadakia and Muhammad Mutawakkil in Foot & Ankle Orthopaedics
Footnotes
Ethical Approval
Ethical approval for this study was obtained from the Institutional Review Board at Northwestern Medicine, under approval number STU00218343. All study procedures complied with the ethical standards of the 1964 Helsinki Declaration and its later amendments.
Declaration of Conflicting Interests
The author(s) declared the following potential conflicts of interest with respect to the research, authorship, and/or publication of this article: Anish R. Kadakia, MD, reports disclosures relevant to manuscript from Arthrex Inc: consulting fees and royalties; DePuy Synthes: consulting fees; ACUMED: consulting fees. Muhammad Mutawakkil, MD, reports disclosures relevant to manuscript from Arthrex: travel/food; Medwest Associates: travel/food; Supreme Orthopedic Systems, LLC: travel/food; Paragon 28, Inc: travel/food. Disclosure forms for all authors are available online.
Funding
The author(s) received no financial support for the research, authorship, and/or publication of this article.
Informed Consent Statement
Informed consent was obtained from all participants included in the study.
Data Availability Statement
The data supporting the findings of this study are not publicly available because of institutional policies and proprietary restrictions. Because these data are derived from internal records and protected by confidentiality agreements, they are accessible only to authorized personnel within our institution. However, inquiries regarding potential data access for collaborative purposes may be directed to the corresponding author, Abhinav R. Balu, BS, subject to approval and adherence to data sharing policies.
References
Supplementary Material
Please find the following supplemental material available below.
For Open Access articles published under a Creative Commons License, all supplemental material carries the same license as the article it is associated with.
For non-Open Access articles published, all supplemental material carries a non-exclusive license, and permission requests for re-use of supplemental material or any part of supplemental material shall be sent directly to the copyright owner as specified in the copyright notice associated with the article.