
Abstract
Background:
Medicaid reimbursement to physicians is often perceived to be lower than Medicare, but little is known about orthopaedic foot and ankle reimbursement. This study sought to compare Medicare and Medicaid reimbursement for the 20 most common foot and ankle procedures.
Methods:
Medicare reimbursement rates for common foot and ankle codes were obtained from the online Centers for Medicare & Medicaid fee schedule, while Medicaid rates were found from individual state fee schedule websites. Medicaid rates were compared by state and pooled to obtain national differences. The Medicare Wage Index was used to adjust Medicaid rates by state wages to ensure a more accurate comparison. Variability between states was measured using state percentages of Medicare and coefficient of variation values.
Results:
Medicaid reimbursed physicians higher than Medicare in 31 states overall, with average reimbursement ranging from 37% to 324% of Medicare. Nationally, Medicaid reimbursed 8.8% higher than Medicare, but Medicare reimbursed 3.7% higher when adjusted for the Medicare Wage Index. The Current Procedural Terminology (CPT) codes with the highest ratio of Medicaid to Medicare reimbursement were CPT 28002 for incision and drainage of the foot (176.6%) and CPT 28820 for toe amputation (167.6%). Five codes had lower relative Medicaid reimbursement on average: CPT 27687 for repair procedures on the leg and ankle joint, CPT 28810 for amputation procedures on the foot and toes, CPT 28010 for toe tenotomy, CPT 28005 for incision procedures on the foot and toes, and CPT 28470 for closed treatment of a metatarsal fracture. The coefficient of variation values ranged from 0.34 to 0.84 in the Medicaid group and 0.40 to 0.78 in the adjusted group, indicating high variability between states and between procedures.
Conclusion:
Medicaid reimbursement is highly inconsistent between states, ranging from 37% to 324% of Medicare. Medicaid reimbursed more than Medicare overall, which is in contrast with most published findings that tend to show higher reimbursement for Medicare when compared to Medicaid. When adjusting for wage differences between states, Medicare reimbursed slightly higher than Medicaid.
Level of Evidence:
Level IV, economic analysis.
Introduction
Reimbursement for surgical procedures in the United States consists of numerous payers and payment systems, with a constantly evolving landscape in an attempt to contain costs and optimize quality of care. Three groups that represent the largest payers in the United States are private insurers, Medicare (MCR), which primarily covers patients over the age of 65 years and those with certain diseases, and Medicaid (MCD), which primarily covers those with low income or disabilities. 13 MCR typically reimburses hospitals for its services based on diagnosis-related groups (DRGs), a set fee based on the primary patient diagnosis for a hospitalization, but reimburses physicians on a fee-for-service model for the work they provide.16,24 MCD reimbursement often involves fee-for-service payments to both hospitals and physicians, though states may contract with managed care plans that reimburse hospitals using other methods.30,31 Fee-for-service models use Current Procedural Terminology (CPT) codes, unique to each surgical procedure, that correspond to a payment amount based on the number of relative value units (RVUs) attached to that CPT code. 3 RVUs combine perceived physician work, costs, and liability to determine the relative value of a service. Modifier codes may be used to adjust reimbursement for fee-for-service rates based on additional work performed.
MCR expenditure has been increasing and is expected to continue to grow in the setting of an aging population. 8 Perhaps to offset this, reimbursement to physicians has been decreasing over the past 2 decades, as noted in a variety of orthopaedic subspecialties.21,22,28,37,38,41 Hospital reimbursement is also decreasing as more than 60% of hospitals in 2019 reported losing money while caring for MCR patients. 2 MCD similarly is projecting an increase in costs over the coming decade, 12 and nearly 60% of hospitals also lost money in 2019 while treating MCD patients. 2 For surgeons, studies have demonstrated that MCD, on average, reimburses less than MCR in a variety of specialties, but there is wide variability between states.7,25,27,39
Reimbursement to surgeons from MCR for orthopaedic foot and ankle procedures have decreased by 30% over the past 2 decades when adjusting for inflation, 36 but little is known on MCD reimbursement for this subspecialty. Therefore, the purpose of this study was to collect MCD reimbursement rates for common foot and ankle procedures and compare them to MCR rates. These rates will be important to physicians in a fee-for-service model, but less applicable to ones in an RVU-based system. We predicted a lower average rate than MCR with large variability between states.
Methods
Collection of CPT Codes, RVUs, and localities
The 20 most frequently billed foot and ankle CPT codes from 2017 were used in the MCR reimbursement study by Pollock et al14,36 and were included in this study after checking with recent Centers for Medicare & Medicaid Services (CMS) use data to ensure they remained highly relevant. Of note, open repair of foot and ankle fracture codes were not included in the analysis as a recent study by Moore et al 34 already compared MCD and MCR reimbursement for several such codes. Work RVUs (wRVUs) were collected from the CMS Physician Fee Schedule Look-Up Tool to assess the relative payment among different procedures. 15 For MCR reimbursement, rates vary based on cost of living, which is delineated by Medicare Administrative Contractor (MAC) localities. Many MAC localities represent geographic regions approximating state lines, although some states contain multiple MAC localities. For consistency, the “rest of state” option was used for states with multiple localities, which includes all parts of the state not otherwise defined by specific localities (Table 1).
Twenty Included Foot and Ankle CPT Codes With Their Descriptions and Corresponding Work RVUs.
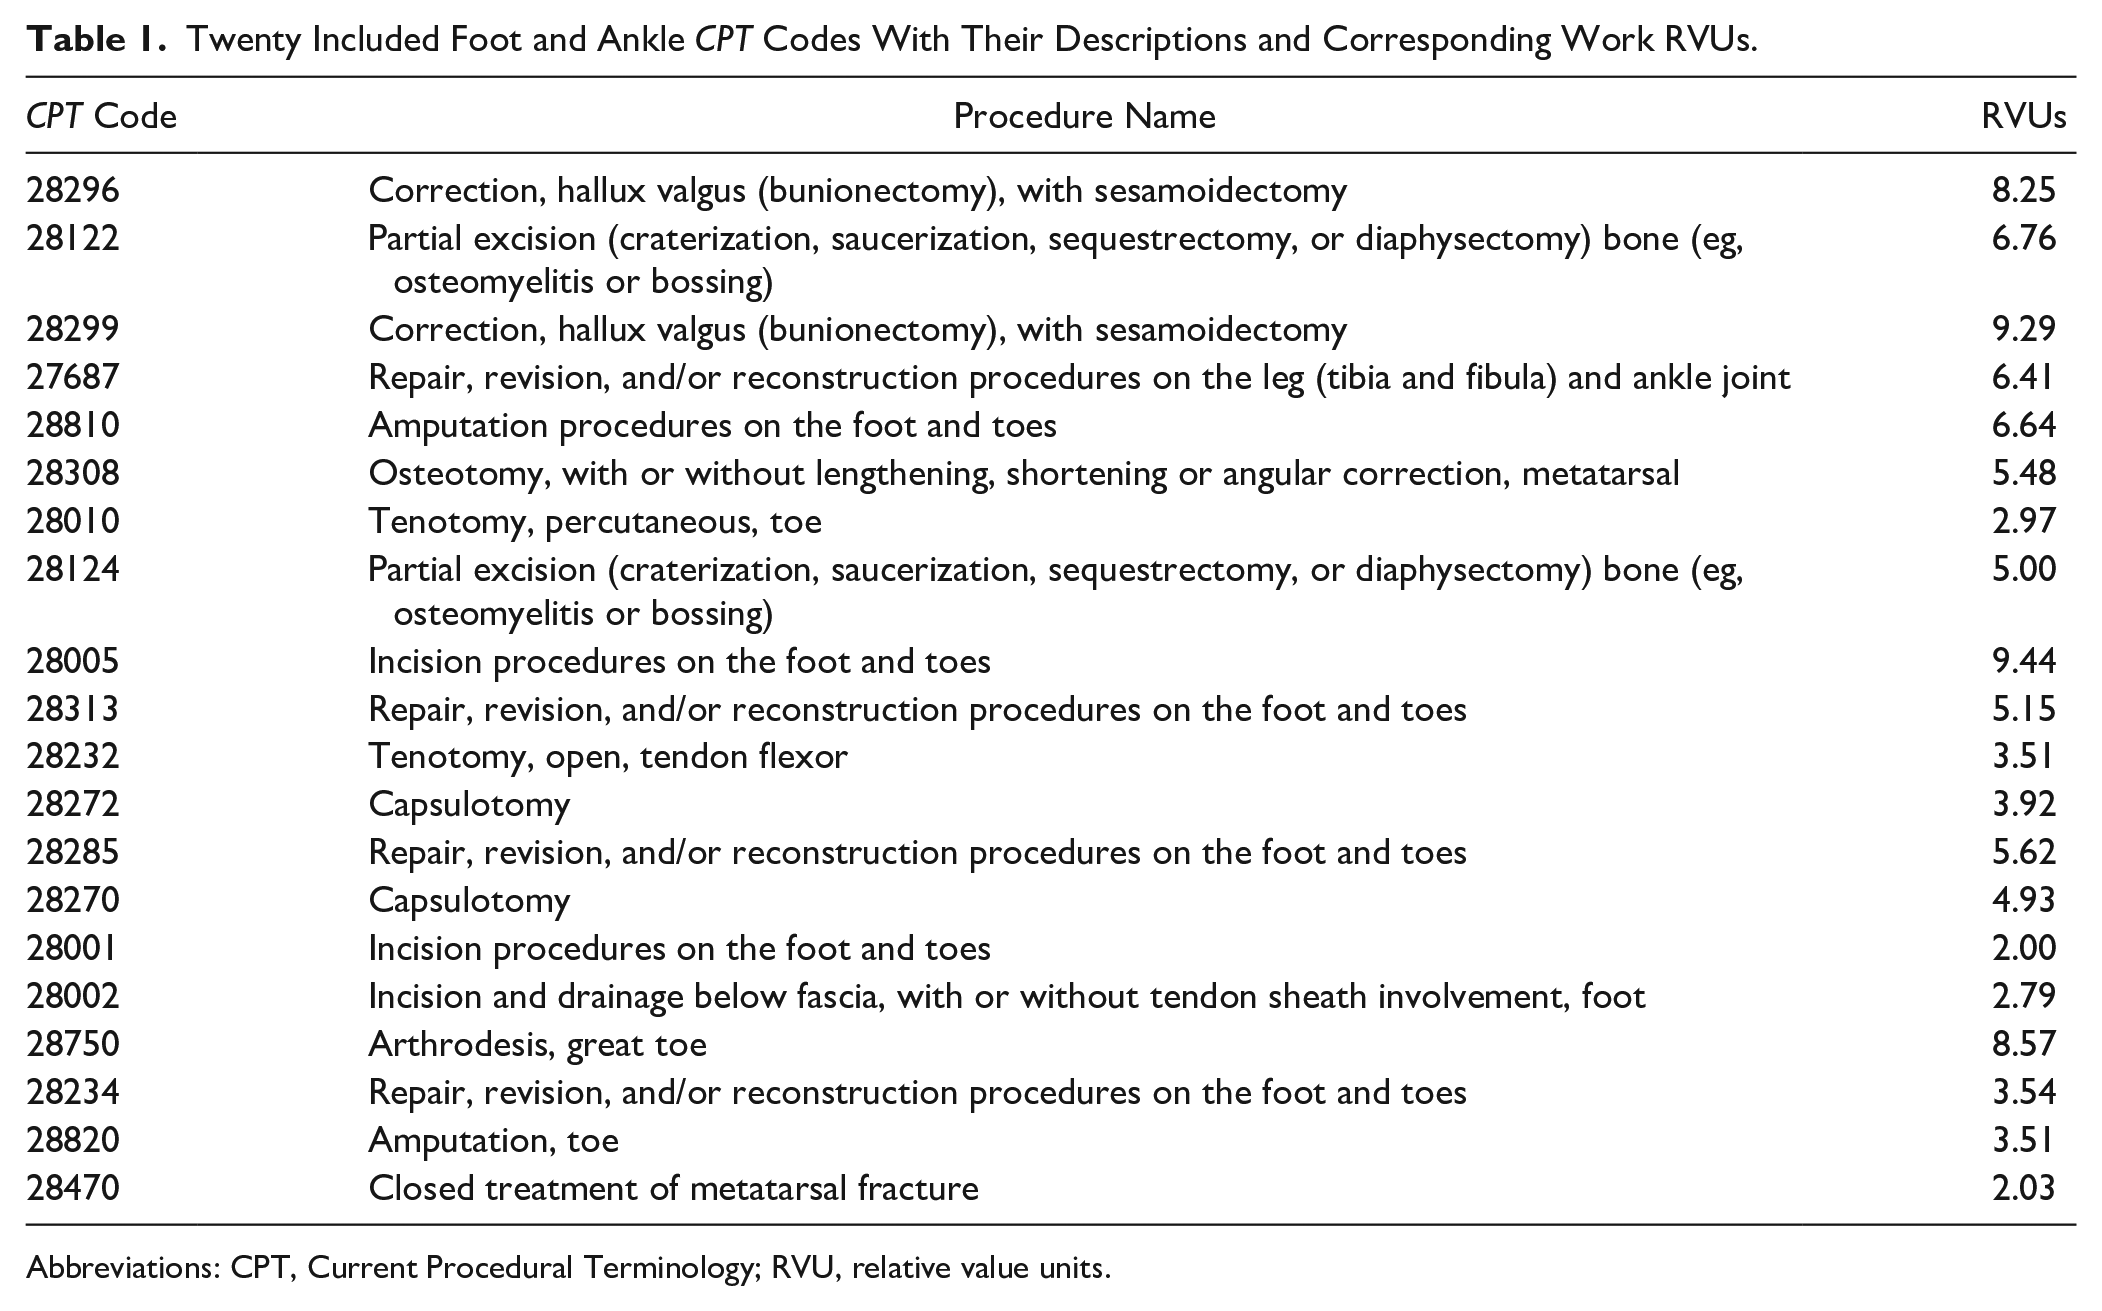
Abbreviations: CPT, Current Procedural Terminology; RVU, relative value units.
Physician Fee Schedules
MCD rates were extracted from each state’s online physician fee schedules. All states were included except Tennessee, which does not use a fee-for-service model for MCD. For some states, rates could vary based on whether the procedure took place inpatient or outpatient and within an MCD facility vs nonfacility. Some states also included modifier codes that could be added to increase reimbursement. For consistency, the highest overall price with no modifiers was obtained from each state wherever possible. MCR rates were collected using the 2023 CMS Medicare Physician Fee Schedule. 16 The facility fee was used for all state-specific MAC localities with no modifier codes.
Medicare Wage Index
To assess the effect that average state wages have on MCD reimbursement rates, the Medicare Wage Index (MWI) was recorded from the Wage Index Files of the CMS website. 18 The MWI represents a ratio of state average wages to the national average. Using methods akin to the MCD reimbursement analysis by Lalezari et al, 27 we multiplied the MCD rates by each state’s MWI to produce MWI-adjusted MCD data to more accurately compare disparities between MCD and MCR.
Analyses
Average, median, SD, lower bound, and upper bound values were calculated for MCR, MCD, and MWI-adjusted MCD data sets. MCR was compared to both MCD and MWI-adjusted MCD using dollar differences for each procedure and state. Dollar differences were adjusted by the work RVUs to ascertain differences between procedures. Both the dollar difference and dollar difference per RVU were then averaged to reflect national differences.
To assess variability, state MCD averages were given percentages to MCR to reflect relative reimbursement. The same was done for each individual procedure. Furthermore, coefficient of variation values were calculated by dividing the mean by the SD for each procedure in the MCR, MCD, and MWI-adjusted MCD groups. A coefficient of variation value further from zero represents greater variability within a data set. Coefficient of variation values were also calculated for the dollar differences.
Results
State Averages
For all procedures, 31 states had higher average MCD reimbursement rates than corresponding MCR rates, and Hawaii had identical MCD rates to MCR for all procedures. The average reimbursement across all procedures ranged from 37.2% (Rhode Island) to 323.5% (Idaho) of MCR. Six states had lower reimbursement than MCR for all procedures: Colorado, Connecticut, Michigan, New Hampshire, New Jersey, and Rhode Island. Of note, Washington and Michigan had 1 or more missing values in their MCD data, which were excluded from analysis. Pennsylvania had 5 codes (28296, 28299, 28308, 28002, and 28820) for which the only rates available contained modifier codes within them, and the rates were proportionally higher than the rest of the state’s rates. Figure 1 provides a comparison of state rates in relation to MCR as a heatmap of the United States.

A heatmap of relative Medicaid reimburse compared to Medicaid by state. Red colors depict states with a Medicaid to Medicare reimbursement ratio less than 1, while blue depicts states with a ratio greater than 1. Tennessee was not included in this study.
National Averages
MCD reimbursed physicians on average 8.8% higher than MCR across all 20 procedures. When adjusting for the MWI, however, MCR reimbursed 3.7% higher. For all states combined, the procedures range from 81.4% (closed treatment of metatarsal fracture) to 176.6% (incision and drainage of the foot below the fascia) of MCR. Overall, 15 procedures were reimbursed higher for MCD. The dollar differences ranged from $91.72 (incision procedures on the foot and toes) less for MCD to $203.14 (bunionectomy with sesamoidectomy) greater for MCD. The dollar difference per wRVU ranged from $18.84 (closed treatment of metatarsal fracture) less for MCD to $38.02 (incision and drainage of the foot below the fascia) greater for MCD (Table 2). The Supplementary Table provides more detailed data by each procedure code.
Analysis of National Medicaid, Wage-Adjusted Medicaid, and Medicare Reimbursement for 20 Orthopaedic Foot and Ankle Codes.

Coefficient of Variation
The coefficient of variation ranged from 0.04 to 0.07 for all MCR procedures, indicating overall low variability between procedures. It ranged from 0.34 to 0.84 for MCD procedures and from 0.40 to 0.78 when adjusting for the MWI, indicating greater variability between states and between procedures. The absolute value coefficient of variation for the dollar difference between MCD and MCR ranged from 1.23 to 47.57. Table 3 depicts the dollar differences for all codes with corresponding coefficient of variation values.
Dollar Difference Alone and per Work RVU Between National MCD and MCR Data.

Abbreviations: MCD, Medicaid; MCR, Medicare; RVU, relative value units.
Discussion
The most notable finding from this study was that MCD reimbursement is highly inconsistent between states, ranging from 37% to 324% of MCR reimbursement with substantially higher coefficient of variation values than MCR. By individual procedure code across all states, MCD reimbursement ranged from 81% to 177% of MCR, indicating that MCD procedural rates are not consistently priced. MCD reimbursement on average exceeded MCR by 8.8%, but when adjusting for the cost of living with the MWI, MCR rates were greater than MCD by 3.7%.
Several prior studies have evaluated MCD reimbursement for orthopaedic procedures, including analyses of general orthopaedic procedures, fractures, and hand, spine, and pediatric procedures.4,6,7,19,20,27 All of these studies, by contrast, found that MCD reimbursement was lower on average than MCR. This is the first orthopaedic subspecialty identified in which MCD outperforms MCR. Strikingly, however, compared with all these studies that included coefficient of variation values, foot and ankle procedures had the highest average MCD coefficient of variation, indicating very wide variability between states. As Baker et al 4 summarized in their study on MCD reimbursement in hand procedures, states may set their own MCD rates, allowing that they fall within federal guidelines, but are not transparent in the methods by which they create them. Our data demonstrate that surgeons can be reimbursed from 37% to 324% of MCR for the same procedure based on where they practice. This suggests more objective metrics should potentially be employed nationwide when determining MCD rates in order to establish more uniformity.
The reasoning for higher MCD reimbursement is not apparently clear and is likely multifactorial. One potential theory stems from findings by Meyers et al 33 that median MCR payments for ankle fracture procedures were lower for orthopaedic foot surgeons compared to podiatrists. If these findings are universal within foot and ankle procedures, MCR may compensate orthopaedic foot and ankle surgeons less but MCD may choose to simply offer a single rate for both orthopaedists and podiatrists that is higher overall than orthopaedic MCR rates. Another hypothesis is that foot and ankle procedures are most likely to be interventions for chronic diseases such as diabetes mellitus in which MCD beneficiaries suffer from worse outcomes. 42 It is known that states may use targeted financial incentives within their MCD programs to achieve better health outcomes, 32 and it is possible they have increased reimbursement for some foot and ankle procedures to deal with complications that more often arise in MCD populations.
Indeed, some of the procedures that reimbursed the highest relative to MCR are ones that treat complications of diabetes or skin abscesses, which may be thought to be more common in MCD populations. These codes, though, also have closely-related codes that by contrast reimburse substantially lower for MCD. CPT 28001, 28002, and 28005 code for incision procedures of bursa, sub-fascial layer, and bone, respectively. The first two have average rates well above MCR while CPT 28005 averaged $95 less for MCD. Likewise, CPT 28820 is used for toe amputations at the metatarsophalangeal joint and averaged $119 more for MCD, but the related code 28810, which codes for toe amputation with inclusion of the metatarsal head, averaged $50 less for MCD. It is unclear why there are such discrepancies in seemingly related procedures, but it appears as though MCD programs wish to incentivize physicians to perform certain procedures over others.
Alternatively, the relatively high MCD reimbursement for select procedures may be mainly caused by falling MCR rates. When comparing MCR rates collected in our study to the same 20 procedures used by Pollock et al 36 with 2017 data, all 20 procedures have since decreased in reimbursement. This is evident even without adjusting for inflation and is most notable for toe amputation (a $240 decrease) and incision and drainage below the fascia of the foot (a $200 decrease), both of which are reimbursed by MCD on average over $100 more than MCR. The two bunionectomy codes, 28296 and 28122, exhibit the greatest difference between MCD and MCR ($153 and $203, respectively) and were also found to have among the most drastically declining MCR reimbursement by Pollock et al. 36 Thus, MCD’s relatively higher reimbursement may in part reflect states not lowering their rates proportionate to MCR over the past few years, though it is unknown if this is intentional or not.
It is important to understand the results of the study within the context of national MCR and MCD payment systems. The Medicare Access and CHIP Reauthorization Act of 2015 (MACRA) was signed into law in 2015 and provides two options for physician reimbursement that are affected by quality measures: Merit Based Incentive Payments System (MIPS) and alternative payment models (APMs). 10 MIPS retains a more traditional fee-for-service model in which physicians receive up to 4% bonuses or reductions in their pay for MCR patients based on a composite score of quality measures. 40 APMs may be optional or mandatory, and include models similar to DRGs, such as the Comprehensive Care for Joint Replacement Model, of which total ankle arthroplasty is included, and the recently announced Transforming Episode Accountability Model, which includes lower extremity joint replacement procedures.9,17 A number of APMs have also been created and adapted into state MCD programs, representing efforts to change the models by which these health care systems reimburse physicians. 1 These changes reflect pushes to control health care expenditure while increasing the quality of care. Future changes in reimbursement are likely as new systems are established, and it is critical that policy makers have a comprehensive understanding of contemporary reimbursement trends such as those presented in this study.
Despite these efforts and the increase in MCD enrollment under the Patient Protection and Affordable Care Act, MCD patients with foot and ankle complaints continue to suffer from decreased access to care, including longer wait times, more difficulty obtaining appointments, and worse outcomes after surgery.5,26,29,35 These barriers to access are most prominent in states that maintain unexpanded MCD programs. 23 Although reimbursement alone does not appear to be responsible for decreased access among MCD beneficiaries, this population may face even increased difficulty receiving care in states with poorly funded MCD programs.
Limitations
Comparing MCD and MCR fee schedules is imprecise, as both may contain multiple values for a given procedure. We strove to maintain consistency by using no modifiers for each and using the highest available price for state MCD rates, but it is unclear how accurately this affects actual average rates. There is also a lack of information on how frequently modifier codes are used in procedures, which have the potential to drastically impact reimbursement. Foot and ankle procedures often may encompass multiple CPT codes; as per CMS guidelines, it is important to choose the most comprehensive code for the procedure, which does not bill for more than what is performed. 11 Modifier codes are thus very important tools in adjusting reimbursement for extra work performed in a procedure, but could not be accounted for by this study.
Additionally, several codes within 2 states were missing information on reimbursement rates for MCD, whereas 1 state had several codes that only included rates with a modifier that were proportionally higher than its other rates. We hope that these irregularities offset each other to maintain relative accuracy, but they both had the potential to change their states’ relative reimbursement to MCR. The selection of MAC localities designated as “rest of state” when multiple localities applied to a state were intended to fairly represent the state by capturing the greatest percentage of the state possible, but this selection could potentially exclude certain metropolitan areas where wages, and thus Medicare reimbursement, may be higher. Finally, as noted previously, there are many models that can influence rates, such as quality adjustment under MIPS or using APMs, which do not operate using a traditional fee-for-service model. MCD may also be administered through a private managed plan that can use any type of reimbursement model. All of these factors have the potential to change reimbursement for MCD and MCR and are not able to be accounted for within the context of this study.
Conclusion
MCD reimbursement for common orthopaedic foot and ankle procedures was highly inconsistent between states, ranging from 37% to 324% as a proportion of corresponding MCR rates. The extreme variability between states and between procedures suggests that MCD could benefit from more objective metrics to guide reimbursement. Contrary to our hypothesis, MCD did reimburse an overall 8.8% higher rate than MCR, though it reimburses 3.7% less when adjusted for wage differences between states. Orthopaedic surgeons should familiarize themselves with local state rates and advocate for policies that provide fair reimbursement for their services.
Supplemental Material
sj-pdf-1-fao-10.1177_24730114251330302 – Supplemental material for Medicaid Reimbursement for Common Orthopaedic Foot and Ankle Procedures Is Highly Inconsistent Among States, Ranging from 37% to 324% of Medicare Reimbursement
Supplemental material, sj-pdf-1-fao-10.1177_24730114251330302 for Medicaid Reimbursement for Common Orthopaedic Foot and Ankle Procedures Is Highly Inconsistent Among States, Ranging from 37% to 324% of Medicare Reimbursement by Adam P. Henderson, M. Lane Moore, Nathan C. Beckett, Paul R. Van Schuyver, Jack M. Haglin, Joseph C. Brinkman and Karan A. Patel in Foot & Ankle Orthopaedics
Footnotes
Appendix
Analysis of National Medicaid, Medicare Wage Index–Adjusted Medicaid, and Medicare Reimbursement for 20 Orthopaedic Foot/Ankle Procedures.

| Descriptor | Mean ($) | SD ($) | Median ($) | Lower ($) | Upper ($) | Coefficient of Variation |
|---|---|---|---|---|---|---|
| Medicaid reimbursement | ||||||
| Correction, hallux valgus (bunionectomy), with sesamoidectomy | 659 | 227 | 640 | 328 | 1386 | 0.34 |
| Partial excision (craterization, saucerization, sequestrectomy, or diaphysectomy) bone (eg, osteomyelitis or bossing) | 450 | 181 | 446 | 131 | 1230 | 0.40 |
| Correction, hallux valgus (bunionectomy), with sesamoidectomy | 788 | 468 | 718 | 328 | 3552 | 0.59 |
| Repair, revision, and/or reconstruction procedures on the leg (tibia and fibula) and ankle joint | 401 | 153 | 366 | 231 | 1230 | 0.38 |
| Amputation procedures on the foot and toes | 367 | 158 | 352 | 143 | 1230 | 0.43 |
| Osteotomy, with or without lengthening, shortening or angular correction, metatarsal | 432 | 198 | 391 | 126 | 1230 | 0.46 |
| Tenotomy, percutaneous, toe | 177 | 68 | 178 | 22 | 379 | 0.38 |
| Partial excision (craterization, saucerization, sequestrectomy, or diaphysectomy) bone (eg, osteomyelitis or bossing) | 337 | 113 | 334 | 99 | 752 | 0.34 |
| Incision procedures on the foot and toes | 471 | 185 | 447 | 126 | 1230 | 0.39 |
| Repair, revision, and/or reconstruction procedures on the foot and toes | 407 | 173 | 386 | 143 | 1230 | 0.42 |
| Tenotomy, open, tendon flexor | 252 | 105 | 256 | 38 | 589 | 0.42 |
| Capsulotomy | 267 | 99 | 265 | 39 | 604 | 0.37 |
| Repair, revision, and/or reconstruction procedures on the foot and toes | 391 | 178 | 370 | 151 | 1230 | 0.46 |
| Capsulotomy | 364 | 177 | 335 | 16 | 1230 | 0.49 |
| Incision procedures on the foot and toes | 138 | 60 | 141 | 17 | 275 | 0.43 |
| Incision and drainage below fascia, with or without tendon sheath involvement, foot | 245 | 138 | 213 | 25 | 776 | 0.56 |
| Arthrodesis, great toe | 619 | 521 | 579 | 197 | 3930 | 0.84 |
| Repair, revision, and/or reconstruction procedures on the foot and toes | 275 | 130 | 276 | 27 | 651 | 0.47 |
| Amputation, toe | 294 | 183 | 254 | 82 | 1230 | 0.62 |
| Closed treatment of metatarsal fracture | 167 | 57 | 166 | 23 | 346 | 0.34 |
| Medicare Wage Index–adjusted Medicaid reimbursement | ||||||
| Correction, hallux valgus (bunionectomy), with sesamoidectomy | 582 | 233 | 537 | 273 | 1671 | 0.40 |
| Partial excision (craterization, saucerization, sequestrectomy, or diaphysectomy) bone (eg, osteomyelitis or bossing) | 398 | 176 | 361 | 135 | 1136 | 0.44 |
| Correction, hallux valgus (bunionectomy), with sesamoidectomy | 692 | 397 | 611 | 317 | 2748 | 0.57 |
| Repair, revision, and/or reconstruction procedures on the leg (tibia and fibula) and ankle joint | 355 | 145 | 316 | 203 | 952 | 0.41 |
| Amputation procedures on the foot and toes | 324 | 144 | 291 | 147 | 952 | 0.45 |
| Osteotomy, with or without lengthening, shortening or angular correction, metatarsal | 381 | 182 | 333 | 130 | 1076 | 0.48 |
| Tenotomy, percutaneous, toe | 156 | 72 | 152 | 23 | 456 | 0.46 |
| Partial excision (craterization, saucerization, sequestrectomy, or diaphysectomy) bone (eg, osteomyelitis or bossing) | 300 | 126 | 279 | 101 | 907 | 0.42 |
| Incision procedures on the foot and toes | 419 | 190 | 375 | 130 | 1154 | 0.45 |
| Repair, revision, and/or reconstruction procedures on the foot and toes | 363 | 166 | 324 | 141 | 998 | 0.46 |
| Tenotomy, open, tendon flexor | 224 | 111 | 214 | 39 | 711 | 0.50 |
| Capsulotomy | 237 | 107 | 224 | 42 | 728 | 0.45 |
| Repair, revision, and/or reconstruction procedures on the foot and toes | 346 | 170 | 299 | 156 | 1024 | 0.49 |
| Capsulotomy | 321 | 163 | 288 | 17 | 952 | 0.51 |
| Incision procedures on the foot and toes | 121 | 57 | 117 | 19 | 331 | 0.47 |
| Incision and drainage below fascia, with or without tendon sheath involvement, foot | 212 | 117 | 194 | 27 | 629 | 0.55 |
| Arthrodesis, great toe | 543 | 423 | 470 | 203 | 3041 | 0.78 |
| Repair, revision, and/or reconstruction procedures on the foot and toes | 244 | 130 | 231 | 28 | 766 | 0.53 |
| Amputation, toe | 256 | 149 | 228 | 85 | 952 | 0.58 |
| Closed treatment of metatarsal fracture | 148 | 63 | 139 | 25 | 417 | 0.43 |
| Medicare reimbursement | ||||||
| Correction, hallux valgus (bunionectomy), with sesamoidectomy | 507 | 30 | 500 | 473 | 668 | 0.06 |
| Partial excision (craterization, saucerization, sequestrectomy, or diaphysectomy) bone (eg, osteomyelitis or bossing) | 433 | 26 | 428 | 402 | 566 | 0.06 |
| Correction, hallux valgus (bunionectomy), with sesamoidectomy | 584 | 34 | 578 | 543 | 766 | 0.06 |
| Repair, revision, and/or reconstruction procedures on the leg (tibia and fibula) and ankle joint | 450 | 27 | 445 | 415 | 580 | 0.06 |
| Amputation procedures on the foot and toes | 416 | 25 | 411 | 385 | 543 | 0.06 |
| Osteotomy, with or without lengthening, shortening or angular correction, metatarsal | 381 | 23 | 377 | 353 | 494 | 0.06 |
| Tenotomy, percutaneous, toe | 205 | 12 | 203 | 191 | 267 | 0.06 |
| Partial excision (craterization, saucerization, sequestrectomy, or diaphysectomy) bone (eg, osteomyelitis or bossing) | 329 | 19 | 325 | 307 | 431 | 0.06 |
| Incision procedures on the foot and toes | 562 | 21 | 558 | 528 | 617 | 0.04 |
| Repair, revision, and/or reconstruction procedures on the foot and toes | 356 | 21 | 352 | 329 | 461 | 0.06 |
| Tenotomy, open, tendon flexor | 238 | 16 | 235 | 221 | 309 | 0.07 |
| Capsulotomy | 249 | 18 | 245 | 231 | 326 | 0.07 |
| Repair, revision, and/or reconstruction procedures on the foot and toes | 380 | 22 | 375 | 353 | 494 | 0.06 |
| Capsulotomy | 330 | 20 | 326 | 306 | 430 | 0.06 |
| Incision procedures on the foot and toes | 95 | 6 | 94 | 90 | 130 | 0.06 |
| Incision and drainage below fascia, with or without tendon sheath involvement, foot | 139 | 8 | 137 | 131 | 188 | 0.06 |
| Arthrodesis, great toe | 570 | 34 | 564 | 528 | 741 | 0.06 |
| Repair, revision, and/or reconstruction procedures on the foot and toes | 265 | 16 | 262 | 245 | 341 | 0.06 |
| Amputation, toe | 176 | 11 | 174 | 165 | 237 | 0.06 |
| Closed treatment of metatarsal fracture | 205 | 13 | 202 | 187 | 255 | 0.06 |
Ethical Approval
Ethical approval was not sought for the present study because no patient information was used and no human or animal testing was performed.
Declaration of Conflicting Interests
The author(s) declared no potential conflicts of interest with respect to the research, authorship, and/or publication of this article. Disclosure forms for all authors are available online.
Funding
The author(s) received no financial support for the research, authorship, and/or publication of this article.
References
Supplementary Material
Please find the following supplemental material available below.
For Open Access articles published under a Creative Commons License, all supplemental material carries the same license as the article it is associated with.
For non-Open Access articles published, all supplemental material carries a non-exclusive license, and permission requests for re-use of supplemental material or any part of supplemental material shall be sent directly to the copyright owner as specified in the copyright notice associated with the article.