
Abstract
Background:
Plantar fasciitis (PF) is the most common cause of heel pain and can be a source of extensive physical disability and financial burden. Platelet-rich plasma (PRP) offers a potentially definitive, regenerative treatment modality that, if effective, could change the current paradigm of PF care. However, randomized controlled trials (RCTs) on the clinical benefits of PRP for refractory PF offer inconsistent conclusions, potentially because of the broader limitations of using P value thresholds to declare statistical and clinical significance. In this study, we use the Continuous Fragility Index (CFI) and Quotient (CFQ) to appraise the statistical robustness of data from RCTs evaluating PRP for treatment of PF.
Methods:
RCTs comparing outcomes after PRP injection vs alternative treatment in patients with chronic PF were evaluated. Representative simulated data sets were generated for each reported outcome event using summary statistics. The CFI was determined by manipulating each data set until reversal of significance (α=0.05) was achieved. The corresponding CFQ was calculated by dividing the CFI by the sample size.
Results:
Of 259 studies screened, 20 studies (59 outcome events) were included in this analysis. From these simulations, the median CFI for all events was 9, suggesting that varying the treatment of 9 patients would be required to reverse trial significance. The corresponding CFQ was 0.177. Studies with reported P value <.05 were more statistically fragile (CFI=10, CFQ=0.122) than studies with reported P value >.05 (CFI=5, CFQ=0.179). Of 36 outcome events reporting lost to follow-up data, 10 events (27.8%) lost ≥9 patients.
Conclusion:
Our findings suggest that, on average, the statistical fragility of RCTs evaluating PRP for nonoperative PF therapy is at least comparable to that of the sports medicine literature. However, several included studies had concerningly low simulated fragility scores. Orthopaedic surgeons may benefit from preferentially relying on studies with higher CFI and CFQ values when evaluating the utility of PRP for chronic PF in their own clinical practice. Given the importance of RCT data in clinical decision making, fragility indices could help give context to the stability of statistical findings.
Level of Evidence:
Level I, systematic review.
Keywords
Introduction
Approximately 1 of every 10 adults aged 50 and older suffers from plantar fasciitis (PF). 54 With an aging population, the overall prevalence of PF is expected to increase. 34 PF is estimated to account for 8% of all running-related injuries and has been associated with increased social isolation, reduced functional capabilities, and poor perception of health status.26,53 Nonoperative treatment of PF typically involves taping and stretching exercises, whereas intralesional steroid injection, shockwave therapy, or custom orthoses may be warranted in refractory cases. 42 More recently, platelet-rich plasma (PRP) injection has emerged as a newer, potential treatment option for chronic PF. PRP is an autologous blood product that is enriched for platelets ex vivo. The mechanism of action underlying the healing properties of local PRP injection is related, at least in part, to the increased concentrations of growth factors and secretory proteins, which are thought to enhance the recruitment, proliferation, and differentiation of cells comprising regenerative tissues. 15 Musculoskeletal applications of PRP have grown in the last decade, garnering much interest from the orthopaedic community. 61 The clinical indications are extremely diverse, ranging from foot and ankle pathologies to spinal disorders and wound healing. 11 However, there is a great deal of controversy surrounding PRP, in large part driven by the sudden influx of clinical trials with conflicting findings.19,39
The chronic pathology, lack of definitive treatment options, and high frequency of recurrence mean that PF fasciitis is effectively a lifelong physical disability for many patients. Management for symptomatic PF often continues for years, imposing a tremendous financial and personal burden onto patients. 56 Although not currently part of standard care for PF, PRP offers a potentially definitive, regenerative treatment modality that, if effective, could change the current paradigm of PF care. However, as with other applications of PRP, data from randomized controlled trials (RCTs) on the clinical benefits of PRP for the treatment of refractory plantar fasciitis is conflicting and offers inconsistent conclusions.5,16,21,27,43,49,55
Even though RCTs are considered the highest level of original research available, 40 they have faced scrutiny in the last 2 decades because of a disturbingly frequent lack of reproducibility.9,20,24 Some researchers have even presented the possibility that the majority of research findings are significantly biased and, therefore, false. 23 This has been attributed in large part to the nearly ubiquitous threshold for declaring statistical significance, P < .05, which can lead to inaccurate or misleading portrayal of outcome importance.46,60 Indeed, a difference in outcomes with P = .04 is not practically very different from one with P = .06, although these 2 findings may be presented and interpreted with disparate levels of enthusiasm and gravity. Multiple solutions have been proposed to overcome these limitations, including lowering the threshold to P < .005 or eliminating it altogether.3,25,60 However, many of these solutions either do not directly quantify the robustness of statistically significant findings or cannot be easily deployed because of practical limitations, and orthopaedic surgeons’ reliance on significant P values in RCT data continues to play a major role in their clinical decision making. 4 Therefore, orthopaedic surgeons are in serious need of a simpler, better method to appraise RCT findings, especially on the topic of PRP for chronic PF.
More recently, the fragility index (FI) was proposed as an adjunct to P values in RCTs. 59 This metric was first described by Feinstein 12 as a measure to assess the reliance of statistical significance on seemingly unimportant quantitative differences in outcomes. The FI is defined as the number of outcome event reversals necessary to alter significance based on a given significance level, typically α=0.05. 59 The associated fragility quotient (FQ) normalizes this value by dividing the FI by the sample size. 2 By using the FI and FQ alongside P values, authors can provide readers with discrete measures of how robust statistically significant findings truly are. Until recently, however, a major limitation of the FI was that it could only be applied to dichotomous outcomes. 59 In 2021, Caldwell et al 7 described a method to calculate a Continuous Fragility Index (CFI) and Fragility Quotient (CFQ) for continuous outcomes based on the same principles as Feinstein’s metric. The CFI is defined as the minimum number of patients whose intervention must change (moved from experimental to control arm, or vice versa) to alter study significance. 7
The FI and FQ have already been used by various fragility analyses evaluating statistical stability of RCTs in orthopaedic surgery.10,13,14,30,31,37,48 To our knowledge, there has been no such fragility analysis for peer-reviewed RCTs involving PRP injections in the treatment of PF. The aim of the present investigation was to systematically identify RCTs reporting outcomes on the utilization of PRP for chronic PF and evaluate their statistical robustness by applying the CFI and CFQ. We hypothesize that, commensurate with other similar studies in orthopaedic surgery, reported measures of statistical significance will be easily overturned. Furthermore, we sought to contribute to the growing literature for the relatively new CFI and CFQ, because sufficient benchmark data using this new metric are currently lacking.
Material and Methods
Study Selection
We conducted a systematic search in accordance with the Preferred Reporting Items and Meta-Analyses (PRISMA) guidelines. 41 Six online databases were searched: PubMed, Embase, Cochrane, Web of Science, Scopus, and Clinicaltrials.gov. Standardized Medical Subject Headings and Emtree terms were used with keywords to identify RCTs reporting PRP therapy for chronic PF. Exclusion criteria for this study were incorrect study design; lacking a control group; use of cadaveric, animal, or in vitro models; patient age <18 years; or published in a non-English language. Articles that did not report data as mean ± SD or did not report P values were also excluded.
After duplicate removal from 458 studies, 2 independent reviewers performed initial screening of 259 extracted articles using titles and abstracts, as well as subsequent full-text review of 75 articles, to identify studies that met all inclusion criteria. During both initial screening and full-text review, a third reviewer acted as a tiebreaker to resolve disagreements. Ultimately, 20 articles reporting results from RCTs were included in this systematic review and fragility analysis (Figure 1).

Preferred Reporting Items and Meta-Analyses (PRISMA) flow diagram for studies reporting on platelet-rich plasma in plantar fasciitis.
Data Extraction
From each of the 20 included studies, the following variables were extracted: control treatment, duration of follow-up, and all primary and secondary outcomes. All extracted outcome measures were graded on continuous scales, and none were dichotomous. In their fragility analysis for continuous outcomes, Caldwell et al 7 validated a method to create representative, synthetic data sets using mean ± SD and sample size, eliminating the need for raw data collection in large meta- or fragility analyses. In brief, summary statistics (sample size n, mean, and SD) are input to create a simulated candidate data set for each arm consisting of a normally distributed list of n random numbers. If the mean and SD of the candidate data set are not within a specified tolerated range of the input values, the data set is rejected, and the process repeats with a new candidate data set. These methods were applied to the present analysis. For each outcome event, the following data were collected for both the control and PRP groups: mean ± SD, sample size, and number of patients lost to follow-up. The original reported P value was also recorded for analyses comparing the control and intervention arms. The included studies and all extracted data, including first author and publication year, are presented in Table 1.
Summary Characteristics of Included Studies.

Abbreviations: AWB, autologous whole blood; CFI, Continuous Fragility Index; CFQ, Continuous Fragility Quotient; DP, dextrose prolotherapy; ESWT, extracorporeal shockwave therapy; FU, follow-up; IQR, interquartile range; KT, kinesiotaping; LDRT, low-dose radiation therapy; NR, not reported; Phon, phonophoresis; PPP, platelet-poor plasma.
Calculation of Statistical Fragility
The Continuous Fragility Index (CFI) and Continuous Fragility Quotient (CFQ) were calculated, as recently proposed by Caldwell et al 7 , to analyze statistical fragility of continuous outcomes. This entails moving a single patient from one intervention arm to the other intervention arm within a simulation. In the case of outcomes with an initial P <.05, the patient is selected such that moving them would make the means of the 2 arms converge slightly. In the case of outcomes with an initial P >.05, the patient is selected such that moving them would make the means of the 2 arms diverge slightly. This process repeats until the P value flips across a specified alpha threshold (α = 0.05).
The method to calculate CFI is fundamentally different from that of the traditional fragility index (FI) for dichotomous outcomes. The FI is defined as the number of patients whose outcome must change to alter significance, whereas the CFI is defined as the number of patients whose intervention must change to alter significance.7,59 The intuitive way to understand the FI is “the number of patients who, while undergoing the same treatment, hypothetically had a different outcome.” Analogously, the intuitive way to understand the CFI is “the number of patients who, while having the same outcome, hypothetically underwent a different treatment.” The CFI simulation construct is modeled to increase linearly with sample size, increase logarithmically with mean difference, and decrease exponentially with SD. 7 The corresponding CFQ for each outcome event was calculated as its CFI divided by the sample size. Additionally, we further expanded the CFI calculation to determine fragility for initially nonsignificant (P > .05) outcome events, using a similar approach to Caldwell et al’s and following the basic principles of fragility outlined in the seminal article by Feinstein. 12 CFI and CFQ values were reported as median and interquartile range (IQR). Data analysis was performed using R, version 3.6.1, software (The R Foundation for Statistical Computing, Vienna, Austria).
Results
A total of 20 studies met all inclusion criteria and were included in this analysis. The mean sample size was 52.7 patients (range: 20-120), with an average follow-up duration of 29.5 weeks (range: 6-144). Across the 12 studies that reported lost to follow-up data, the mean number of patients lost to final follow-up was 7.6 (range: 0-33). Control group treatments varied, with 13 studies using local steroid injection,1,5,27,28,32,35,43,45,49,50,52,55,57 3 using extracorporeal shockwave therapy,16,21,57 2 using dextrose prolotherapy,33,57 1 using autologous whole blood, 58 1 using low-dose radiation therapy, 17 1 using phonophoresis with kinesiotaping, 18 and 1 using platelet-poor plasma. 36 Each study yielded an average of 2.95 outcome events (range: 1-9) suitable for analysis.
There were 59 total outcome events recorded across all included studies, of which 20 (33.9%) were originally reported as statistically significant and 39 (66.1%) were nonsignificant (Table 2). When grouped by outcome measure, the median CFI for all events was 9 (IQR: 4.5-14) and the median CFQ was 0.177 (IQR: 0.125-0.203). For initially significant events, the median CFI was 5 (IQR: 3.75-14.5), whereas initially nonsignificant events had a median CFI of 10 (IQR: 5-14). Across all outcome events, only 36 (61.0%) reported lost to follow-up data, with 10 events (27.8%) representing ≥9 patients lost. A detailed report of CFIs and CFQs grouped by clinical outcome can be found in Table 2.
Fragility Index and Quotient Data Based on Trial Characteristics.
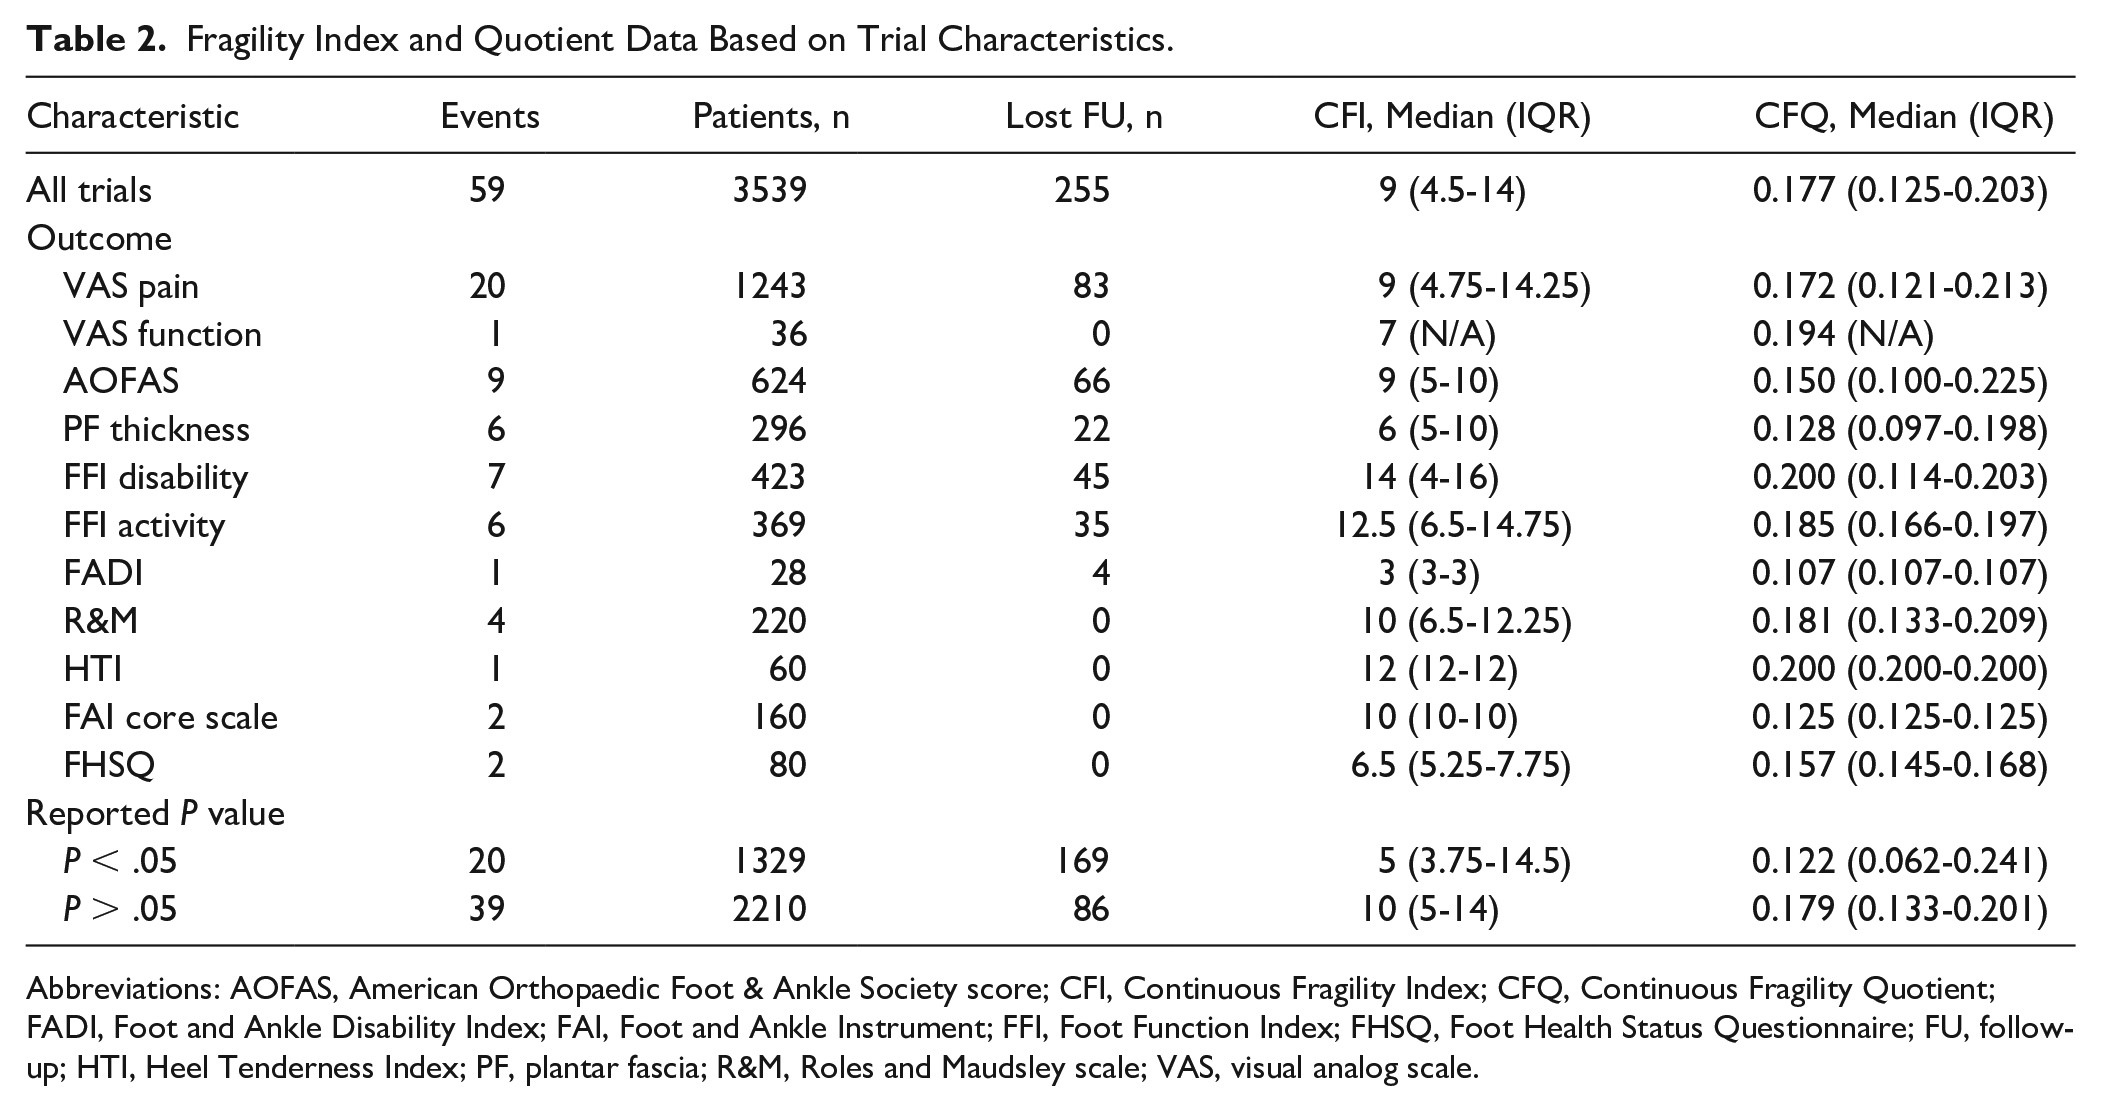
Abbreviations: AOFAS, American Orthopaedic Foot & Ankle Society score; CFI, Continuous Fragility Index; CFQ, Continuous Fragility Quotient; FADI, Foot and Ankle Disability Index; FAI, Foot and Ankle Instrument; FFI, Foot Function Index; FHSQ, Foot Health Status Questionnaire; FU, follow-up; HTI, Heel Tenderness Index; PF, plantar fascia; R&M, Roles and Maudsley scale; VAS, visual analog scale.
Pain graded on a visual analog scale (VAS) was the most commonly reported outcome (18/20 studies), followed by American Orthopaedic Foot & Ankle Society (AOFAS) scores (9/20 studies), plantar fascia thickness (6/20 studies), and Foot Function Index (FFI) disability subscale scores (5/20 studies). Conflicting findings were documented for most of these categories. Eight studies reported improved pain after PRP injection,5,16,21,27,43,45,49,55 whereas 2 studies reported worse pain,32,52 and 8 studies reported no difference compared to control.17,18,28,33,35,36,57,58 For AOFAS scores, 5 studies reported greater improvement compared with control27,32,35,45,49 and 4 studies reported no difference,1,16,17,28 with none documenting lower scores in the PRP group. All 6 studies investigating plantar fascia thickness after treatment found no significant difference between the 2 intervention arms.5,17,18,28,50,58 Three of 5 studies found no difference in FFI disability subscale scores,18,33,57 whereas 1 reported better (lower) scores in the PRP group 45 and 1 reported worse (higher) scores. 52 Of note, the FFI disability category had the highest CFI and CFQ values, indicating a greater degree of statistical stability than other outcome measures. The Heel Tenderness Index category had an equivalent CFQ, although this represented data from a single study. 16 The FFI activity category had the second highest CFI, but findings from 4 studies were still conflicting.33,45,52,57
Discussion
Our systematic review and fragility analysis of RCTs involving PRP injection for refractory PF found that the overall CFI was 9, with an associated CFQ of 0.177. This suggests that, on average, changing the intervention of 9 patients would have been required to reverse trial significance. Notably, this is a key difference between the classic FI for dichotomous outcomes and the CFI for continuous outcomes. The FI is defined as the number of patients whose outcome must change to alter significance, whereas the CFI is defined as the number of patients whose intervention must change to alter significance.7,59 Furthermore, outcome events with significant P values (P < .05) actually suffered from greater statistical instability (CFI = 5, CFQ = 0.122) than events with nonsignificant P values (CFI = 10, CFQ = 0.179).
Fragility analyses have underscored the limitations of using P values, especially when reported without consideration for statistical robustness. Arbitrary α thresholds, inappropriate statistical methods, and variable sample sizes make misrepresentation of data a likely pitfall when using P values to declare significance. 47 Furthermore, P values themselves are inherently influenced by non–outcome-related factors such as effect size, sample size, and data dispersion. 59 Despite these recognized limitations, the proportion of abstracts and articles reporting P values has more than doubled from 1990 to 2015 in MEDLINE and PubMed Central (PMC) databases, with at least 1 P value ≤.05 appearing in 96% of studies. 8 Evidence also suggests that significant P values heavily influence orthopaedic surgeons’ perceptions of study importance and value. 4 Interestingly, our data showed that outcomes events with significant P values (P < .05) actually suffered from greater instability than events with nonsignificant P values. Inclusion of 95% CIs, quartile spreads, or SDs alongside measures of average is one method to illustrate uncertainty. However, these measures do not reflect the clinical importance of observed differences between treatment arms, instead describing spread of the data. Effect size is an important measure that simply describes the difference in means between treatment arms. Although this does not directly quantify the robustness of statistically significant findings, effect size does provide key insight into clinical significance of observed differences between groups. 51 It is a common misconception that a lower P value equates to “more significant” differences, and therefore P values can be reported alone without mean values; however, the P value is heavily influenced by various other factors. For example, in database studies with a large enough sample size, even small, clinically meaningless differences between groups can yield a P value as low as <.001. 29 Effect size is therefore another important adjunct to P values, allowing readers to understand the magnitude of difference between groups and judge its clinical importance. Power calculations offer some insight into the robustness of statistically significant findings, although these often require complex calculations and cannot be performed for studies wherein “expected” values are not known. Thus, there is a need for a simple metric that describes how easily statistical significance can be overturned in terms of number of patients. Given the reliance of physicians on RCT data to make clinical decisions, we believe there is strong justification for including fragility indices alongside P values to better inform readers about the strength of statistical findings.
Previous fragility analyses appraising the statistical stability of RCT findings from various orthopaedic subspecialties have generated concerning results, with very low median FIs ranging from 2 to 5 and FQs ranging from 0.0323 to 0.092.10,13,14,30,31,37,48 However, the quantitative results from the present study cannot be directly compared to these values because the CFI and FI are inherently different in their derivation. This was demonstrated by Caldwell et al, 7 who calculated the CFI based on summary statistics from a sports medicine fragility analysis by Khan et al 30 and found the novel CFI to be significantly higher (P < .0001) for continuous outcomes than the previously reported FI for dichotomous outcomes. To our knowledge, only 2 groups have written about the CFI and CFQ. Aside from Caldwell et al, 7 who reported a mean CFI of 9 (IQR: 1.9-13.3) for sports medicine and arthroscopy literature, Ho et al 22 retrospectively reported a CFI of 3 for a single RCT investigating vagal nerve electrical stimulation to enhance upper limb function after stroke. Additionally, our study is the first to include fragility analyses of continuous outcomes that were initially nonsignificant (P > .05), for which we are not aware of any other benchmark data. Nonetheless, our median CFI for only initially significant findings was 5 (IQR: 3.75-14.5), which was generally consistent with these 2 previous CFI articles. Although it is difficult to draw definitive conclusions in the absence of consensus guidelines regarding a threshold CFI value for strong vs weak evidence, the median CFI of 9 and median CFQ of 0.177 in our study suggest that although RCTs investigating PRP for PF are not impressively robust, their statistical fragility on average is at least comparable to that of the sports medicine literature.
The number of patients lost to follow-up may also help put fragility indices into context, as first suggested by Walsh et al. 59 Although this representation is more intuitive for the dichotomous FI, important conclusions can be made with the CFI as well. In our fragility analysis, the mean number of patients lost to final follow-up was 7.6, although only 36 (61.0%) outcome events from 12 studies reported data on this. Of these, over a quarter (27.8%, n=10) lost a greater or equal number of patients to follow-up than would have needed to switch intervention arms to reverse event significance. This suggests that, given the fragility of RCTs reporting PRP utilization for chronic PF, loss to follow-up may be a major factor contributing to diminished statistical power and lower CFI. This is also true for the CFQ, which is normalized to sample size and would benefit from inclusion of more patients.
There is no clear consensus regarding the utility of PRP in treating chronic, refractory PF in adult patients. Conflicting findings were documented for most of the included outcome variables, with most studies reporting improved outcomes after PRP injection or no difference. Two studies reported worse pain,32,52 of which 1 also reported greater disability. 52 The only consensus was among 6 studies investigating plantar fascia thickness, all of which found no difference between the 2 intervention arms.5,17,18,28,50,58 The FFI disability subscale, Heel Tenderness Index category, and FFI activity subscale had the highest CFI and CFQ values, indicating a greater degree of statistical stability compared to other outcome measures, although actual findings were still conflicting. The greater statistical stability of certain outcome measures may reflect inherently better reliability and/or validity compared to other questionnaires or metrics. The FFI in particular has been praised for excellent inter- and intraevaluator reliability, providing a quantifiable, patient-centered measure of foot health that is used extensively in clinical practice, even in multiple languages.6,38 Comparing the CFQs of different outcome measures in a multistudy fragility analysis may therefore provide insights into which metrics are most appropriate for a given clinical context. In this case, our findings suggest that the FFI may be a superior method for evaluating outcomes after plantar fasciitis treatment. There was also considerable variability in statistical fragility across studies, with CFQs ranging from 0.043 (4.3 per 100 patients) to 0.389 (38.9 per 100 patients). This likely reflects differences in methodology, including the presence of selection biases, variable PRP preparation or dosing/administration techniques, different control treatments, small sample sizes resulting in low power, lack of appropriate controls, or utilization of outcome measures with poor reliability/validity. These factors, among others, can have a considerable impact on a study’s sensitivity for detection of clinically meaningful differences between treatment arms. The variability in results and statistical fragility across 20 RCTs suggest that no distinct conclusions can be drawn at this time about the benefits of PRP injection over current standard of care for chronic PF. Disagreement across studies also highlights the importance of including fragility metrics to better distinguish studies with strong, clinically impactful findings. In our analysis, studies with the highest CFI and CFQ values, which offer more statistically robust evidence than others, may be more valuable for orthopaedic surgeons looking to evaluate the use of PRP in their clinical practice.
Limitations
There are several limitations to this study. Because of the challenges of acquiring raw data from a sufficient number of RCTs for meaningful fragility analysis, we used a previously validated method to generate synthetic data sets using reported summary statistics. 7 Therefore, studies and outcome events for which mean ± SD values were unavailable were excluded. Additionally, normal Gaussian distribution was assumed for all outcome measures reported as mean ± SD in order to generate parametric data sets, although we recognize that some authors may report mean ± SD for nonparametric data. For future studies, these 2 limitations can be overcome by collecting raw data. There was also considerable variability in follow-up duration across studies, which undermines the precise interpretation of the findings when the data sets are combined. Subsequent fragility analyses would benefit from restricting their inclusion criteria to studies with a specified follow-up period. Furthermore, included articles covered a limited range of conservative therapies, and we were not able to compare PRP to other common treatment modalities such as physical therapy.
The CFI and CFQ are not without limitations of their own. Currently, the CFI calculation algorithm utilizes Welch t test to iteratively measure significance, commensurate with the normally distributed synthetic data sets that were generated for analysis. However, some included studies originally reported P values from nonparametric statistical tests and cannot be used to calculate CFI. Additionally, at least 1 study adjusted its analyses to compensate for baseline differences. To account for this, we excluded any endpoint data if baseline values were significantly different and comparisons of mean change were not provided (ie, only baseline and endpoint values were provided). Furthermore, the CFI alone does not account for sample size, which is critical to interpretation of fragility metrics and should therefore be accompanied by the CFQ.2,44 One major limitation of conducting a fragility analysis is that every study does not contribute an equivalent number of outcome events. A study with many events would disproportionately influence the overall mean/median CFI compared to a study with few events. One way to potentially control for this may be to normalize the CFIs and CFQs for each study to the number of outcome events contributed by that study, although it is unclear how this would impact interpretation of results. Finally, there are currently very few CFI studies for comparison. Like the FI, the CFI is also an arbitrary value, with no consensus on what constitutes a “strong” vs “weak” study. 59 However, the absence of a discrete threshold for declaring study strength may be warranted with fragility indices, leaving interpretation and judgment to the reader’s discretion. We hope that adoption of these newer continuous fragility metrics will contribute to a growing body of literature, which may help create context for the CFI and CFQ.
It is also worth noting that fragility analyses cannot compensate for inherent weaknesses in study design. For example, selection biases, potentially confounding variables, and lack of appropriate controls will inherently diminish the quality of evidence produced by a study. In meta-analyses, combining data from studies that are not fundamentally comparable can lead to misleading conclusions. Publication biases also influence the type of research that ultimately reaches broader audiences; often certain “hot topics” are met with seasonal enthusiasm that makes them more likely to be published in high-impact journals. Such factors cannot be corrected using any statistical method. Fragility indices are simply meant to provide an adjunct to the commonly used P value (much like the 95% CI provides an adjunct to the mean), allowing readers to understand how easily a significant finding may be overturned.
Conclusions
Given the importance of RCTs for guiding clinical practice, fragility indices can provide valuable information about the robustness of statistical analyses and give context to the commonly utilized P value. However, fragility analyses must be interpreted alongside the innate strengths, weaknesses, and clinical relevance of each individual study. Based on the wide range of CFI and CFQ values across RCTs in this systematic review, we conclude that while all studies investigating PRP for PF are not impressively robust, their statistical fragility is at least comparable to that of the sports medicine literature. At least in the absence of consensus guidelines, CFIs <9 may be considered weak, whereas CFIs >9 may be considered strong. Increased adoption of the newer continuous fragility metrics may help create further context for the simulated CFI and CFQ. Practicing orthopaedic surgeons should consider fragility metrics as a potential tool to help interpret the clinical importance of RCT findings.
Footnotes
Ethical Approval
Ethical approval was not sought for the present study because it was a systematic review and meta-analysis of previously published data.
Declaration of Conflicting Interests
The author(s) declared no potential conflicts of interest with respect to the research, authorship, and/or publication of this article. ICMJE forms for all authors are available online.
Funding
The author(s) received no financial support for the research, authorship, and/or publication of this article.