
Abstract
Objective
The purpose of this study was to utilize fragility analysis to assess the robustness of randomized controlled trials (RCTs) evaluating the management of articular cartilage defects of the knee. We hypothesize that the cartilage restorative literature will be fragile with the reversal of only a few outcome events required to change statistical significance.
Design
RCTs from 11 orthopedic journals indexed on PubMed from 2000 to 2020 reporting dichotomous outcome measures relating to the management of articular cartilage defects of the knee were included. The Fragility Index (FI) for each outcome was calculated through the iterative reversal of a single outcome event until significance was reversed. The Fragility Quotient (FQ) was calculated by dividing each FI by study sample size. Additional statistical analysis was performed to provide median FI and FQ across subgroups.
Results
Nineteen RCTs containing 60 dichotomous outcomes were included for analysis. The FI and FQ of all outcomes was 4 (IQR 2-7) and 0.067 (IQR 0.034-0.096), respectively. The average number of patients lost to follow-up (LTF) was 3.9 patients with 15.8% of the included studies reporting LTF greater than or equal to 4, the FI of all included outcomes.
Conclusions
The orthopedic literature evaluating articular cartilage defects of the knee is fragile as the reversal of relatively few outcome events may alter the significance of statistical findings. We therefore recommend comprehensive fragility analysis and triple reporting of the P value, FI, and FQ to aid in the interpretation and contextualization of clinical findings reported in the cartilage restoration literature.
Keywords
Introduction
With the 20th century came a wave of scientific and technologic discoveries that would help shape modern medicine. With this came the recognition that physicians lacked the tools to efficiently evaluate the literature and incorporate it into their practice. Evidence-based medicine (EBM) emerged as an effective paradigm for connecting research to clinical practice and is now an integral component of medical training programs. 1 This training emphasizes an understanding of foundational statistical methods required for assessing the significance of research findings. While several methods exist, the P value is most commonly utilized to determine the statistical significance of clinical findings. If this value falls below a certain probability threshold (P < 0.05), researchers conclude a finding to be statistically significant. Thus, P values play an integral role in the resultant clinical recommendations derived from medical research.
Despite its ubiquity, the P value provides an incomplete picture of the significance of clinical findings. It does not provide any information regarding the magnitude of an effect and thus, as a single statistical metric, may fall short in its attempt to provide meaningful insight into the clinical relevance of a statistical finding. 2 Furthermore, small study size or large loss to follow-up may further challenge the robustness of the resultant P value. While confidence intervals have been proposed to address some of the issues surrounding P values and hypothesis testing, they are not without their limitations.3-5 Confidence intervals often prove cumbersome and may be challenging to interpret with the majority of physicians lacking appropriate statistical training. The Fragility Index (FI) has emerged as a statistical complement to the P value while adding depth to its interpretation. The FI is determined by calculating the absolute number of outcome events required to reverse the statistical significance of a particular outcome. Ahmed et al. 6 expanded on this concept by introducing the Fragility Quotient (FQ), which divides the FI by the study’s sample size in order to provide a relative measure of fragility. These statistics enhance understanding of P values by providing insight into the robustness of a study’s conclusion; a small FI or FQ will call into question the validity of a study’s finding, while larger values will strengthen it.
Since the concept of fragility was originally described in 1990, 7 it has been used across medical specialties to help readers evaluate the strength of findings in dichotomous comparative trials.8-11 Within the orthopedic literature, FI and FQ have been used to evaluate the findings of a multitude of subspecialties, from pediatric trauma to orthopedic oncology.12-18 The majority of these studies have demonstrated significant statistical fragility, thus calling into question the robustness of study conclusions. However, the fragility of studies pertaining to articular cartilage defects of the knee has yet to be explored in the literature. The purpose of this study was to utilize fragility analysis to assess the robustness of randomized controlled trials evaluating the management of articular cartilage defects of the knee. We hypothesize the cartilage restorative literature will be fragile with the reversal of only a few outcome events required to change statistical significance.
Methods
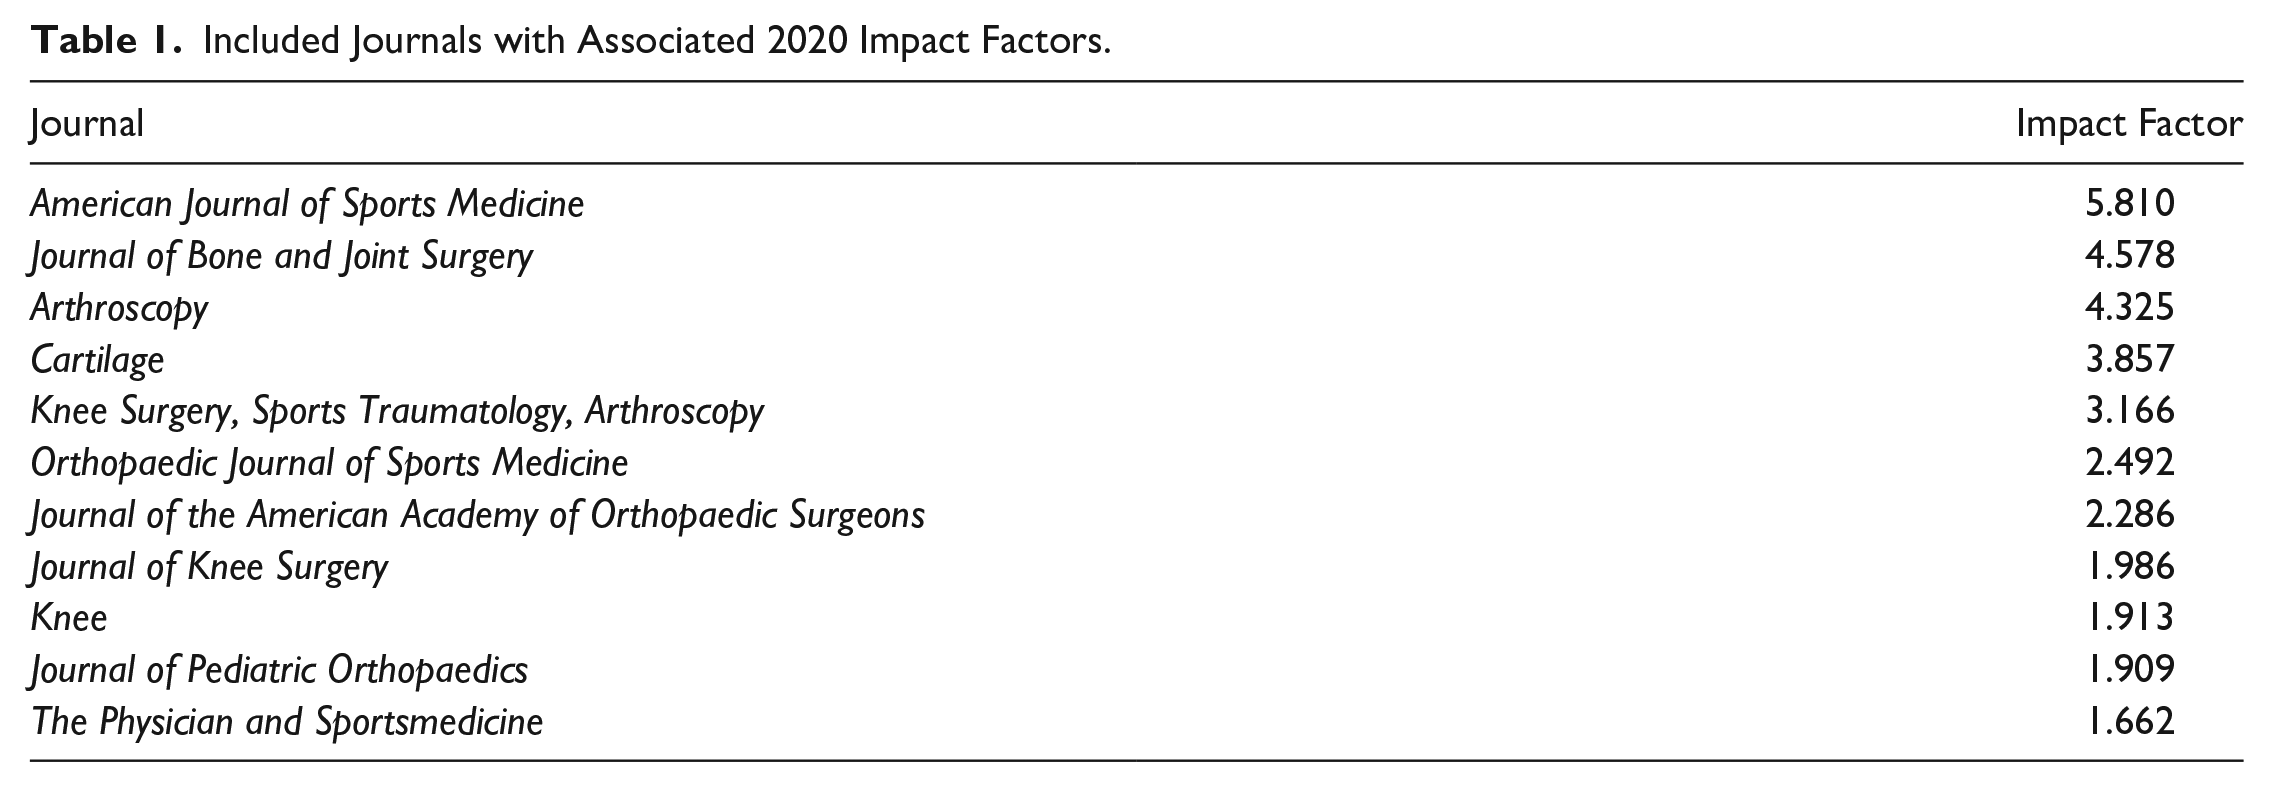
This meta-analysis was performed in accordance with PRISMA (Preferred Reporting Items for Systematic Reviews and Meta-Analyses) guidelines for conducting randomized controlled trials (RCTs) from the PubMed database related to the treatment of articular cartilage defects of the knee and published in 1 of 11 high-impact orthopedic journals from January 1, 2000 to October 10, 2020 were evaluated. The 11 journals were the American Journal of Sports Medicine (AJSM); Cartilage; Arthroscopy; Journal of Bone and Joint Surgery (JBJS); Journal of the American Academy of Orthopaedic Surgeons (JAAOS); Journal of Knee Surgery; Journal of Pediatric Orthopaedics; Knee Surgery, Sports Traumatology, Arthroscopy (KSSTA); Knee; Orthopaedic Journal of Sports Medicine (OJSM); and The Physician and Sportsmedicine. These journals were chosen given their consistent inclusion of research pertaining to the knee as well as their particular prominence within the orthopedic literature; the impact factors for included journals can be found in Table 1 . The full study search strategy can be found in the online Supplemental Appendix. All RCTs pertaining to cartilage disorders of the knee that reported dichotomous categorical outcomes with P values were included in this study. All lengths of follow-up were eligible for inclusion in this study. Animal studies, cadaveric studies, biomechanical studies, case reports, systematic reviews, meta-analyses, nondichotomous studies, and non-RCTs were excluded from this systematic review. After meeting these criteria, the following information was extracted: study authors, journal, publication year, PMID, study design, loss-to-follow-up (LTF), number and type of study outcome (primary vs. secondary), and the P value associated with each outcome. Extraction was performed by a single author (MC) and verified by 2 coauthors (RLP and DPT). Bias was assessed for each study with utilization of the Cochrane Collaboration’s tool for assessing risk of bias in randomized trials. 19 This bias assessment is based on 7 guiding principles: (1) do not use quality scales; (2) focus on internal validity; (3) assess the risk of bias in trial results, not the quality of reporting or methodological problems that are not directly related to risk of bias; (4) assessment of risk of bias require judgment; (5) choose domains to be assessed based on a combination of theoretical and empirical considerations; (6) focus on risk of bias in the data as represented in the review rather than as originally reported; and (7) report outcomes-specific evaluations of risk of bias. In addition to these guiding principles, the risk of bias assessment includes specific evaluation of random sequence generation, allocation concealment, performance bias, detection bias, attrition bias, reporting bias, and other bias ( Table 2 ).
Included Journals with Associated 2020 Impact Factors.
Risk of Bias Assessment. a
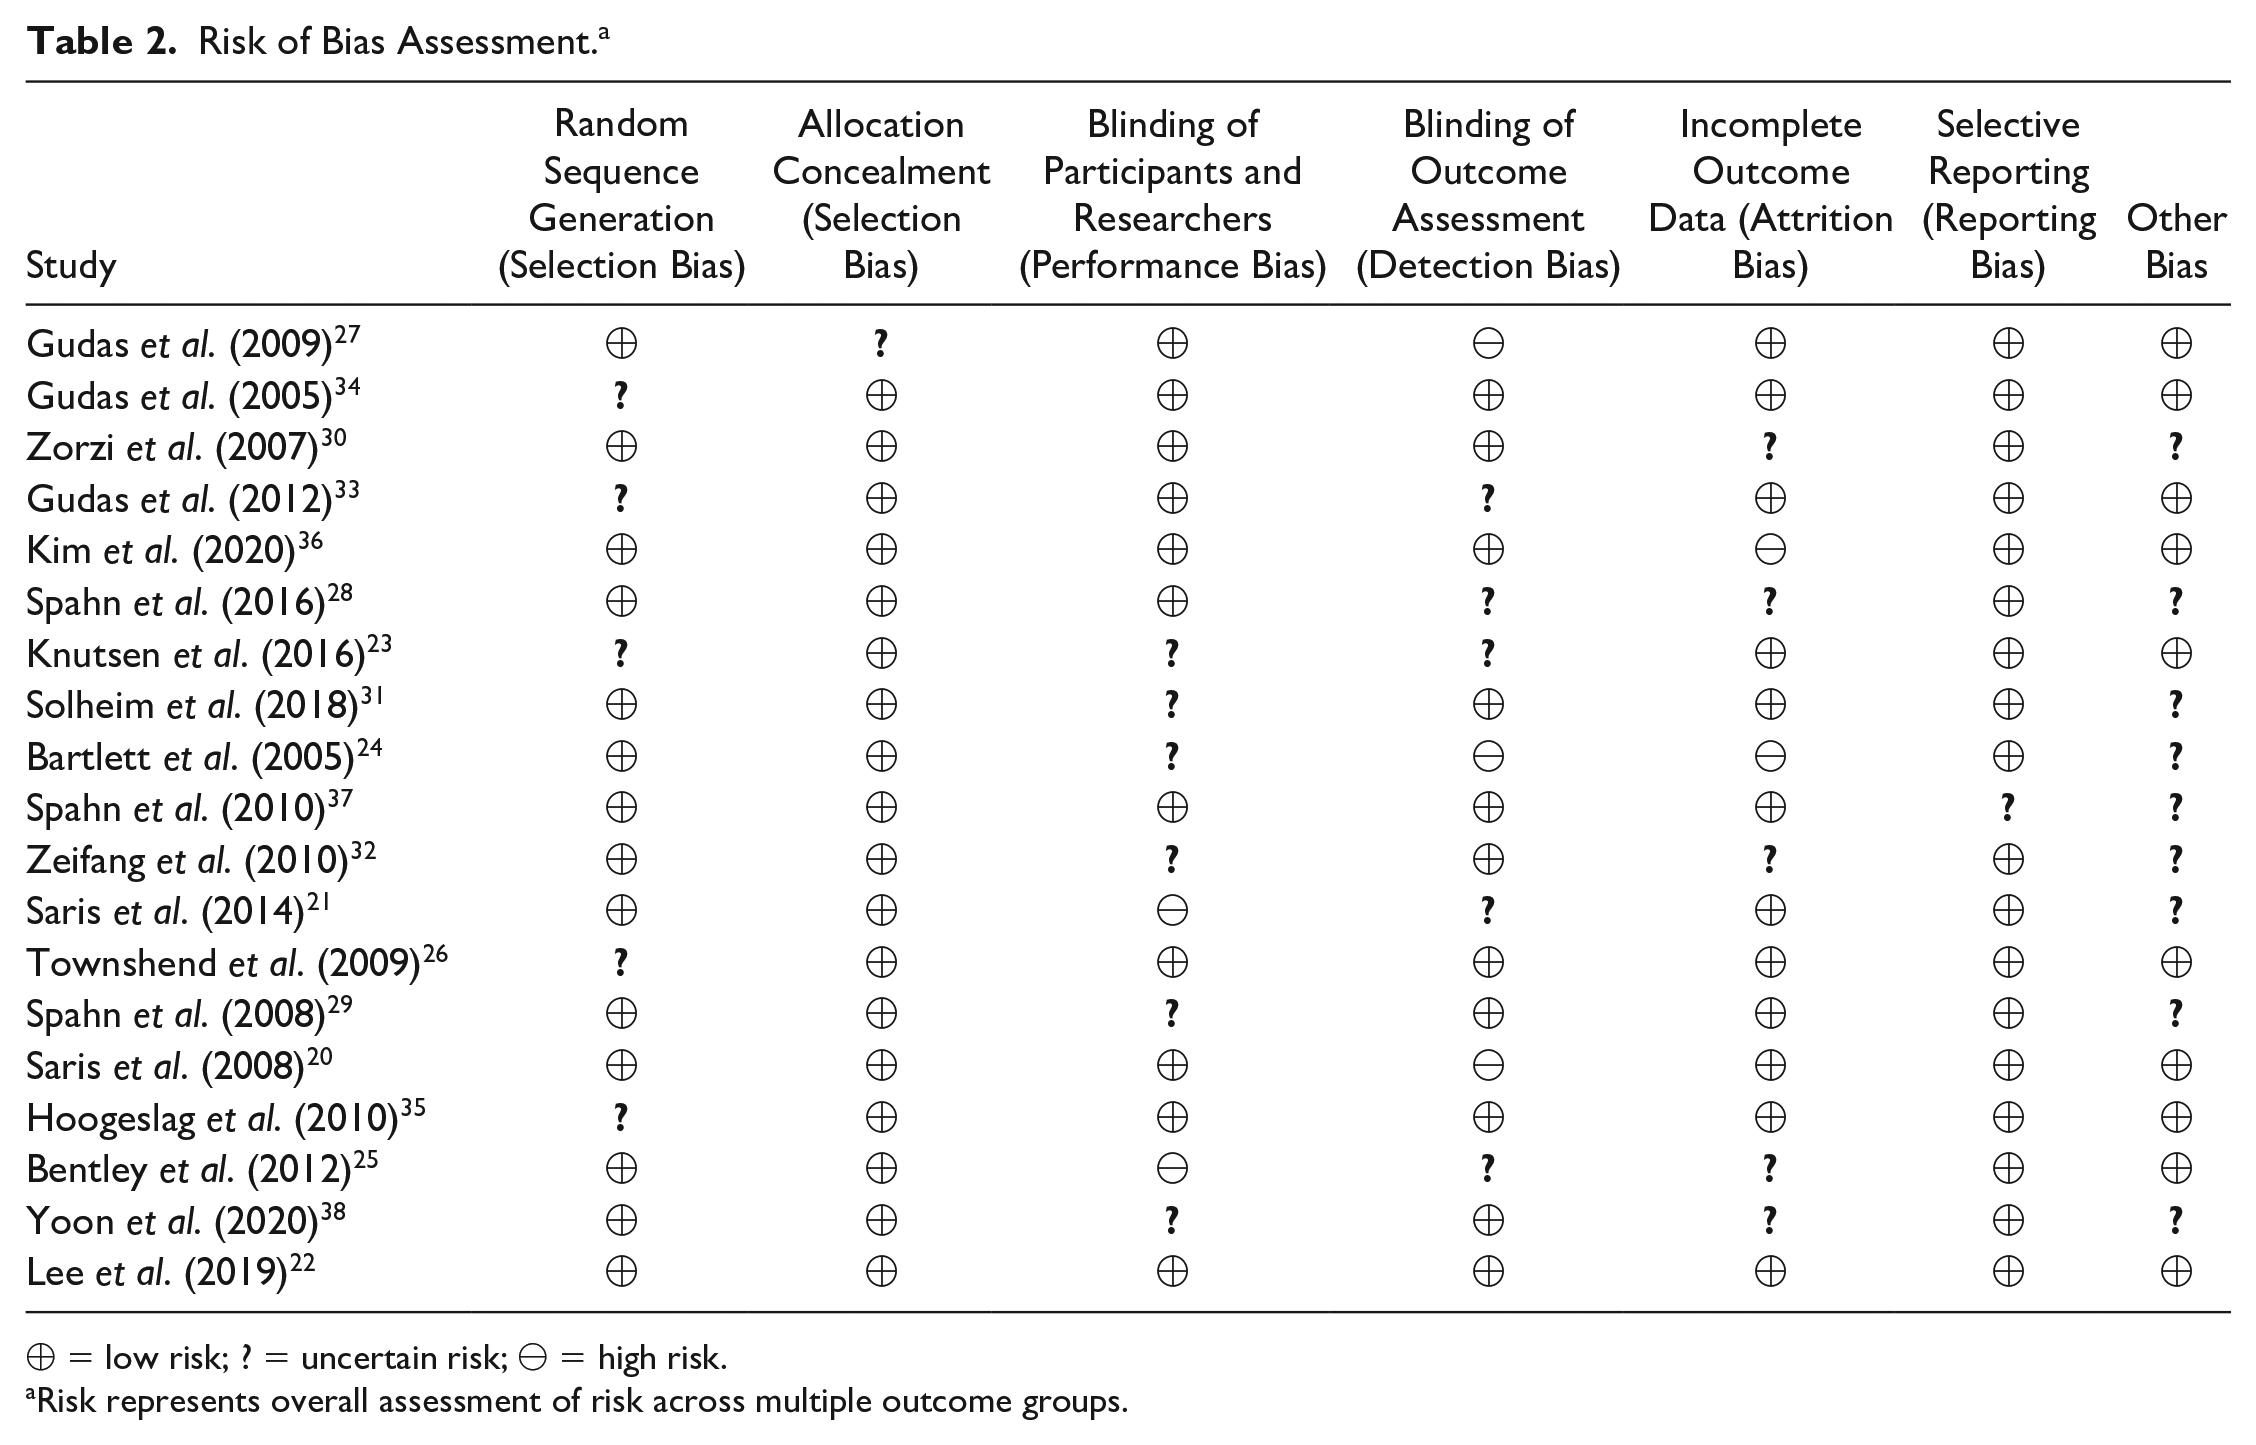
⊕ = low risk; ? = uncertain risk; ⊖ = high risk.
Risk represents overall assessment of risk across multiple outcome groups.
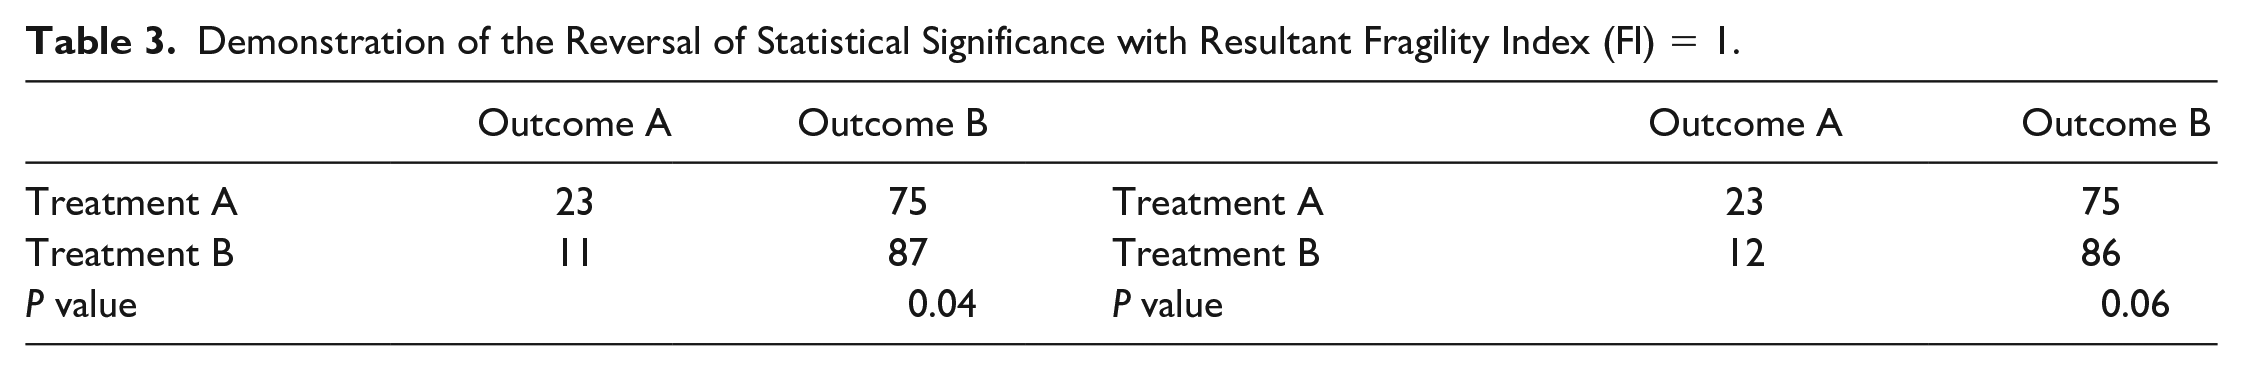
Fragility analysis was performed through the manipulation of a 2-by-2 contingency table containing the dichotomous outcome events extracted from comparative trials. For each statistically significant result (P < 0.05), a single outcome event was reversed until the result was no longer statistically significant (P ≥ 0.05) ( Table 3 ). This process was repeated for initially non-significant results (P ≥ 0.05 to P < 0.05). The number of event reversals required to change the significance of a result was recorded as the FI of the outcome. An FQ was then generated by dividing each outcome’s FI by the sample size of its study. The median FI and FQ across all outcome measures were calculated, representing the fragility measures for our entire study. We further stratified FI and FQ results by the following prespecified subgroups: initial significance (P ≥ 0.05 vs. P < 0.05), outcome type (primary vs. secondary), and year of publication. Two-tailed Fisher exact tests were used to verify the P values reported in each study as well as to generate P values during FI analysis. Interquartile ranges (IQRs) were calculated for all reported FI and FQ data.
Demonstration of the Reversal of Statistical Significance with Resultant Fragility Index (FI) = 1.
Results
After confining PubMed results to our specified journal and publication date criteria, 48,881 studies were available for screening. Nineteen RCTs from 6 journals were eligible for inclusion and formed the basis of this study.20-38All included studies evaluated the surgical management of articular cartilage defects of the knee; the following interventions were utilized in at least one arm of any study: 7 cell-based therapies such as autologous chondrocyte implantation (ACI), 9 microfracture, 7 arthroscopic techniques (e.g., debridement, radiofrequency ablation), and 5 osteochondral autograft transplantation.
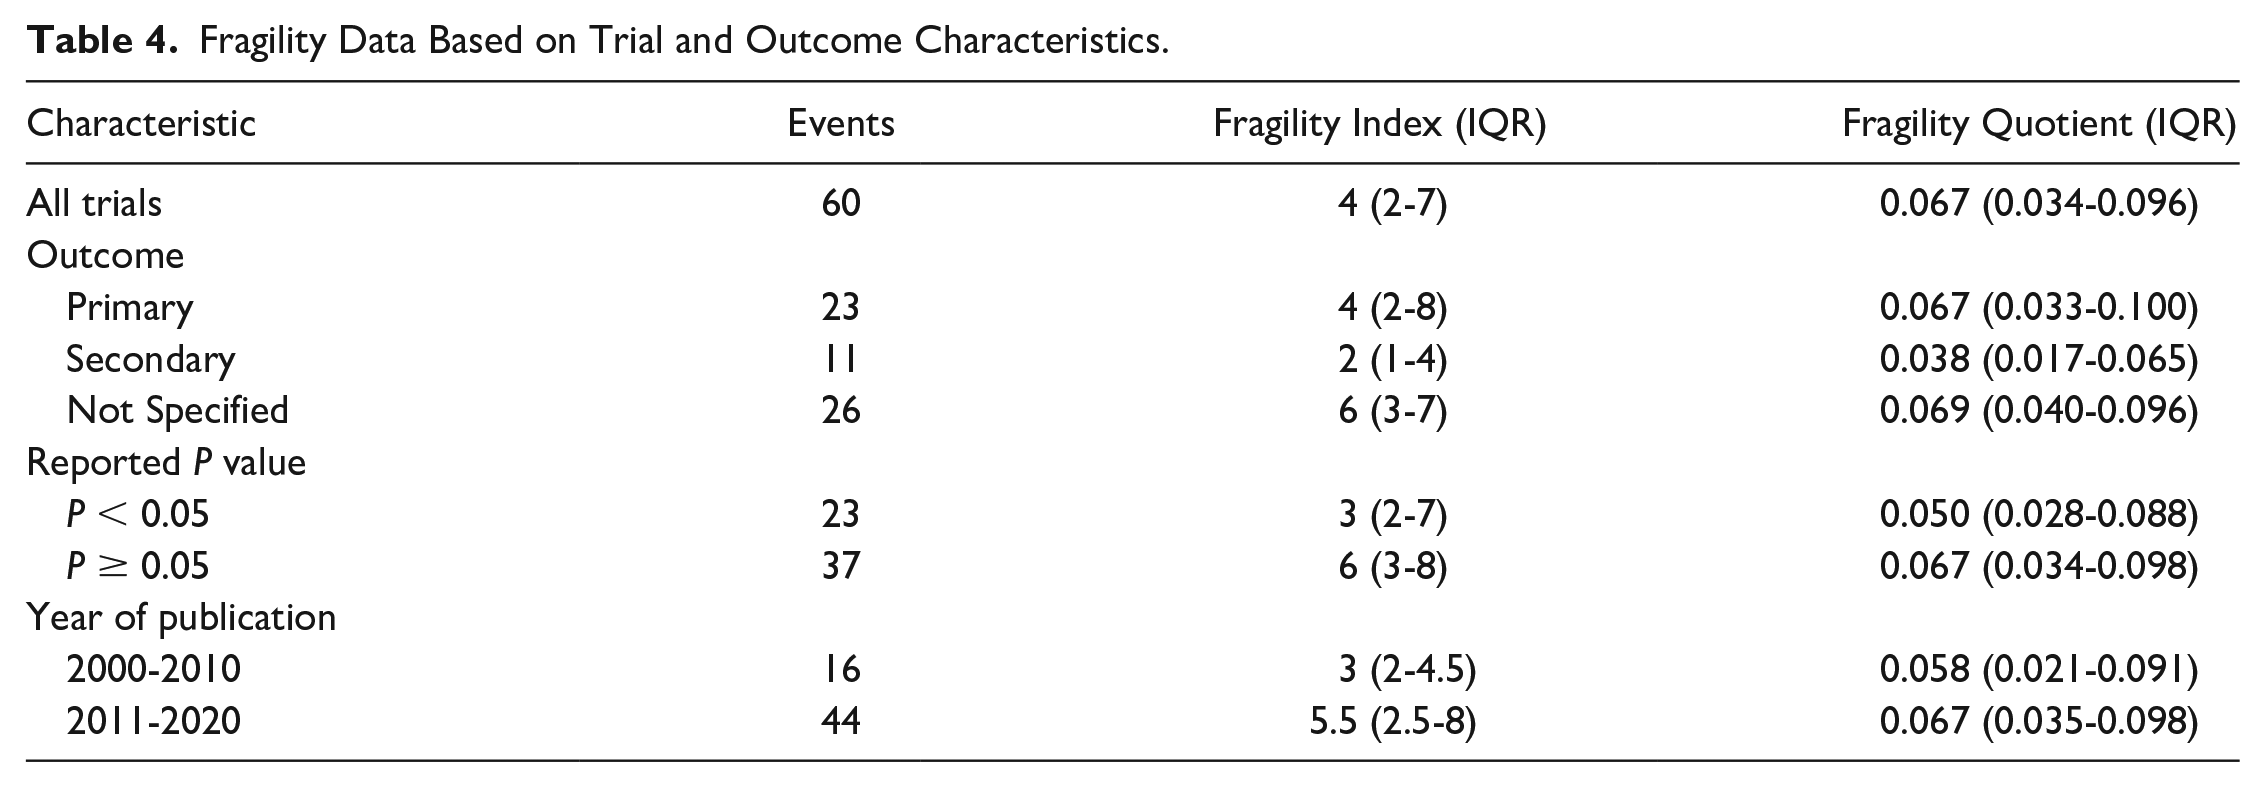
Of the 60 total outcome events reported across the included studies, 38%were statistically significant (P < 0.05) and 62% were not significant ( Fig. 1 ). The median FI and FQ across all 60 outcome events was only 4 (IQR 2-7) and 0.067 (IQR 0.034-0.096), respectively. A FI ≤ 2 was determined for 30% of all outcome events; 7 with a FI of 1 and 11 with a FI of 2. Of the 60 total outcome events, 38% represented primary outcomes, 18% secondary outcomes, and 43% were specified as neither primary nor secondary. Primary outcomes demonstrated a median FI of 4 (IQR 2-8) and FQ of 0.067 (IQR 0.033-0.100). Secondary outcomes demonstrated a median FI of 2 (IQR1-4) and FQ of 0.038 (IQR 0.0187-0.065). Outcomes not specified demonstrated a median FI of 6 (IQR 3-7) and FQ of 0.069 (IQR 0.040-0.096). A total of 23 outcomes (38%) initially reported as significant demonstrated a median FI and FQ of 3 (IQR 2-7) and 0.050 (IQR 0.028-0.088), respectively. A total of 37 outcomes (62%) initially reported as nonsignificant demonstrated a median FI and FQ of 6 (IQR 3-8) and 0.067 (IQR 0.034-0.098), respectively. Trials published between 2000 and 2010 represented 27% of the total outcome events with a FI and FQ of 3 (IQR 2-4.5) and 0.058 (IQR 0.021-0.091), respectively. Trials published in the following decade between 2011 and 2020 represented 73% of the total outcome events with a FI and FQ of 5.5 (IQR 2.5-8) and 0.067 (IQR 0.035-0.098), respectively. A complete description of the fragility analysis can be found in Table 4 . The average LTF across all trials was 3.9 patients. Of the 19 RCTs, 15.8% (3 studies) demonstrated LTF greater than or equal to the overall FI of 4.
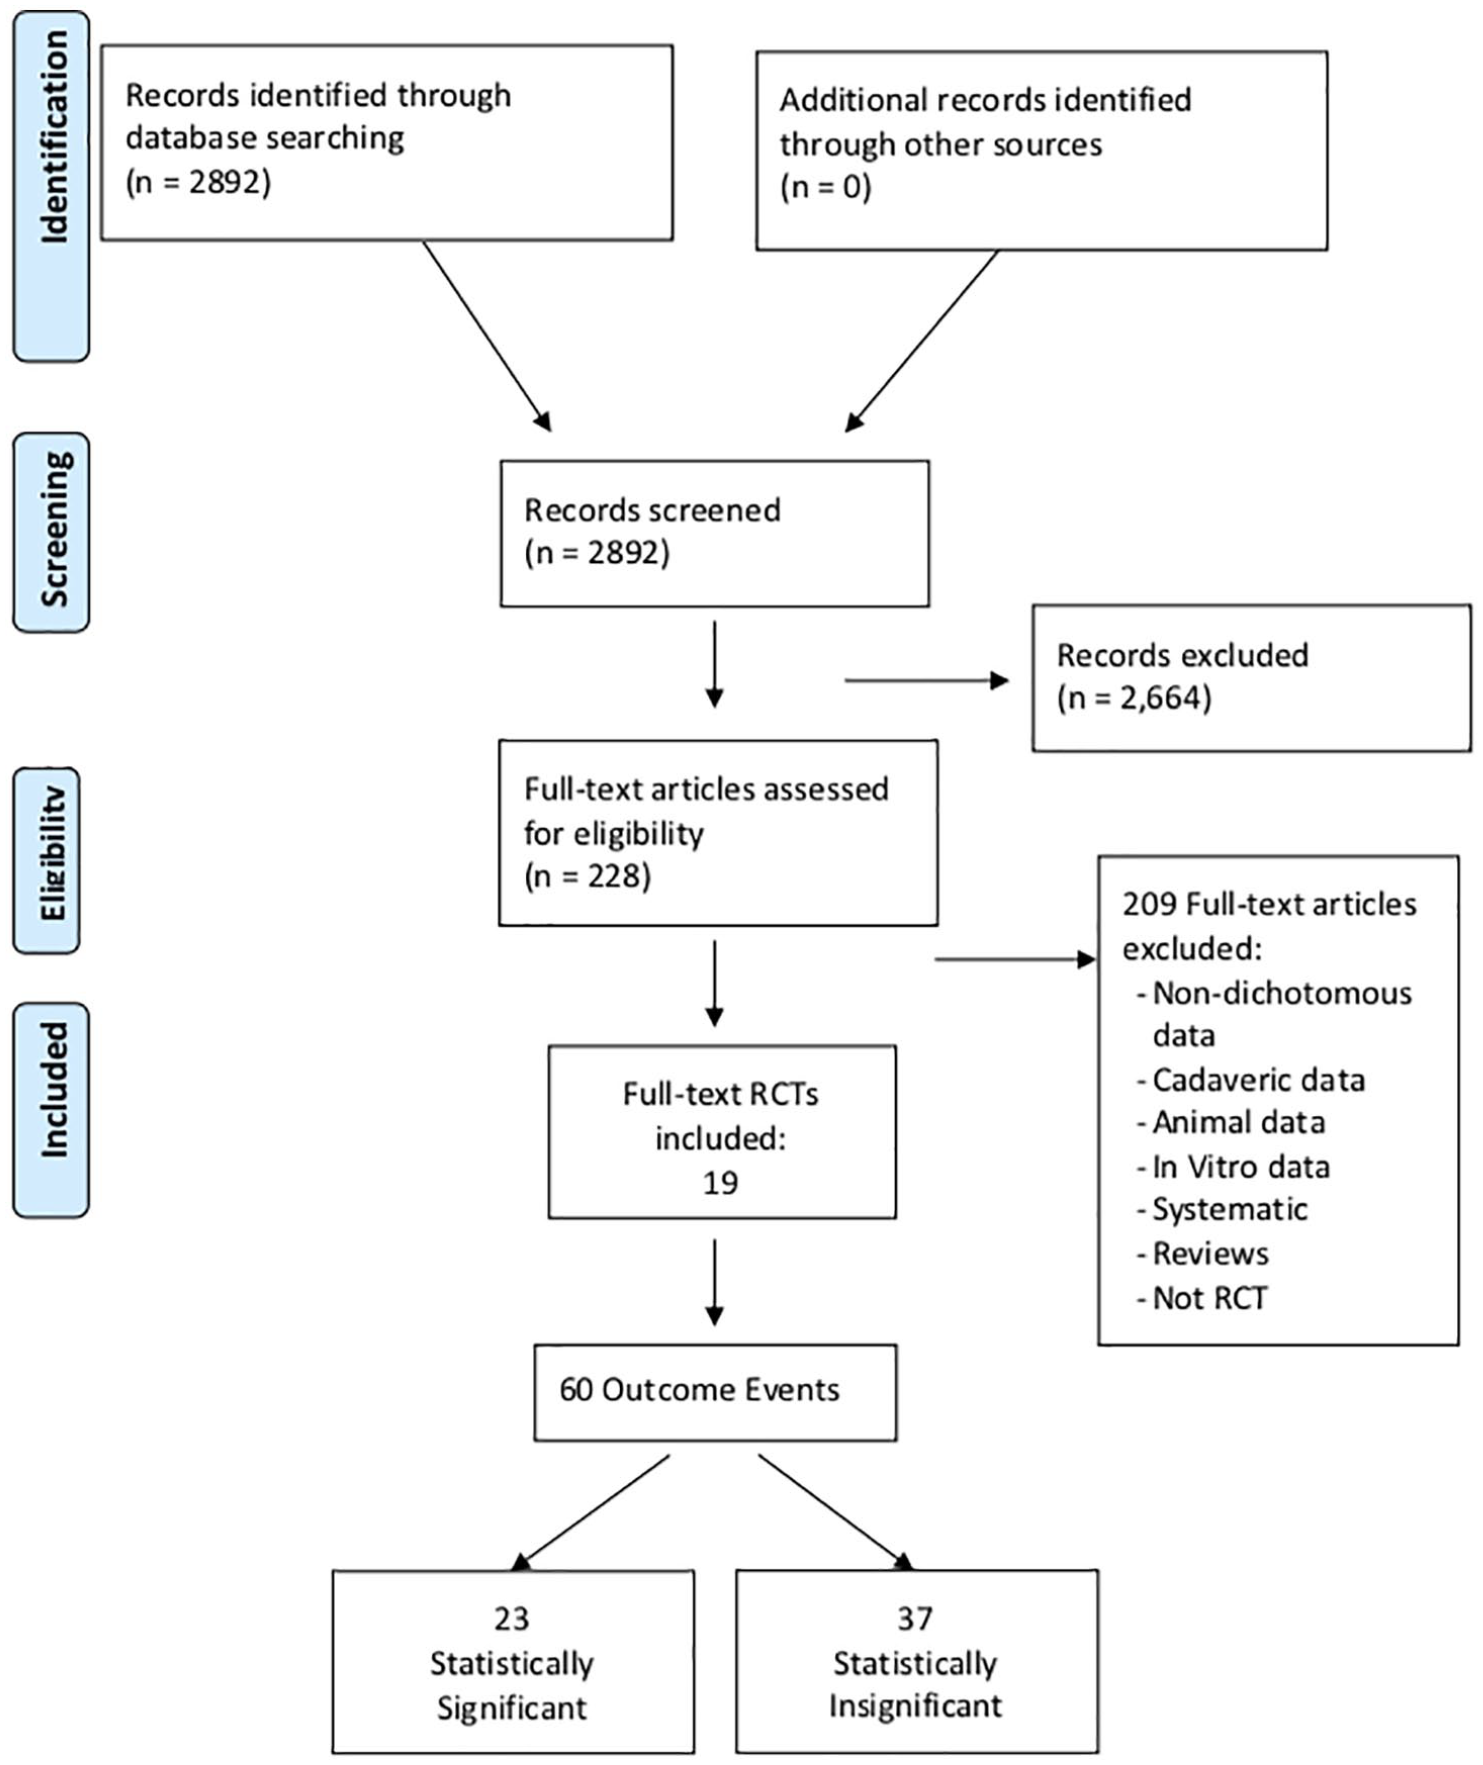
PRISMA (Preferred Reporting Items for Systematic Reviews and Meta-Analyses) flowchart.
Fragility Data Based on Trial and Outcome Characteristics.
Bias Assessment
Fourteen studies (73.7%) were at low risk of selection bias due to inadequate random sequence generation and 5 (26.3%) were at uncertain risk. Eighteen studies (94.7%) were at low risk of selection bias due to inadequate allocation concealment and 1 (5.3%) was at uncertain risk. For both attrition and performance bias, 11 (57.9%) were low risk, 5 (26.3%) were of uncertain risk, and 2 (10.5%) showed high risk of bias. Evaluation of detection bias showed similar results, with 11 (57.9%) low-risk, 5 (26.3%) uncertain-risk, and 3 (15.8%) high-risk studies. Reporting bias was generally low, with 18 (94.7%) studies showing low risk of bias and only 1 (5.3%) showing uncertain risk. Evaluation of additional biases not outlined in the tool showed 10 (52.6%) studies to be at low risk and 9 (47.4%) to be at uncertain risk.
Discussion
The purpose of this study was to utilize fragility analysis to assess the robustness of RCTs evaluating the management of articular cartilage defects of the knee. Fragility analysis revealed the median FI and FQ across all outcomes to be 4 and 0.067, respectively. These results indicate that the reversal of only 6.7 outcome events per 100 subjects is sufficient to alter the significance of a study’s findings. Furthermore, 30% of all outcomes demonstrated a FI of only 1 or 2. Fragility was demonstrated across all subgroups of analysis with LTF exceeding the median FI in more than 15% of studies. Subgroup fragility analysis by year revealed increased trial robustness in the second decade (2011-2020) of study with an FI of 5.5 versus an FI of only 3 for the previous decade (2000-2010).
Statisticians have been calling attention to the incompatibility of P values and hypothesis testing since their introduction in the early 20th century, yet the bond between these 2 statistical methods has only grown stronger.39,40 This ubiquity, however, has attracted critical attention regarding the independent utilization of P values to ascertain statistical significance in medical research. Growing concern regarding the interpretation of P values in the research community led the American Statistical Association to release a statement clarifying the role of this controversial value in research. 41 Through description of 6 principles, the authors highlighted some of the most common misuses and misconceptions surrounding P values. In addition to calling out the conflation of statistical significance with clinical significance, the authors noted that the statistic does not provide a complete picture of the evidence surrounding a hypothesis, and that overuse of P values “as a license for making a claim of a scientific finding leads to considerable distortion of the scientific process.” 41 Finally, primary P value utilization has led publications to preferentially accept studies reporting significant results and may influence researchers to manipulate data in order to achieve such desired results. 42
Several alternative methods for interpreting study results have been proposed given the problematic nature of the P value. Confidence intervals (CIs) have received the support of a number of researchers who believe that their emphasis on estimation rather than a precise threshold for significance would better encapsulate a study’s results.5,43,44 The use of CIs has not been universally supported to replace the status quo, however, and many believe its interpretation to be less straightforward than the P value and thus less likely to be adopted by the medical community. 45 An alternative suggestion is simply lowering the standard threshold for significance (i.e., P < 0.05 to P < 0.001), with advocates of the approach believing it may improve reproducibility of studies and lower the rate of false positives.46,47 However, critics point out that this change would result in more false negatives and fails to address publication and other biases. Furthermore, isolated P value analysis does not address the context in which a study occurs, which has been described as the interplay between a study’s sample size and effect size. 48
FI and FQ are 2 metrics that can address the context in which a P value is reported by providing readers a sense of the stability of a given P value. Walsh et al. 11 pioneered this approach in 2014 when they reviewed 399 RCTs with median sample size of 682, reporting a median FI of 8. They further discovered that the number of patients LTF was greater than the FI calculated for over 50% of the included RCTs, indicating that claims of significance had the potential to be reversed if all patients were appropriately maintained to follow-up. Shochet et al. 8 described similar results in their study of 127 RCTs in nephrology with a median FI of 3 and over 40% of studies revealing a LTF greater than their respective FI. As the use of the FI to aid in interpretation of study results has grown, Ahmed et al. 6 noted that the absolute nature of the FI makes it difficult to compare the FI across studies. He therefore proposed dividing the FI by the study’s sample size in order to generate the FQ, a relative indication of robustness that can be interpreted across studies. The FI and FQ have since been adopted by a number of researchers in an attempt to add additional clarity to the interpretation of results.49-51
The FI and FQ have also been utilized for orthopedic research, often illustrating a body of literature whose results are far from robust. A recent article by Forrester et al. 15 of 23 clinical trials in orthopedic oncology reported a median FI of 2, which the authors attributed to small sample sizes and large losses to follow-up. In a similar study examining 48 RCTs in sports medicine, Khan et al. 13 found results to be fragile with a median FI of 2 and loss to follow-up exceeding a study’s FI for nearly half (48%) of outcomes. Parisien et al. 14 reported the same trend in the orthopedic trauma literature, where analysis of 198 comparative studies revealed a median FI of 5 and an FQ of 0.046. These studies show that the fragility of clinical findings is pervasive in the orthopedic literature and emphasize the importance of the FI and FQ as tools in critically assessing a study’s findings. This is the first study to examine the fragility of literature specifically evaluating articular cartilage defects of the knee. While many nonoperative and operative treatments exist to address these conditions, the findings of our study suggest the literature is fragile and highlights the importance of expanding clinicians’ ability to critically interpret the clinical significance of study findings.
Our study has several strengths, beginning with our methodology. We identified 11 prominent journals known to include high-quality studies on articular cartilage defects of the knee, ensuring that we identified the studies with the highest impact on treatment of these disorders. In addition to FI, we derived the FQ of included studies in order to address the effect sample size plays on FI. Finally, our inclusion of primary, secondary and outcomes not specified along with both significant and nonsignificant outcomes, further strengthens our study by allowing a more complete assessment of the literature. However, one limitation that is inherent to the method of fragility analysis is its application to only dichotomous comparative trials, leaving trials that report continuous outcomes unevaluated. Furthermore, P value and fragility analyses provide an understanding of statistical significance but are not sufficient in the determination of clinical significance. The clinician must incorporate other information such as qualitative integrity of study design and the presence or absence of bias when evaluating clinical research findings.
Conclusion
The orthopedic literature evaluating articular cartilage defects of the knee is fragile as the reversal of relatively few outcome events may alter the significance of statistical findings. We therefore recommend comprehensive fragility analysis and triple reporting of the P value, FI, and FQ to aid in the interpretation and contextualization of clinical findings reported in the cartilage restoration literature.
Supplemental Material
sj-pdf-1-car-10.1177_19476035211012458 – Supplemental material for The Fragility of Statistical Significance in Cartilage Restoration of the Knee: A Systematic Review of Randomized Controlled Trials
Supplemental material, sj-pdf-1-car-10.1177_19476035211012458 for The Fragility of Statistical Significance in Cartilage Restoration of the Knee: A Systematic Review of Randomized Controlled Trials by Robert L. Parisien, Michael Constant, Bryan M. Saltzman, Charles A. Popkin, Christopher S. Ahmad, Xinning Li and David P. Trofa in CARTILAGE
Footnotes
Acknowledgments and Funding
The author(s) received no financial support for the research, authorship, and/or publication of this article.
Declaration of Conflicting Interests
The author(s) declared the following potential conflicts of interest with respect to the research, authorship, and/or publication of this article: Robert L. Parisien: American Orthopaedic Society for Sports Medicine: Board or committee member; Arthroscopy: Editorial or governing board; Society of Military Orthopaedic Surgeons: Board or committee member. Bryan M. Saltzman: Nova Science Publishers: Publishing royalties, financial or material support. Charles A. Popkin: Arthrex, Inc: Other financial or material support; research support; Smith & Nephew: Other financial or material support; USA Hockey Safety and Protective Equipment Committee: Board or committee member Christopher S. Ahmad: Arthrex, Inc.: IP royalties; paid consultant; research support; At Peak: Stock or stock options; Lead Player: Publishing royalties, financial or material support; Major League Baseball: Research support; Orthopedics Today: Editorial or governing board; Stryker: Research support. Xinning Li: AAOS: Board or committee member; American Journal of Sports Medicine: Editorial or governing board; American Shoulder and Elbow Surgeons: Board or committee member Arthroscopy Association of North America: Board or committee member; BMC Musculoskeletal Disorders: Editorial or governing board; FH Ortho: IP royalties; paid consultant; Journal of Bone and Joint Surgery–American: Editorial or governing board; Journal of Medical Insight (JOMI): Editorial or governing board; Orthopedic Reviews: Editorial or governing board World Journal of Orthopaedics: Editorial or governing board. David P. Trofa: Education support from Arthrex, Gotham Surgical Solutions & Devices, Peerless Surgical, Smith & Nephew; Grants from Smith & Nephew, Arthrex.
References
Supplementary Material
Please find the following supplemental material available below.
For Open Access articles published under a Creative Commons License, all supplemental material carries the same license as the article it is associated with.
For non-Open Access articles published, all supplemental material carries a non-exclusive license, and permission requests for re-use of supplemental material or any part of supplemental material shall be sent directly to the copyright owner as specified in the copyright notice associated with the article.