
Abstract
Background:
Progressive collapsing foot deformity (PCFD) is a progressive hindfoot and midfoot deformity causing pain and disability. Although operative treatment is stage dependent, few studies have looked at patient-reported and radiographic outcomes stratified by primary vs revision stage II, III, and IV reconstruction surgery. Our goal was to assess operative improvement using Patient-Reported Outcomes Measurement Information System (PROMIS) and to determine whether radiographic parameter improvement correlates with patient-reported outcomes.
Methods:
PROMIS Physical Function (PF) and Pain Interference (PI) scores were prospectively obtained on 46 consecutive patients who underwent PCFD reconstruction between November 2013 and January 2019. Thirty-six patients completed pre- and postoperative PROMIS surveys, 6 patients completed only preoperative PROMIS surveys, and 4 patients completed 12-month postoperative PROMIS surveys but did not complete preoperative PROMIS surveys. Minimum follow-up was 12 (average, 23) months. Radiographic correction was measured with pre- and postoperative weightbearing radiographs and correlated with PROMIS scores. Measurements included the talonavicular uncoverage angle, talonavicular uncoverage percentage, anteroposterior talo–first metatarsal angle, Meary angle, medial cuneiform height (MCH), and medial cuneiform–fifth metatarsal height.
Results:
For the overall cohort, PROMIS PF increased significantly from 37.5±5.6 to 42.3±7.1 (P = .0014). PROMIS PI improved significantly from 64.5±6.0 to 55.1±9.8 (P < .0001). Preoperative, postoperative, and change in PROMIS scores were not statistically different between PCFD stages. Change in PROMIS PI was significantly greater in primary (–12.3) vs revision (–3.7) surgery (P = .0157). Change in PROMIS PF was greater in primary (+6.0) vs revision surgery (+2.3) but did not reach statistical significance. All radiographic measurements improved significantly (P < .05). In primary stage II PCFD, postoperative PROMIS scores correlated with postoperative MCH (PF: r = 0.7725, P = .0020; PI: r = –0.5692, P = .0446).
Conclusion:
Patient-reported and radiographic outcomes improved significantly after PCFD reconstruction. We found no significant difference in preoperative, postoperative, or change in PROMIS scores between PCFD stages. However, stage III patients had smaller improvements in PROMIS PF, which we feel may be secondary to change in function after arthrodesis. Primary operations had better patient-reported outcomes compared to revision operations. In primary stage II PCFD, reconstructing the medial arch height correlated significantly with improvement in pain and functionality.
Level of Evidence:
Level II, prospective cohort study.
Keywords
Introduction
Progressive collapsing foot deformity (PCFD) or posterior tibial tendon dysfunction (PTTD) is a progressive hindfoot and midfoot deformity that causes pain and disability in approximately 3% of the population. 25 It presents as a planovalgus deformity from the failure of static and dynamic medial osseoligamentous stabilizers. The static structures include the deltoid ligament, spring ligament, plantar fascia, interosseous ligament, and capsule of the talonavicular joint. The primary dynamic stabilizer is the posterior tibial tendon (PTT). 40 Attenuation of these hindfoot and midfoot stabilizers can lead to hindfoot valgus, collapse of the medial longitudinal arch, and forefoot/midfoot abduction. 11,44
Operative treatment of PCFD is broadly based on the stage of deformity. 11 There are 4 main stages of deformity; the first 3 stages were originally described by Johnson and Strom, 21 with the last stage added by Myerson. 31 Stage I, generally managed nonoperatively, consists of tenosynovitis or tendinosis of the PTT with deformity. Stage II involves a passively correctable, flexible deformity of the foot, including forefoot and midfoot abduction and hindfoot valgus. 11,29 Operative treatment focuses on joint-preserving procedures, including a combination of flexor digitorum longus tendon transfer, peroneus brevis tendon to longus transfer, medial displacement calcaneal osteotomy, lateral column lengthening, Cotton medial cuneiform osteotomy, first tarsometatarsal arthrodesis, gastrocnemius recession, and spring ligament reconstruction. 9,40 Stage III involves a fixed or arthritic deformity of the foot, associated with an inability to passively invert the triple-joint complex and fixed hindfoot valgus. 11 Operative treatment shifts to joint-sacrificing procedures; a combination of fusions involving the subtalar, talonavicular, and calcaneocuboid joint can be performed, with the most common being the medial double and triple arthrodeses. 11 Stage IV consists of marked deformity of the foot and ankle caused by failure of the deltoid ligament and subsequent valgus deformity of the tibiotalar joint. 11,40 Operative treatment, depending on severity of deformity, includes deltoid ligament reconstruction and any other procedure that may be indicated for PCFD reconstruction, ankle or tibiotalocalcaneal arthrodesis, or ankle replacement with associated hindfoot correction. 11,40
Patient-reported outcomes (PROs) are increasingly being used to complement clinical and radiographic outcomes as the field shifts toward value-based care. 41 Although PROs have been used in prior PCFD studies, these studies have been conducted using legacy PROs such as the American Orthopaedic Foot & Ankle Society (AOFAS) ankle-hindfoot score, 36-Item Short Form Health Survey (SF-36), visual analog scale (VAS), and Foot and Ankle Outcome Scale (FAOS). 4,12,15,17 -19,26,30,32,33,35,43,45 Patient-Reported Outcomes Measurement Information System (PROMIS), a computerized adaptive testing system, was created by the NIH to address weaknesses present in legacy PROs. These weaknesses include a lack of generalizability, floor and ceiling effects, and large administrator costs and user fatigue associated with excessive time to complete. 16 PROMIS was recently validated in foot and ankle surgery, 1,20 but to our knowledge, only Brodell et al 7 have used PROMIS to map outcomes in patients with PCFD.
The purpose of this study was to review our experience with prospectively collected patient-reported and radiographic outcomes of patients who underwent PCFD reconstruction for stage II, III, and IV deformity. Only Deland et al 12 has looked at PCFD reconstruction outcomes stratified by PCFD stage. This study aimed to expand on this literature by using PROMIS, rather than the AOFAS scale, and to also provide results on stage IV deformity, which was not studied by Deland et al. 12 In addition, this study provides outcomes of patients who underwent primary and revision operations. To our knowledge, no study has looked at primary vs revision operations. The goal of this study was to improve clinical decision making for both the surgeon and the patient by providing data on expected patient-reported and radiographic outcomes for PCFD reconstruction, stratified by stage of deformity and primary vs revision procedures.
Methods
After obtaining institutional review board approval, we prospectively obtained PROMIS scores on 389 unique patients who underwent any hindfoot operation at a multisurgeon tertiary care center between November 2013 and January 2019. Inclusion criteria were established for this study including age greater than 18 years, provision of informed consent, a radiographic and clinical diagnosis of PCFD, and ability to read and write English to complete required PROMIS surveys. Exclusion criteria included alternative diagnosis or operation, invalid contact information, nonelective surgery, and less than 12 months of follow-up. All operations and clinic visits were with one of 2 fellowship-trained foot and ankle surgeons. Patients who underwent an operation for primary or revision stage II, III, or IV PCFD were included in this study. All patients were staged by the senior author according to PCFD stage prior to any operation. Patients who underwent a primary operation were staged prospectively prior to their index procedure; in revision cases, patients were staged based on radiographs prior to their first procedure and accompanying operative reports obtained from outside hospitals.
Forty-six patients were included in this study. Patient demographics are shown in Table 1. Thirty-six patients completed preoperative and 12-month postoperative PROMIS surveys, 6 patients completed only preoperative PROMIS surveys, and 4 patients completed 12-month postoperative PROMIS surveys but did not complete preoperative PROMIS surveys (Figure 1). Average time of follow-up was 23.0 (range, 12.0-63.6) months. Twenty patients underwent stage II reconstruction, 5 of which were revision surgeries; 19 patients underwent stage III reconstruction, 8 of which were revision surgeries; and 7 patients underwent stage IV reconstruction, all of which were primary surgeries. Radiographic examples of a stage II reconstruction (Figures 2 and 3), a severe stage III reconstruction (Figures 4 and 5), and a stage IV reconstruction (Figures 6 and 7) are provided.
Demographics.a

a Unless otherwise noted, values are n (%).

Selection of patients included for analysis. The figure demonstrates inclusion and exclusion criteria used in this study to arrive at the final cohort.

Preoperative weightbearing radiographs of a patient with stage II PCFD and 40% talonavicular abduction. (A) The anteroposterior view of the foot shows an abducted hindfoot, and (B) the lateral view of the foot shows a collapsed medial longitudinal arch. PCFD, progressive collapsing foot deformity.

One-year postoperative weightbearing radiographs of the same patient with stage II PCFD. The patient underwent medial displacement calcaneal osteotomy, flexor digitorum longus tendon to posterior tibial tendon transfer, flexor digitorum longus tendon to navicular transfer, and tibiotalocalcaneal ligament (spring-deltoid) reconstruction. There is radiographic improvement in hindfoot abduction and improvement in the Meary angle. PCFD, progressive collapsing foot deformity.

Preoperative weightbearing radiographs of a patient with severe stage III PCFD. (A) The lateral view of the foot shows collapse of the medial longitudinal arch and talocalcaneal overlap. (B) The mortise view of the ankle shows severe hindfoot valgus with normal alignment of the ankle, and (C) the anteroposterior view of the foot shows hindfoot abduction with complete dislocation of the talar head. PCFD, progressive collapsing foot deformity.

One-year postoperative weightbearing radiographs of the same patient with stage III PCFD. The patient underwent a triple arthrodesis. (A) The mortise view of the ankle shows postoperative ankle valgus that affected the patient’s postoperative pain and functionality. (B) The lateral view of the ankle shows improvement in radiographic alignment. PCFD, progressive collapsing foot deformity.

Preoperative radiographs of a patient with stage IV PCFD. (A) The mortise view of the ankle shows hindfoot valgus and ankle valgus. There is a chronic avulsion at the tip of the medial malleolus. (B) The lateral view shows a collapsed medial longitudinal arch and arthritis of the naviculocuneiform joint. PCFD, progressive collapsing foot deformity.
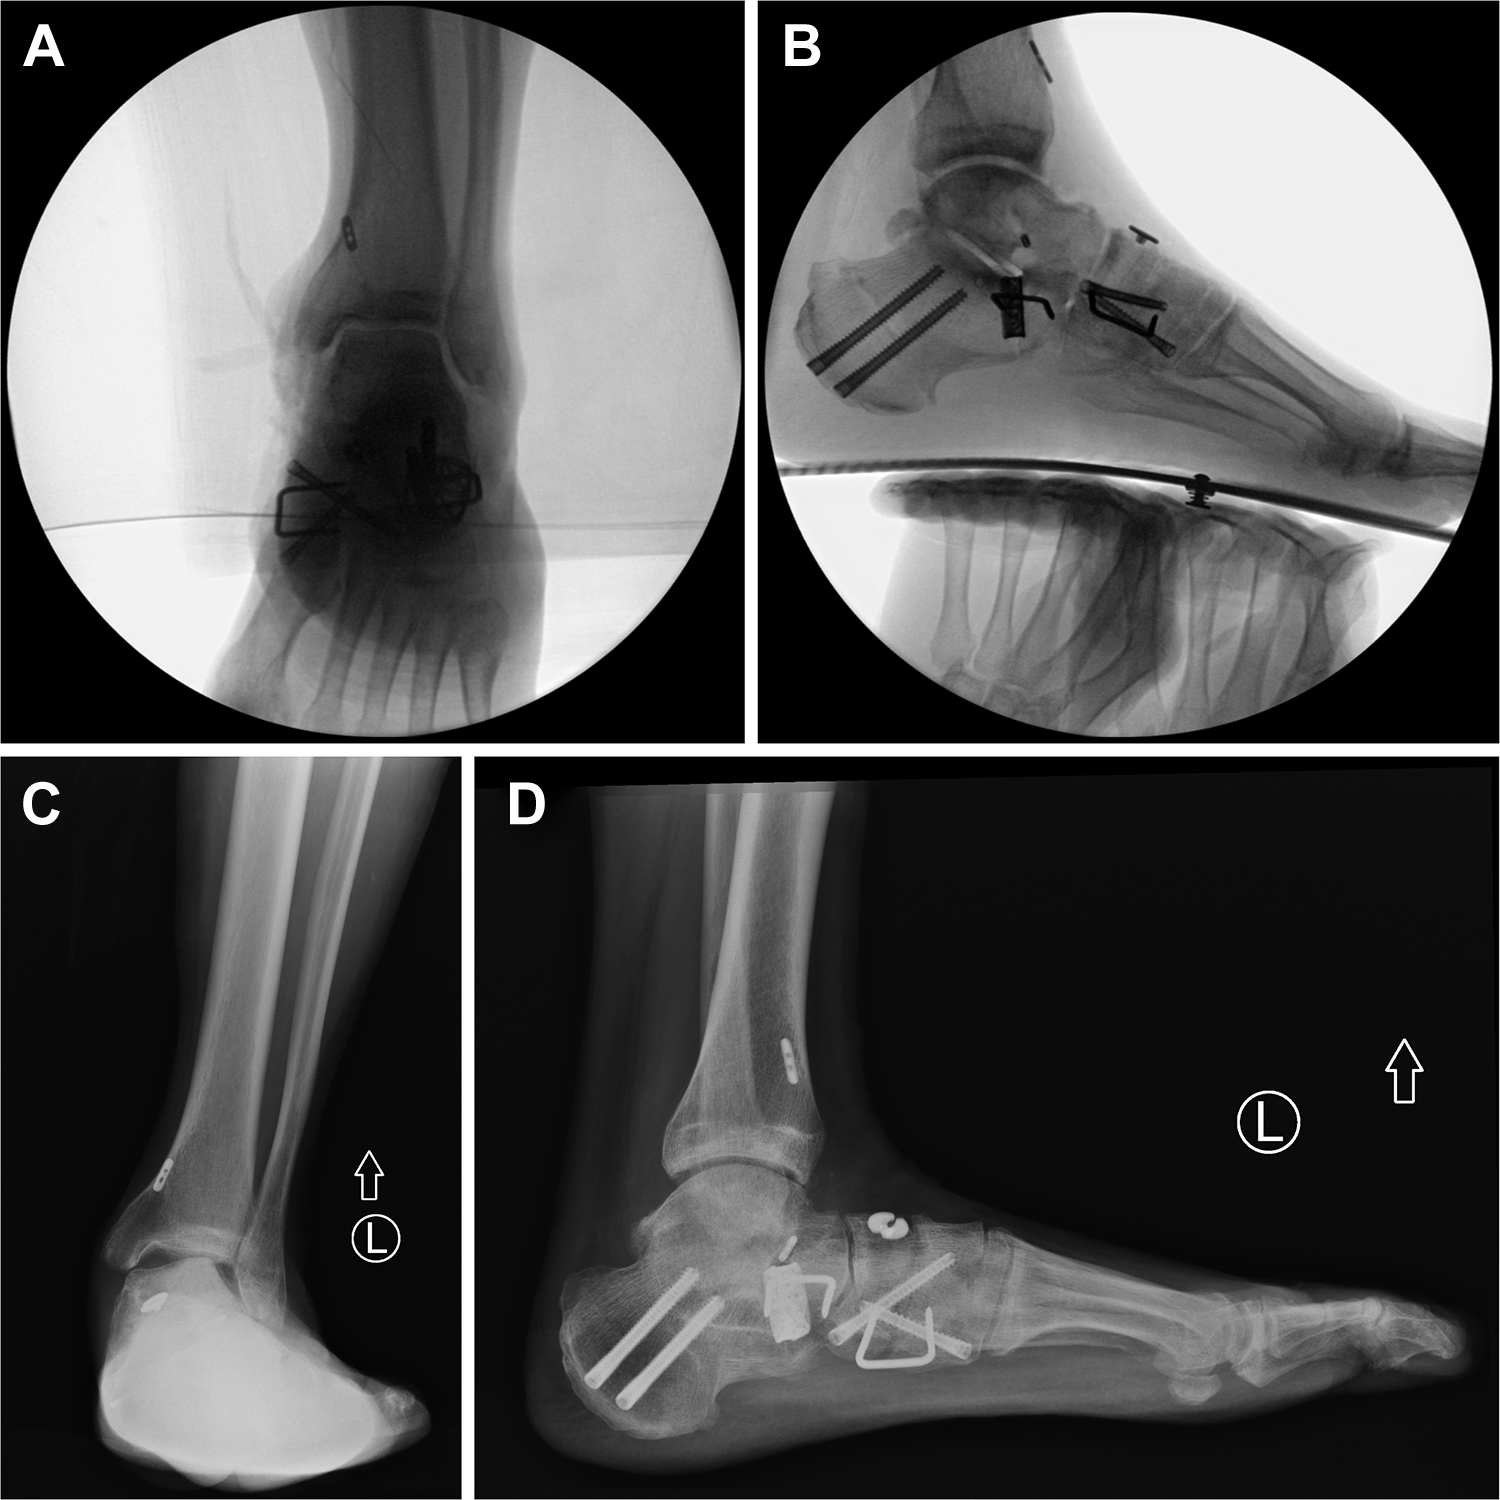
Postoperative radiographs of a patient with stage IV PCFD. (A and B) Intraoperative and (C and D) 1-year postoperative weightbearing radiographs of the same patient with stage IV PCFD. The patient underwent a medial displacement calcaneal osteotomy, lateral column lengthening, flexor digitorum longus tendon to posterior tibial tendon transfer, peroneus brevis tendon to peroneus longus tendon transfer, and a naviculocuneiform fusion. The patient also had reconstruction of the spring ligament, and deltoid ligament (including deep deltoid). The intraoperative images show good alignment of the ankle and foot (A and B). Despite intraoperative correction, the postoperative mortise view of the ankle shows persistent ankle valgus (C). Postoperative lateral view of the foot shows maintenance of correction of the medial longitudinal arch (D). PCFD, progressive collapsing foot deformity.
Operative technique varied based on the stage of the patient and presenting concomitant pathology. In cases of revision, technique was dictated significantly by what procedures had been previously done. Table 2 lists procedures performed for each patient. In stage II PCFD, patients with large spring ligament tears (>1.5 cm found intraoperatively) or talonavicular uncoverage angles greater than 30 degrees (stage IIb), the tibiocalcaneonavicular ligament (TCNL) was reconstructed with an Internal Brace (Arthrex, Naples, FL) to augment medial peritalar stability. TCNL reconstruction in patients with large spring ligament tears has been shown to be an effective method of enhancing peritalar stability when performed alongside osseous correction. 7 TCNL reconstruction is denoted as “spring, deltoid” under the category of ligamentous repair and should be differentiated in Table 2 from patients who underwent isolated spring ligament reconstruction of the calcaneonavicular ligament. In patients with stage IV PCFD, superficial and deep deltoid reconstruction was performed using allograft secured with FiberTape sutures (Arthrex). Final tensioning of the construct and rigid fixation of the anterior tibial cortex was performed using the ACL TightRope (Arthrex).
Procedures.
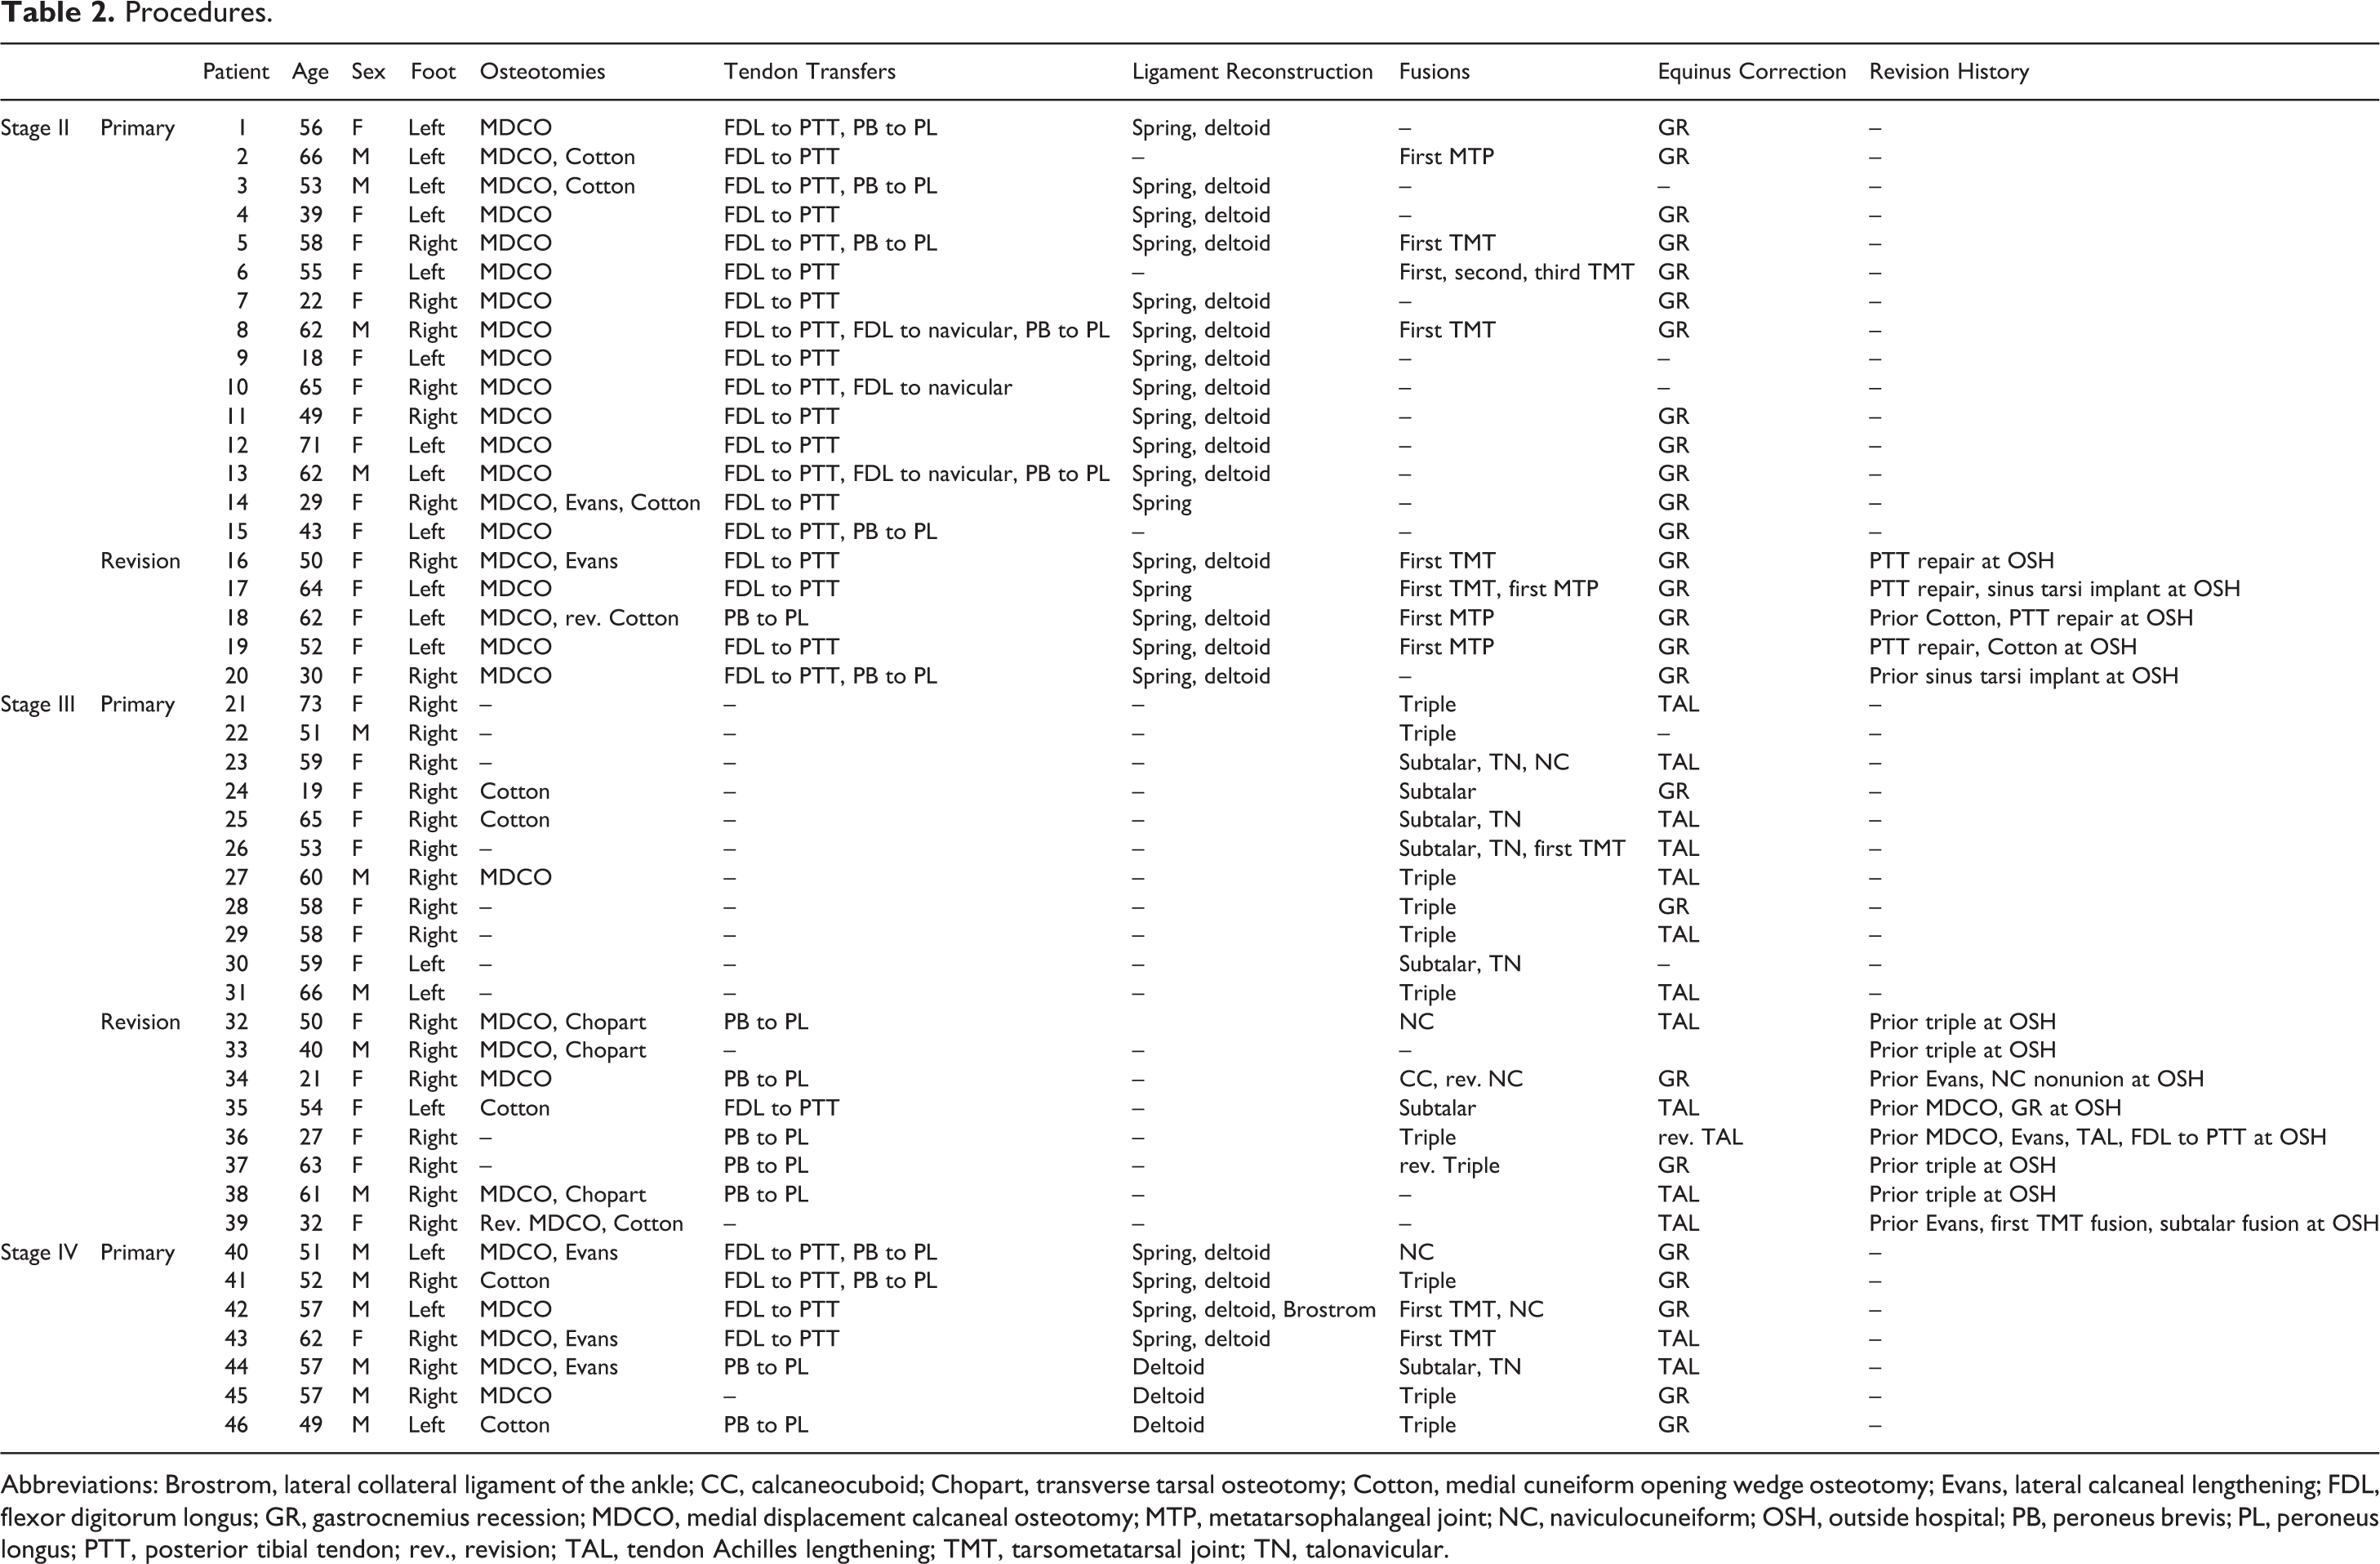
Abbreviations: Brostrom, lateral collateral ligament of the ankle; CC, calcaneocuboid; Chopart, transverse tarsal osteotomy; Cotton, medial cuneiform opening wedge osteotomy; Evans, lateral calcaneal lengthening; FDL, flexor digitorum longus; GR, gastrocnemius recession; MDCO, medial displacement calcaneal osteotomy; MTP, metatarsophalangeal joint; NC, naviculocuneiform; OSH, outside hospital; PB, peroneus brevis; PL, peroneus longus; PTT, posterior tibial tendon; rev., revision; TAL, tendon Achilles lengthening; TMT, tarsometatarsal joint; TN, talonavicular.
Patients completed the PROMIS Physical Function v1.2 (PF) and Pain Interference v1.1 (PI) surveys. The PROMIS PF scale measures a patient’s self-reported capability to perform physical activities, including dexterity, mobility, and ability to perform activities of daily living. A higher PROMIS PF score indicates higher physical function. The PROMIS PI scale measures the impact of pain on daily life. A higher PROMIS PI score indicates higher pain levels. The PROMIS CAT algorithm for each domain produced a T score standardized to the general US population with a range of 0-100, a mean of 50, and a standard deviation of 10. 28,38
Preoperative and postoperative standard weightbearing foot series radiographs (anteroposterior [AP] and lateral) were also collected. Radiographs used for our study were exported from a picture archiving and communication system (PACS, GE Healthcare, Barrington, IL) to the Centricity Universal Viewer (GE Healthcare). A fellowship-trained foot and ankle surgeon conducted relevant measurements. Six radiographic parameters were measured: talonavicular uncoverage angle, talonavicular uncoverage percentage, AP talo–first metatarsal angle, lateral talo–first metatarsal angle (Meary), medial cuneiform height, and medial cuneiform–fifth metatarsal height.
Statistical Analysis
The overall cohort was subdivided by PCFD stage and whether the operation was a primary or revision operation. Descriptive statistics were calculated for numerical variables including PROMIS scores and radiographic variables. An alpha value of 0.05 was used for this study. Each subgroup was tested for normality of distribution. All subgroups were normally distributed except the preoperative stage IV PROMIS PI cohort. Student t tests were used to compare changes in PROMIS scores preoperatively and postoperatively for all normally distributed subgroups and to determine differences between primary and revision procedures within groups. A Mann-Whitney U test was used when nonparametric testing was required. Because PROMIS scores were compared within multiple subgroups, a Bonferroni adjustment was applied. Given that there were 10 comparison groups for both PROMIS domains (see Table 3), a P value less than .005 (alpha [0.05] divided by the number of comparison groups [10]) was required to achieve significance. One-way analyses of variance were used to determine whether there were any differences in preoperative, postoperative, or change in PROMIS scores between PCFD stages. Pearson correlation coefficients were used to determine the relationship between preoperative PROMIS scores and preoperative radiographic variables, postoperative PROMIS scores and postoperative radiographic variables, and change in PROMIS scores with change in radiographic variables after reconstructive surgery. Clinical outcomes postoperatively were measured using minimum clinically important differences (MCIDs). 2 The distribution method was used to calculate MCIDs and was defined as one-half of the standard deviation of the baseline PROMIS data. 36 For this study, the MCID for PROMIS PF = +2.8 and PROMIS PI = –3.0. All statistical analysis was performed using Stata, version 15.1 (StataCorp, College Station, TX).
PROMIS Scores.a
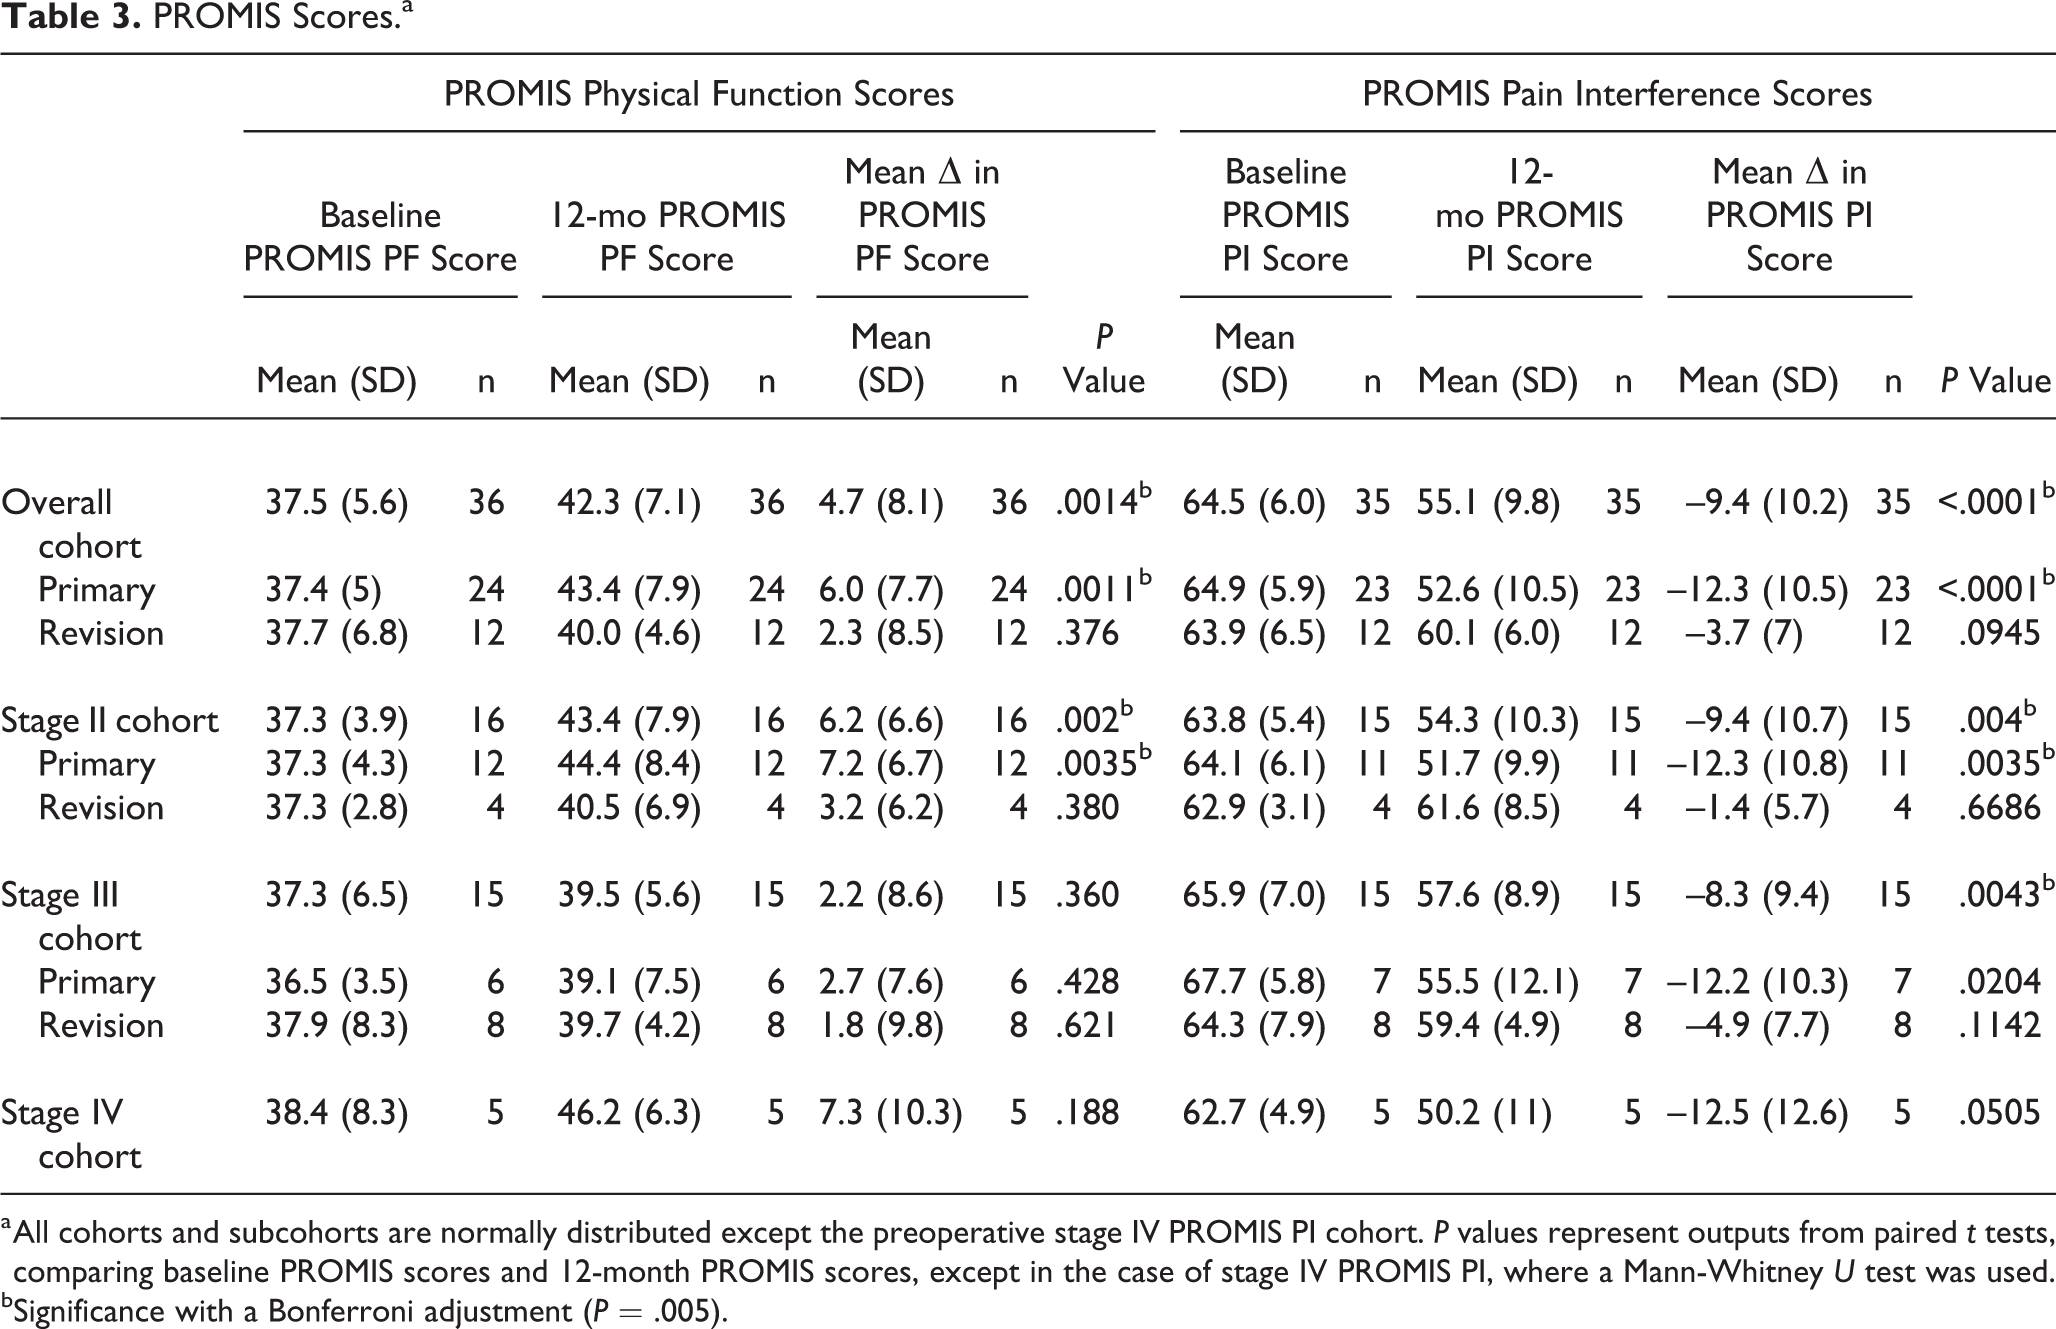
a All cohorts and subcohorts are normally distributed except the preoperative stage IV PROMIS PI cohort. P values represent outputs from paired t tests, comparing baseline PROMIS scores and 12-month PROMIS scores, except in the case of stage IV PROMIS PI, where a Mann-Whitney U test was used.
bSignificance with a Bonferroni adjustment (P = .005).
Results
PROMIS Scores
PROMIS PF scores for the overall cohort increased significantly from 37.5 ± 5.6 to 42.3 ± 7.1 (P = .0014), indicating an increase in functionality postoperatively. The average change in PROMIS PF scores for the overall cohort was 4.7 ± 8.1, 6.2 ± 6.6 for the stage II overall cohort, 2.2 ± 8.6 for the stage III cohort, and 7.3 ± 10.3 for the stage IV overall cohort. After applying the Bonferroni adjustment, postoperative PROMIS PF scores were significantly different from preoperative scores for patients who underwent primary surgeries for the overall cohort (P = .0011) and the stage II cohort (P = .002). One-way analysis of variance found no significant differences in preoperative, postoperative, or change in PROMIS PF scores between PCFD stages (P > .05). No significant differences were found in preoperative, postoperative, or change in PROMIS PF scores when comparing patients who had primary and revision surgeries for the overall cohort. PROMIS PF scores are shown in Table 3.
PROMIS PI scores for the overall cohort decreased significantly from 64.5 ± 6.0 to 55.1 ± 9.8 (P < .0001), indicating a significant decrease in pain postoperatively. The average change in PROMIS PI score was –9.4 ± 10.2 for the overall cohort, –9.4 ± 10.7 for the overall stage II cohort, –8.3 ± 9.4 for the overall stage III cohort, and –12.5 ± 12.6 for the stage IV cohort. Applying the Bonferroni adjustment, PROMIS PI scores also decreased significantly for patients in the overall cohort, overall primary cohort, stage II cohort, primary stage II cohort, and the stage III cohort (P < .005). No significant difference was found in preoperative, postoperative, or change in PROMIS PI scores between PCFD stages (P > .05). No significant differences were found in preoperative or postoperative PROMIS PI scores when comparing patients who had primary and revision surgeries for the overall cohort. However, change in PROMIS PI scores was significantly greater from baseline for patients who underwent primary surgeries (–12.3) compared to revision surgeries (–3.7) (P = .0157). PROMIS PI scores are shown in Table 3.
Table 4 shows operative success and failure as determined by MCIDs for both the PROMIS PF and PROMIS PI domains. Overall, 23 patients (64%) had successful surgeries in the PROMIS PF domain and 25 patients (71%) had successful surgeries in the PROMIS PI domain. Among patients who had primary operations, 71% and 78% of patients had successful surgeries in the PROMIS PF and PROMIS PI domains, respectively. Fifty percent and 58% of patients who had revision surgeries had successful operations in the PROMIS PF and PROMIS PI domains, respectively.
Minimum Clinically Important Differences.a
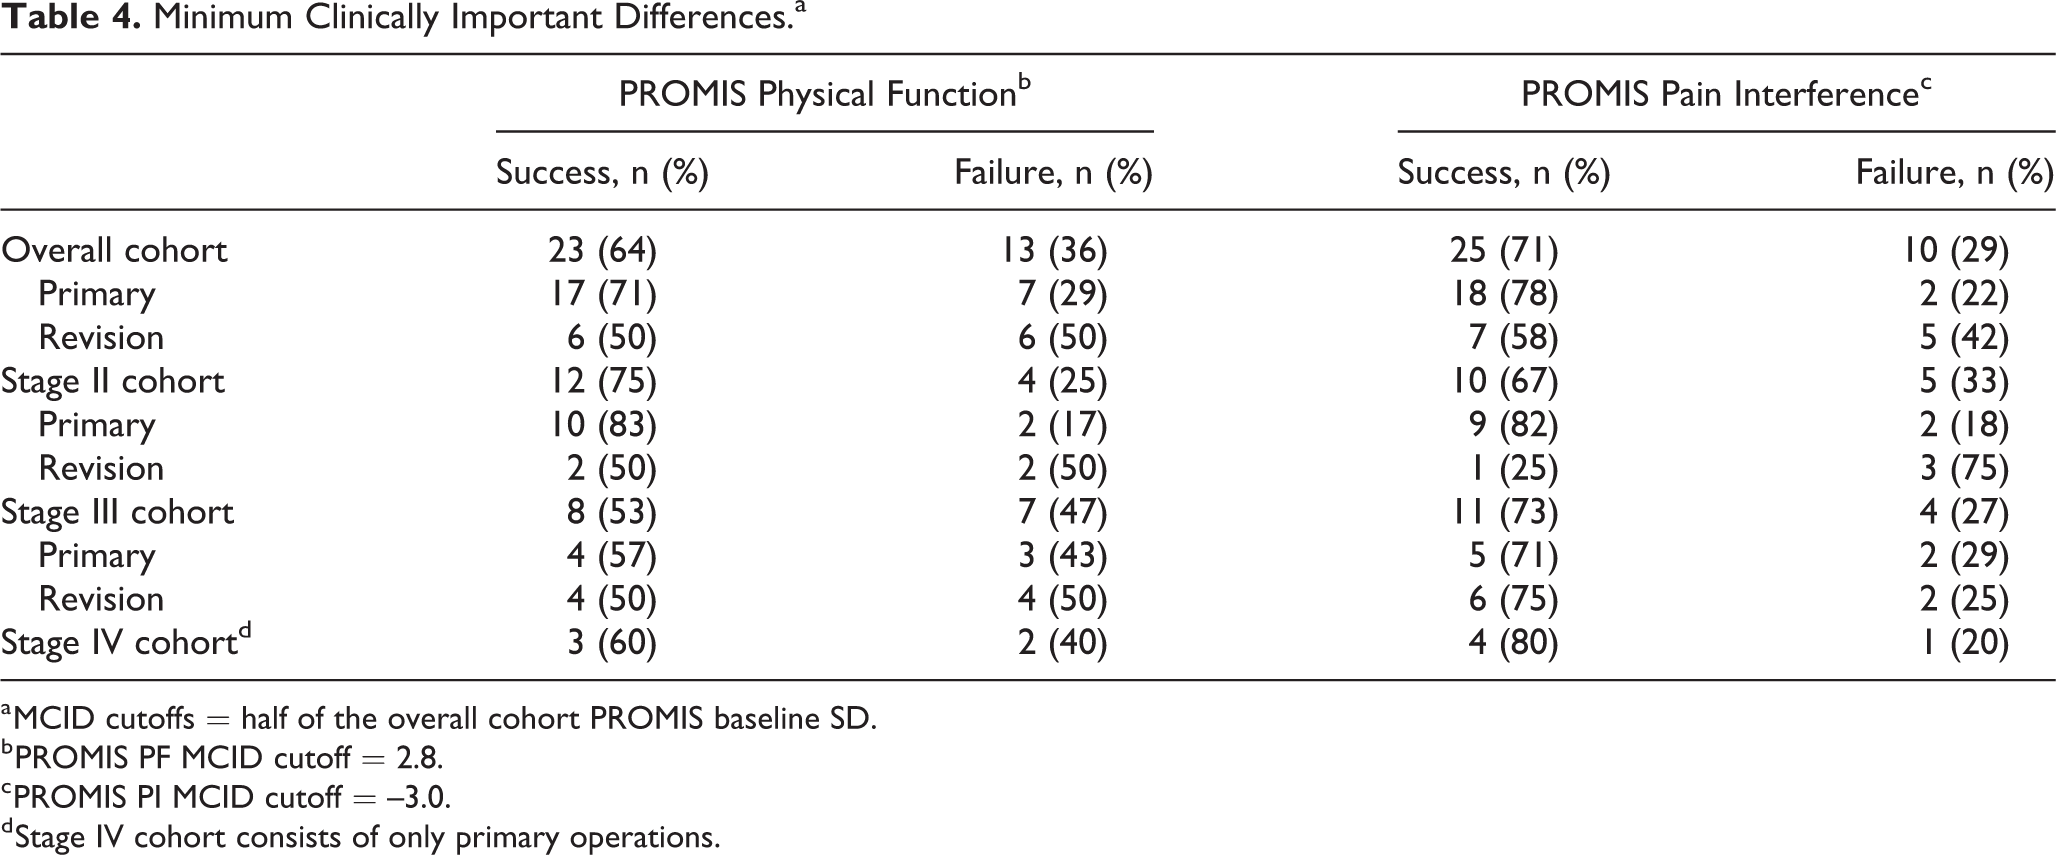
a MCID cutoffs = half of the overall cohort PROMIS baseline SD.
b PROMIS PF MCID cutoff = 2.8.
c PROMIS PI MCID cutoff = –3.0.
d Stage IV cohort consists of only primary operations.
Radiographic Measurements
All 6 radiographic measurements for the overall cohort showed significant improvement when comparing preoperative and postoperative films. The talonavicular uncoverage angle decreased from 31.7 ± 13.9 to 22.3 ± 10.6 (P = .0315), talonavicular uncoverage percentage decreased from 36.1 ± 13.2 to 26.3 ± 11.8 (P = .0029), AP talo–first metatarsal angle decreased from 14.7 ± 10.1 to 9.7 ± 7.8 (P = .0069), Meary angle decreased from 22.0 ± 9.1 to 15.4 ± 7.9 (P < .0001), medial cuneiform height increased from 10.2 ± 6.4 to 15.1 ± 5.0 (P < .0001), and medial cuneiform–fifth metatarsal height increased from –0.23 ± 9.4 to 8.0 ± 6.9 (P <.0001).
PROMIS-Radiographic Correlations
Preoperative PROMIS scores largely did not correlate with preoperative radiographic variables for the overall cohort or stratified by PCFD stage or primary/revision operations. The only significant correlation was a moderate inverse correlation (r = –0.606, P = .0479) between preoperative PROMIS PI scores and preoperative medial cuneiform–fifth metatarsal height for patients who underwent primary operations for stage II PCFD. This indicates that lower preoperative pain scores were significantly associated with larger preoperative medial cuneiform–fifth metatarsal heights and vice versa.
Similarly, postoperative PROMIS scores generally did not correlate significantly with postoperative radiographic variables. In patients who had stage II PCFD, postoperative PROMIS PF scores positively correlated with postoperative medial cuneiform height (r = 0.5033, P = .0322). For patients who had primary stage II PCFD reconstructions, PROMIS PF and PROMIS PI scores correlated with postoperative medial cuneiform height (PROMIS PF: r = 0.7725, P = .0020; PROMIS PI: r = –0.5692, P = .0446). This indicates that, postoperatively, higher functionality and lower pain was significantly associated with larger medial cuneiform height measurements.
For the overall cohort, change in PROMIS PI scores showed a moderate inverse relationship with change in Meary angle (r = –0.3452, P = .0491). When stratified by primary and revision surgeries, no relationship exists in primary surgeries; however, there is a strong inverse relationship between change in PROMIS PI and change in Meary angle in revision surgeries (r = –0.8647, P = .0001). This relationship was present in both revision stage II (r = –0.9878, P = .0122) and revision stage III (r = –0.8829, P = .0198) reconstructions. This indicates that small changes in Meary angle after revision procedures are associated with large changes in patient-reported pain and vice versa.
Postoperative Complications
There was one complication in the primary stage II cohort. The patient had a nonunion of their calcaneal lengthening osteotomy, which was revised at 6 months. No complications occurred in the revision stage II cohort.
There were no complications in the primary stage III cohort. However, there were 2 complications in the revision stage III cohort. One patient had a wound infection that required treatment with antibiotics, incision and debridement, and eventual plastics surgery closure with a free flap and skin graft at 5 months postoperatively. The second patient progressed to have ankle valgus postoperatively (Figures 4 and 5) but opted for conservative management.
There were 3 complications in the stage IV cohort. Two patients had persistent ankle valgus postoperatively, despite operative correction in the operating room. One patient underwent a revision deltoid reconstruction at 6 months, and the other patient (Figures 6 and 7) underwent a revision deltoid reconstruction at 12 months. The third complication was a wound infection treated with antibiotics, incision and debridement, and eventual free flap closure by plastic surgery at 6 months postoperatively.
Discussion
PCFD is one of the most controversial topics in the foot and ankle literature. There is significant debate regarding the optimal corrective technique to achieve functional outcomes after reconstruction. However, there is a paucity of studies that discuss functional outcomes after operative correction. Most of the present studies are small and retrospective in nature. 4,15,17 -19,30,32,33,35 There are even fewer studies that evaluate prospective data. 26,43,45 This prospective study provides a survey of operative outcomes by PCFD stage and builds on Deland et al 12 by using PROMIS instead of legacy PROs and providing data on stage IV reconstructions. This study also provides radiographic outcomes by stage and correlates this data with PROMIS scores. To our knowledge, this is the first study that stratifies PCFD reconstructions by primary vs revision operations.
Overall, patients do well after PCFD reconstruction. PROMIS PF, PROMIS PI, and all radiographic angles measured improved significantly for the overall cohort. Furthermore, 64% and 71% of surgeries were successful as defined by MCID in the PROMIS PF and PROMIS PI domains, respectively. These findings are similar to Brodell et al, 7 who found PROMIS scores and radiographic measurements improved significantly after stage IIb and stage IV deltoid-spring reconstruction.
Although we do have a limited sample size, our study was unable to determine any significant differences in preoperative, postoperative, or change in PROMIS PF and PROMIS PI scores between stage II, III, and IV PCFD reconstructions. Similarly, Deland et al 12 found there were no significant differences in the AOFAS hindfoot scale in patients who underwent stage IIa, stage IIb, and stage III PCFD reconstructions.
When stratifying our data by primary reconstructions, stage II, III, and IV reconstructions had nearly equivalent improvements in PROMIS PI (change: –12.3, –12.2, and –12.5, respectively). Stage II and stage IV patients had nearly equivalent changes in PROMIS PF from baseline (change: +6.2 and +7.3, respectively). Our improvement in PROMIS scores for primary stage II and stage IV reconstructions are similar to those reported by Brodell et al. 7 On the other hand, stage III patients undergoing primary operations had a small increase in functionality from their baseline (change: +2.2). Likewise, Deland et al 12 found that patients who underwent arthrodesis procedures had lower AOFAS hindfoot scores compared to those who underwent osteotomies. Because stage III reconstructions are joint-sacrificing procedures meant to primarily reduce pain, a small change in functionality is not unexpected. 12,40
After applying the Bonferroni adjustment, patients undergoing primary reconstructions had significantly lower postoperative PROMIS PI scores compared with baseline (P < .0001). Patients undergoing primary reconstructions had postoperative PROMIS PF scores that were significantly higher compared with baseline (P = .0011). Patients undergoing revision reconstructions had improved PROMIS scores postoperatively compared to baseline that ultimately did not reach significance. Comparing primary and revision surgeries in the overall cohort, patients who underwent primary operations improved more than those who underwent revision operations. Change in PROMIS PF was greater after primary operations (+6.0) compared to revision operations (+2.3) but did not reach significance. However, PROMIS PI improvement was significantly greater after primary (–12.3) vs revision operations (–3.7) (P = .0157). These findings are expected as revision surgeries have been linked to inferior patient-reported outcomes, 27,34 increased complication rates, 13 and higher costs 39 within orthopedic surgery.
Recent studies have described inferior PROs related to radiographic overcorrection in the forefoot and midfoot after primary stage II PCFD reconstructions. 8,9 Conti et al 8 found that correcting the talonavicular joint to an adducted position compared to an abducted position was associated with significantly worse PRO scores probably due to overloading of the lateral column and increased lateral discomfort. 10,14,42 Conti et al, 8 using normative measurements from Kang et al, 22 defined a “mildly abducted” foot as a talonavicular angle and talo–first metatarsal angle greater than 18. Angles between –2 and 18 degrees were considered normal. In our cohort, care was taken not to overcorrect the midfoot: the average stage II patient had a postoperative talonavicular uncoverage angle of 23.9 degrees, indicating mild abduction, and an AP talo–first metatarsal angle of 12.8, indicating operative correction to the normal range. 8,22
Conti et al 9 also described the significant correlation between reconstructing the medial longitudinal arch and FAOS scores in stage II patients who underwent primary reconstructions. In our study, smaller preoperative medial cuneiform-fifth metatarsal height correlated significantly with higher preoperative pain scores (r = –0.606; P = .0479) in the primary stage II reconstruction cohort. Postoperatively, medial cuneiform height correlated significantly with improved PROMIS PF (r = 0.7725; P = .0020) and PROMIS PI (r = –0.5642; P = .0446) scores. Arangio et al 3 showed that a decrease in medial cuneiform height is a significant predictor of PCFD; our study showed that reconstruction of the medial cuneiform height in stage II patients undergoing primary reconstruction was tied to improved patient-reported outcomes.
Interestingly, our data showed a significant negative correlation between change in Meary angle and change in PROMIS PI for the overall PCFD cohort (r = –0.3452, P = .0491). When stratifying the data by primary vs revision operations, the significant relationship remains only in revision procedures (r = –0.8647; P = .0001). This relationship was present in both stage II (r = –0.9878; P = .0122) and stage III (r = –0.8829; P = .0198) revision surgeries. Although we are uncertain about the reason behind these correlations, we hypothesize that small, simple revision surgeries that result in small radiographic changes often lead to large improvements in pain. However, patients who have extensive deformity following their previous operation require large radiographic reconstructions that may not provide substantial patient-reported improvements. For example, primary stage III arthrodesis can be complicated by lateral ankle arthritis and ankle valgus in 11% to 28% of patients, requiring revision. 23,24 Three of 8 revision stage III patients in our cohort had severe ankle valgus on presentation. Revisions in these cases require large reconstructions radiographically that may not translate to improved functionality and pain. In these severe revision deformities, a planned staged operation to address both the hindfoot and the ankle may be required to improve outcomes significantly.
There are a few important limitations to this study that should be considered. First, the study had 46 patients included in the study. Due to stratifying patients by PCFD stage and primary or revision surgery, each sub-group had a relatively small number of patients. Consequently, it is possible that the study may have been subject to type I error. This study also did not subcategorize stage II patients into stage IIa (mild flexible flatfoot, <30% talonavicular uncoverage) and stage IIb (severe flexible flatfoot, >30% talonavicular uncoverage) because of small sample sizes. 11 In addition, this prospective study could have been subject to selection bias since patients who had successful PCFD operations are less likely to follow up, potentially skewing the results. Lastly, our study may have benefited from a longer time to follow-up. Although our average time to follow-up was 23.0 months, minimum time to follow-up for our study was 12 months. Regardless, previous studies suggest that more rapid improvement in orthopedic surgery occurs in the first 6 months of recovery. 5,6,37 Further prospective studies with larger sample sizes and times to follow-up should be conducted.
In conclusion, PROMIS PF, PROMIS PI, and radiographic variables improved significantly after PCFD reconstruction. We found no significant difference in PROMIS PF and PROMIS PI between stage II, III, and IV reconstructions. However, stage III patients had a smaller improvement in functionality compared to stage II and stage IV patients. As expected, primary surgeries had better postoperative improvements in pain and functionality compared to revision surgeries. Lastly, our study confirmed that maintaining slight abduction through the forefoot and midfoot, while reconstructing the medial longitudinal arch, lead to good patient-reported outcomes. This survey of patient-reported and radiographic outcomes after primary and revision stage II, III, and IV PCFD should aid clinical decision making and provide metrics on how much operative improvement can be expected after PCFD reconstruction.
Supplemental Material
Supplemental Material, sj-pdf-1-fao-10.1177_2473011421992111 - Patient-Reported Outcomes and Radiographic Assessment in Primary and Revision Stage II, III, and IV Progressive Collapsing Foot Deformity Surgery
Supplemental Material, sj-pdf-1-fao-10.1177_2473011421992111 for Patient-Reported Outcomes and Radiographic Assessment in Primary and Revision Stage II, III, and IV Progressive Collapsing Foot Deformity Surgery by Rusheel Nayak, Milap S. Patel and Anish R. Kadakia in Foot & Ankle Orthopaedics
Footnotes
Ethics Approval
Ethical approval for this study was obtained from Northwestern University IRB (STU00084014).
Declaration of Conflicting Interests
The author(s) declared no potential conflicts of interest with respect to the research, authorship, and/or publication of this article. ICMJE forms for all authors are available online.
Funding
The author(s) received no financial support for the research, authorship, and/or publication of this article.
References
Supplementary Material
Please find the following supplemental material available below.
For Open Access articles published under a Creative Commons License, all supplemental material carries the same license as the article it is associated with.
For non-Open Access articles published, all supplemental material carries a non-exclusive license, and permission requests for re-use of supplemental material or any part of supplemental material shall be sent directly to the copyright owner as specified in the copyright notice associated with the article.