
Abstract
Background:
At present, the geographic distribution of orthopedic foot and ankle (OFA) surgeons in the United States is poorly defined. The purpose of this investigation is to determine the geographic distribution of OFA surgeons in the United States. We hypothesize that there will be differences in OFA surgeon density throughout the United States and that economic factors may play a role in access to subspecialty OFA care.
Methods:
A current membership list was obtained from the American Orthopaedic Foot & Ankle Society (AOFAS). Active members were categorized relative to states and US congressional districts, using publicly available census data. The relationship between income and surgeon density was determined using a Pearson correlation.
Results:
We identified a list of 1103 active AOFAS members. There was an average of 0.38 and 0.40 OFA surgeons per 100 000 people in each state and congressional district, respectively. We found a weak negative relationship demonstrating that regions with higher levels of poverty had fewer OFA surgeons, with a Pearson correlation coefficient of –0.14 (95% CI: –0.24, –0.04), P = .008.
Conclusion:
There is wide geographic variation of OFA surgeon density throughout the United States. Regions with higher levels of poverty were weakly associated with decreased population density of OFA surgeons compared to regions with lower poverty levels. Understanding these trends may aid in developing both recruitment and referral strategies for complex foot and ankle care in underserved regions.
Level of Evidence:
Level V.
Introduction
The specialty of orthopedic surgery has become increasingly subspecialized since fellowships were established in the 1970s. In 2013, 90% of applicants for American Board of Orthopaedic Surgery certification were fellowship trained, and 78% percent of the surgeries were from within the areas of the applicant’s fellowship subspecialty training. 10 However, access to specialty care is limited, compared with the care of generalists. 9 Access to subspecialty care, including orthopedic foot and ankle (OFA) surgeons, is even more limited. Previous investigations within hand and urologic surgery have demonstrated an uneven geographic distribution of these subspecialty and specialty surgeons, respectively. 2,12 At present, geographic distribution of OFA surgeons in the United States is not well defined.
In addition to distribution, the per capita number of OFA surgeons impacts care. Although older models predicted a physician surplus, more recent models predict physician shortages across specialties. 6,16 Projections show a 3% increase in orthopedic surgeons from 2005 to 2020. 8 Statewide health is based on physicians per capita, both primary care and specialist. 5 Additionally, the income of a geographic region influences physician supply and quality of care. 5 General orthopedic surgeons and podiatrists are specialists who provide foot and ankle care. However, there are advantages to subspecialty care. When comparing ankle arthroplasty and ankle arthrodesis operations performed by OFA surgeons with podiatrists, there was lower cost and length of stay for the procedures performed by OFA surgeons. 4
The purpose of this investigation is to determine the geographic distribution of OFA surgeons in the United States. We hypothesize that there will be differences in OFA surgeon density throughout the United States and that economic factors may play a role in access to subspecialty OFA care.
Methods
This study was reviewed by our institutional review board and received exempt status. A current list of all members and addresses was obtained from the American Orthopaedic Foot & Ankle Society (AOFAS) in spreadsheet format. Only Active AOFAS members were included. Using the zip codes and practice locations, OFA surgeons were sorted by congressional districts from the United States House of Representatives website, corresponding to the 115th US congress. 14 Multiple addresses were included if applicable. Using the publicly available census data, we recorded population within each district as well as the percentage of families and people with income below the poverty level. 15 These data are obtained on a yearly basis by the census bureau using the American Community Survey and County Business Patterns. The information was recorded in Microsoft Excel (Microsoft Corp, Redmond, WA). Descriptive statistics were used for demographic information. The relationship between income level and the number of surgeons was determined using Pearson correlation with SAS v9.4 (SAS Institute, Inc, Cary, NC). These data were used to generate OFA surgeons per capita at a state and congressional district level, which was compared to benchmark data found in the literature. This information was also used to generate choropleth maps using Tableau software (Tableau Software, LLC, a Salesforce Company, Seattle, WA). These maps show population density of OFA surgeons throughout the United States as well as poverty relative to OFA surgeon density.
Results
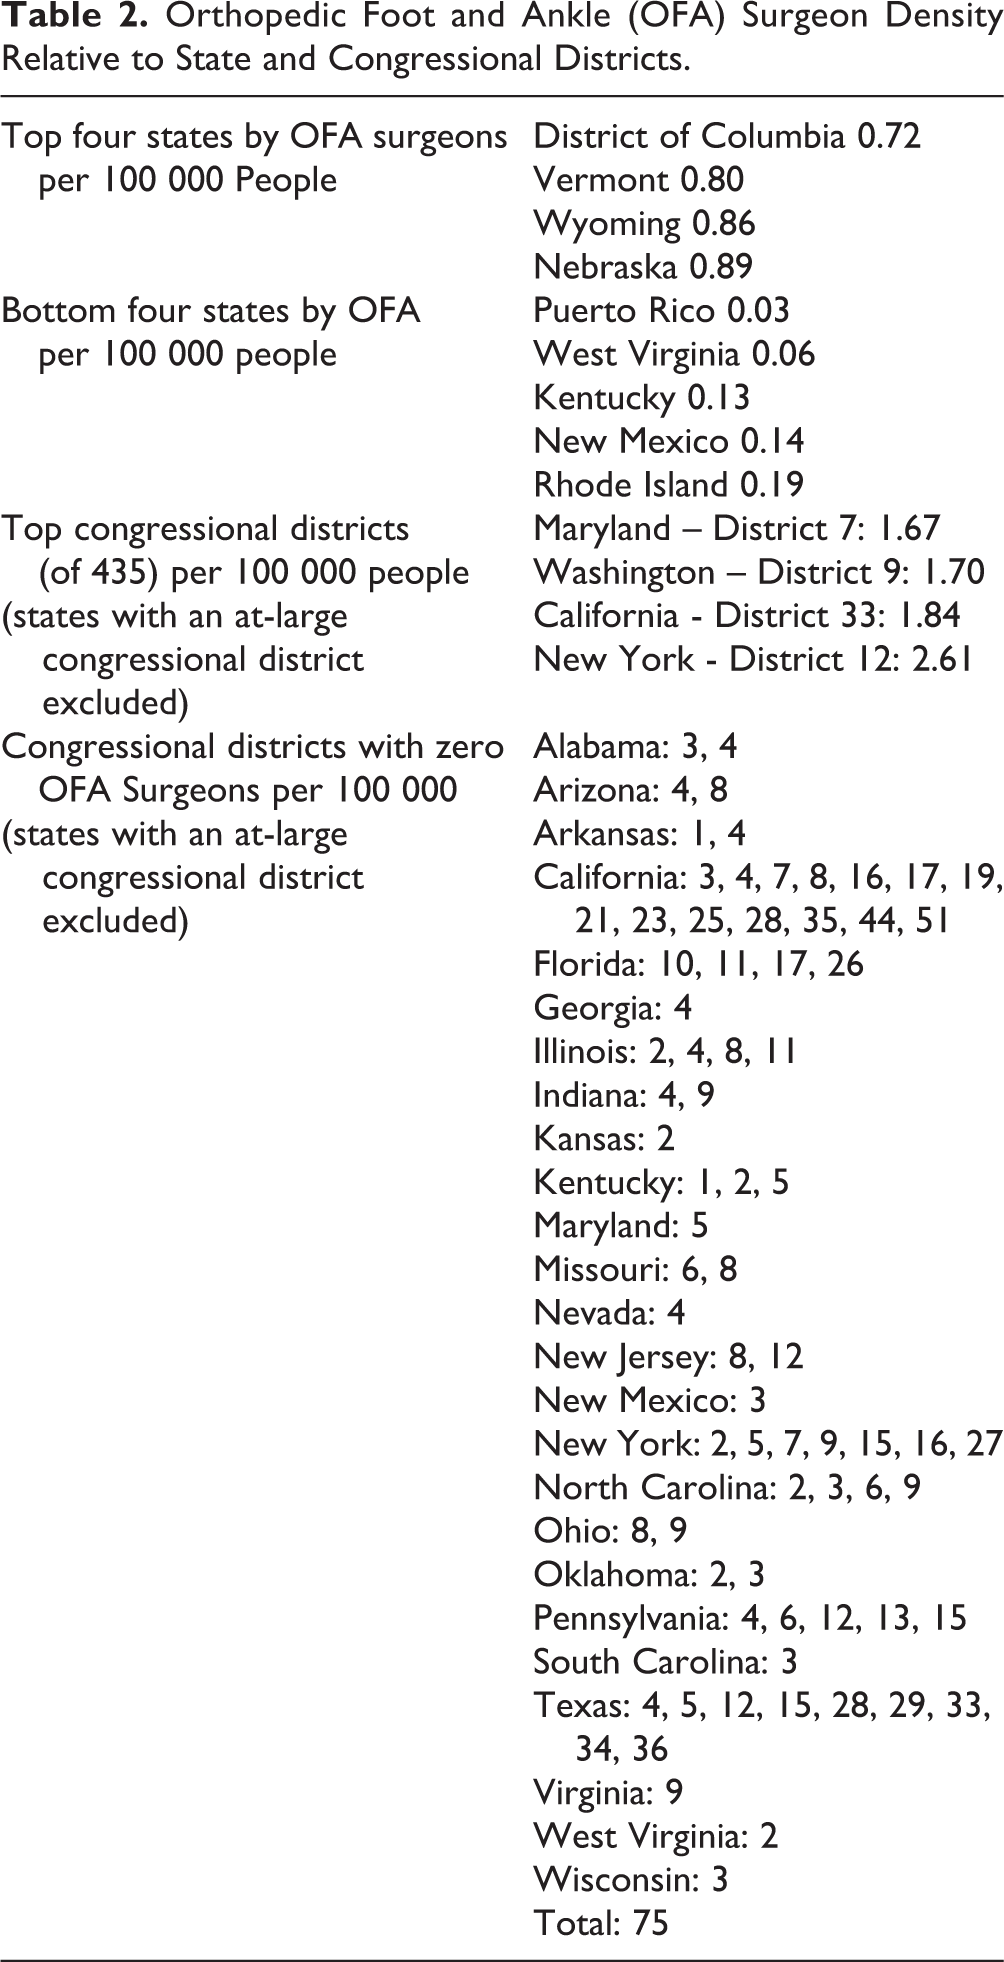
The AOFAS provided a list of 1103 active members with 1311 practice addresses. Table 1 includes statewide demographic information for population and surgeon density. There was an average of 0.38 OFA per 100 000 people per state. Nebraska had the highest density of OFA surgeons at 0.89 per 100 000 people. Puerto Rico had the lower density of OFA surgeons at 0.03 per 100 000 people. There is an average of 0.40 OFA surgeons per 100 000 people (range 0-2.61), at the congressional district level (Table 2). Figure 1 is a choropleth map indicating the geographic distribution of OFA surgeons throughout the United States, including some areas that do not have any OFA surgeons. In addition to population data, economic data were recorded for each congressional district. The number of OFA surgeons was compared to the number of individuals and families living below the federally defined poverty level. The Pearson correlation coefficient was –0.14 (95% CI: –0.24, –0.04), P = .008; a statistically significant negative relationship indicating that regions with higher levels of poverty had fewer OFA surgeons (Figure 2). Figure 3 is a choropleth map of poverty and the geographic distribution of OFA surgeons throughout the United States.
Orthopedic Foot and Ankle (OFA) Surgeons Per State.

Orthopedic Foot and Ankle (OFA) Surgeon Density Relative to State and Congressional Districts.

Choropleth map of the geographic distribution of OFA surgeons throughout the United States.
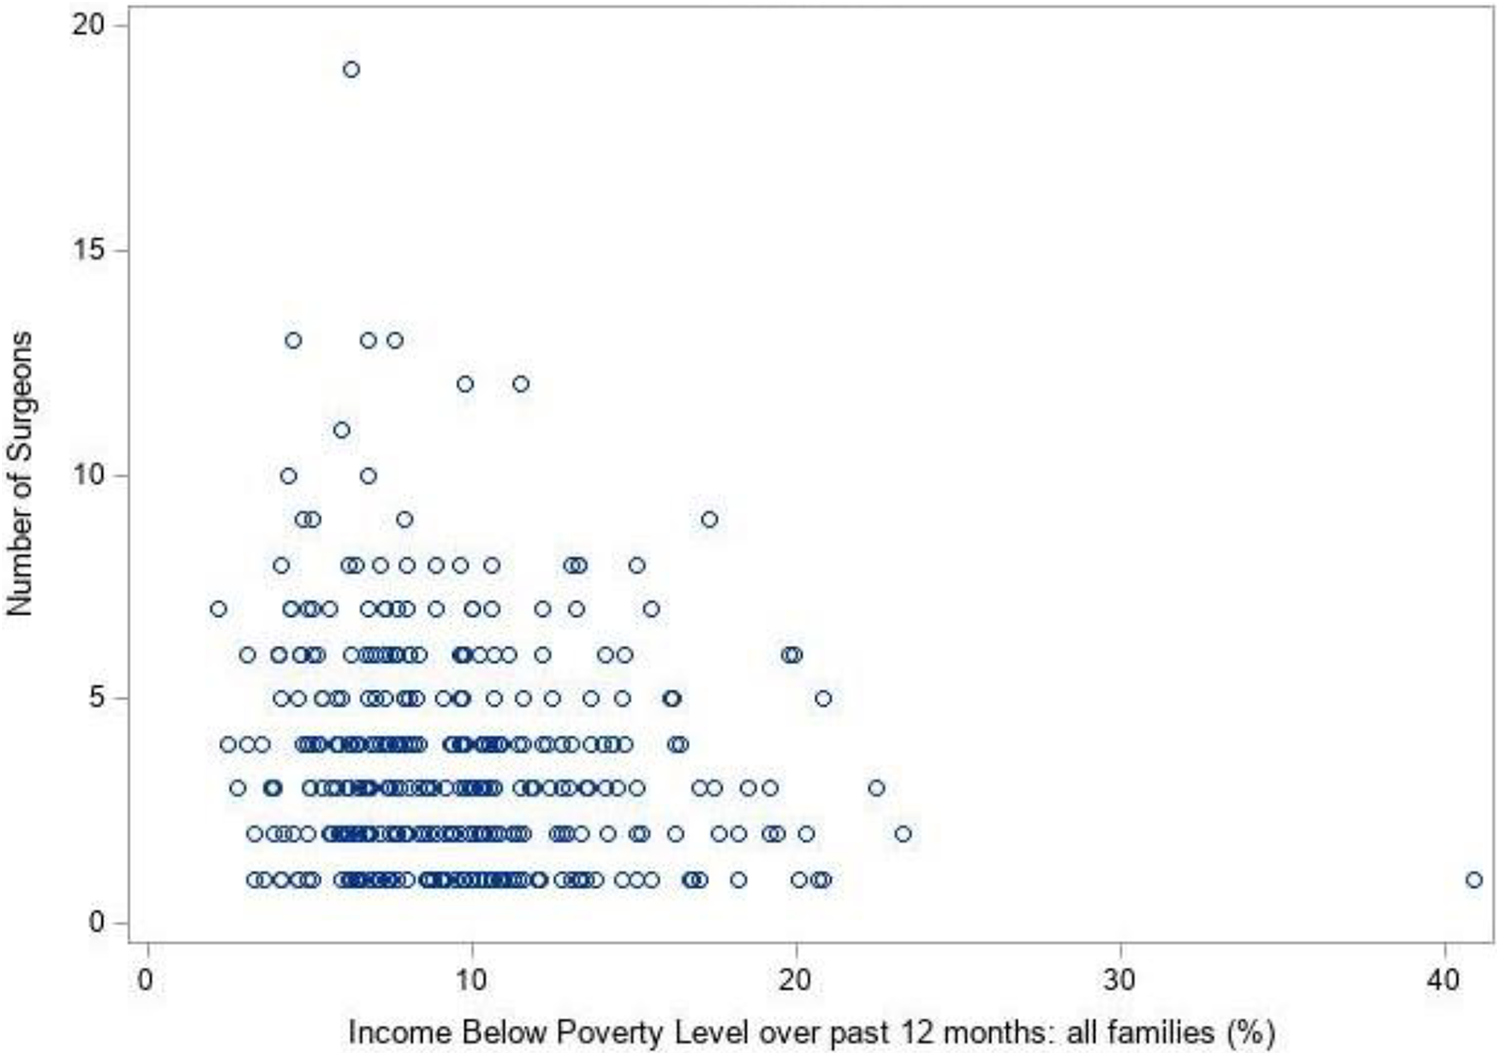
This scatterplot demonstrates the relationship between OFA surgeons and poverty with a Pearson correlation coefficient of –0.14 (95% CI: –0.24, –0.04), P = .008. This is a statistically significant negative relationship indicating that regions with higher levels of poverty had fewer OFA surgeons.

Choropleth map of poverty throughout the United States with the geographic distribution of OFA surgeons represented by red circles. The blue scale color represents the poverty level. The red circles represent OFA surgeon density. Larger dots correspond to a higher population of OFA surgeons.
Discussion
There is wide variation with respect to OFA surgeon density throughout the United States, both on a state and congressional district level. In the hand literature, surgeon density correlated with population at the state but not congressional district level. 2 The majority of congressional districts had a suboptimal number of hand surgeons. 2 For urologic surgery, most surgeons are clustered in metropolitan counties (compared to nonmetropolitan and rural counties). 12 The ideal number of orthopedic surgeons is 6.12-9.4 per 100 000 people. 6,11,13,16 Within hand and upper-extremity surgery, a study in Great Britain demonstrated that 1 hand surgeon is needed per 125 000 people. 3 Recalculated, this is 0.8 surgeons per 100 000 people. All states had fewer than 1 OFA surgeon per 100 000 of population, with the average being 0.38 OFA surgeons per 100 000 people. This makes the density of OFA surgeons less than the ideal number of hand surgeons. Owing to variation in the geographic distribution of OFA surgeons, some congressional districts had a higher per capita level of OFA surgeons than at the state level, as high as 2.61 per 100 000 people. However, 75 total congressional districts had no OFA surgeons. The density of OFA surgeons in all areas is less than the number of general orthopedic surgeons needed.
Although the number of OFA surgeons needed is unknown, there are statistics published by the American Academy of Orthopaedic Surgeons (AAOS) regarding the number and type of orthopedic ambulatory visits. In 2000, there were 2 320 252 ankle-related visits, increasing to 3 884 160 in 2010. In 2000, there were 5 833 250 foot and toe–related visits increasing to 6 348 516 in 2010. 1 These data represent an increasing trend in visit frequency and suggest an increasing need for OFA surgeons.
We found that in regions of high poverty, there are fewer OFA surgeons compared to regions with lower poverty levels. The Federal Office of Rural Health Policy has subsidies to strengthen rural health infrastructure. 7 Our study includes all regions of the United States, including those with available subsidies. Despite available resources, our data suggest a correlation between poverty and a lack of OFA subspecialist care. These trends can be detrimental with respect to obtaining OFA subspecialty care in regions with high poverty levels. Identifying regions with low access to high-level OFA care may aid in developing future recruitment strategies for these regions.
This study had several limitations. It included only active AOFAS members. AOFAS members must be board-certified orthopedic surgeons with an interest in foot and ankle care. Members are not required to be foot and ankle fellowship trained. Non-AOFAS members may provide foot and ankle care; however, it is likely that complex reconstruction and revision procedures will be performed more frequently by AOFAS members. Further, by including AOFAS members only, we exclude the general orthopedic surgeon or podiatrist specialists providing foot and ankle care. Additionally, we used all addresses providers had listed to accurately count the locations OFA surgeons practice in congressional district(s). By using this method, we may be overcounting the total number of OFA surgeons in each congressional district. Finally, the Pearson correlation coefficient demonstrated a statistically significant but weak correlation between the number of OFA surgeons and poverty.
Conclusions
The distribution of OFA surgeons throughout the United States is not uniform. We found a weak negative relationship between regions with higher levels of poverty and lower population density of OFA surgeons.
Supplemental Material
Supplemental Material, sj-pdf-1-fao-10.1177_24730114211003555 - Geographic Distribution of Foot and Ankle Orthopedic Surgeons Throughout the United States
Supplemental Material, sj-pdf-1-fao-10.1177_24730114211003555 for Geographic Distribution of Foot and Ankle Orthopedic Surgeons Throughout the United States by Matthew Fanelli, Coleman Cush, Hui Zhang, Benjamin Wagner, Amanda J. Young, Louis Christopher Gradizio and Gerard Cush in Foot & Ankle Orthopaedics
Footnotes
Ethics Approval
Ethical approval for this study (ID #: 2018-0713) was waived by the Geisinger Institutional Review Board after they classified our work as “research that does not involve human subjects.”
Declaration of Conflicting Interests
The author(s) declared no potential conflicts of interest with respect to the research, authorship, and/or publication of this article. ICMJE forms for all authors are available online.
Funding
The author(s) disclosed receipt of the following financial support for the research, authorship, and/or publication of this article: Geisinger Health System Foundation 19-074.
References
Supplementary Material
Please find the following supplemental material available below.
For Open Access articles published under a Creative Commons License, all supplemental material carries the same license as the article it is associated with.
For non-Open Access articles published, all supplemental material carries a non-exclusive license, and permission requests for re-use of supplemental material or any part of supplemental material shall be sent directly to the copyright owner as specified in the copyright notice associated with the article.